|
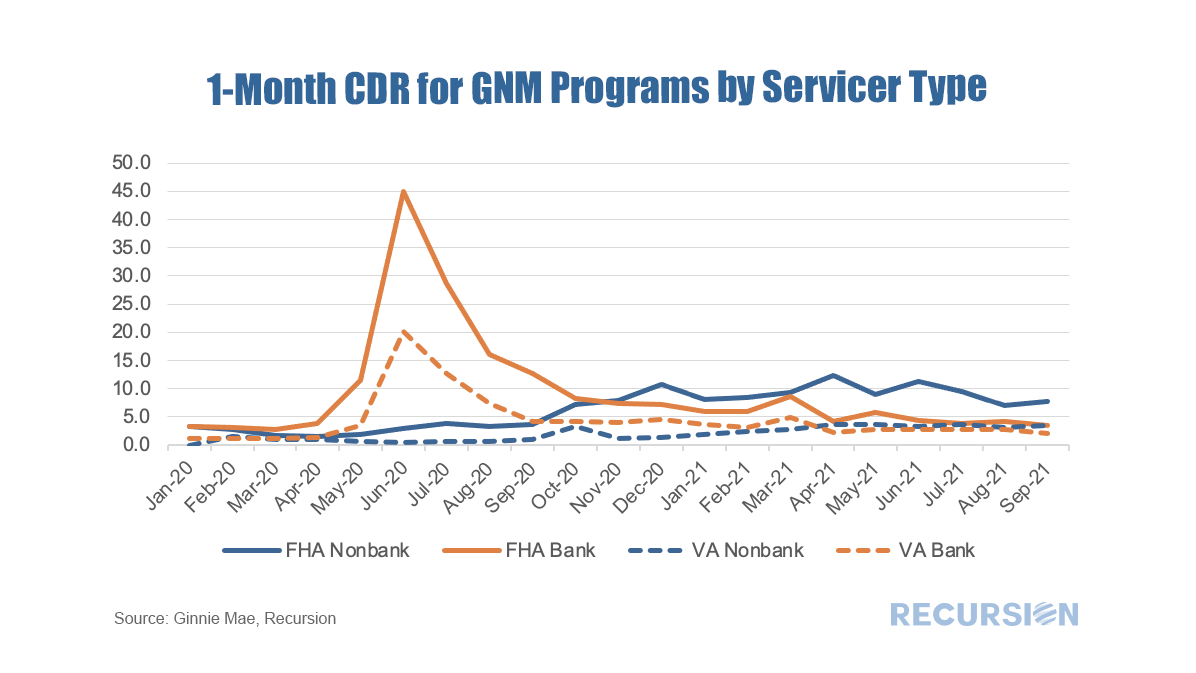
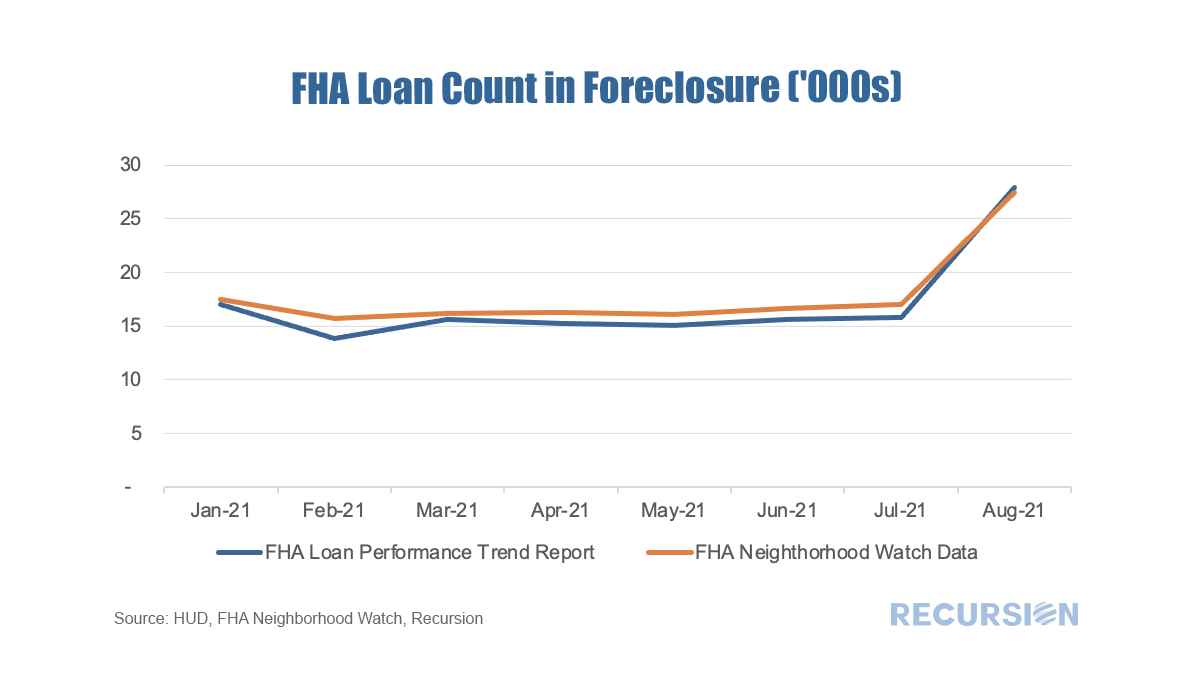
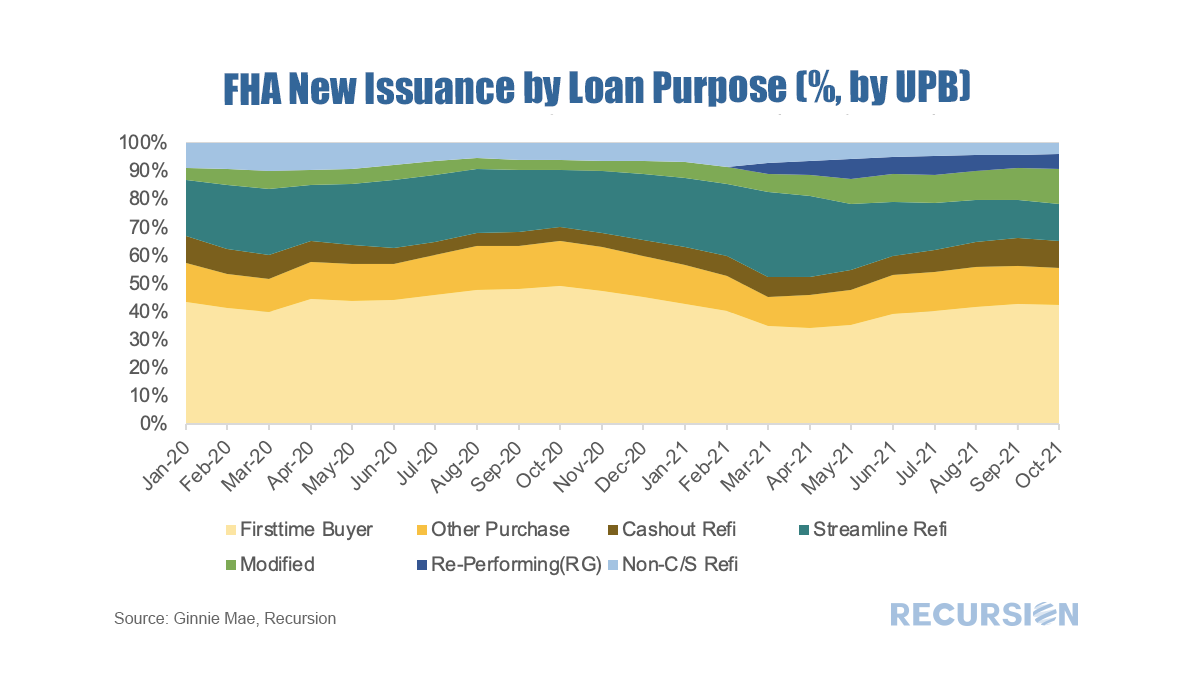
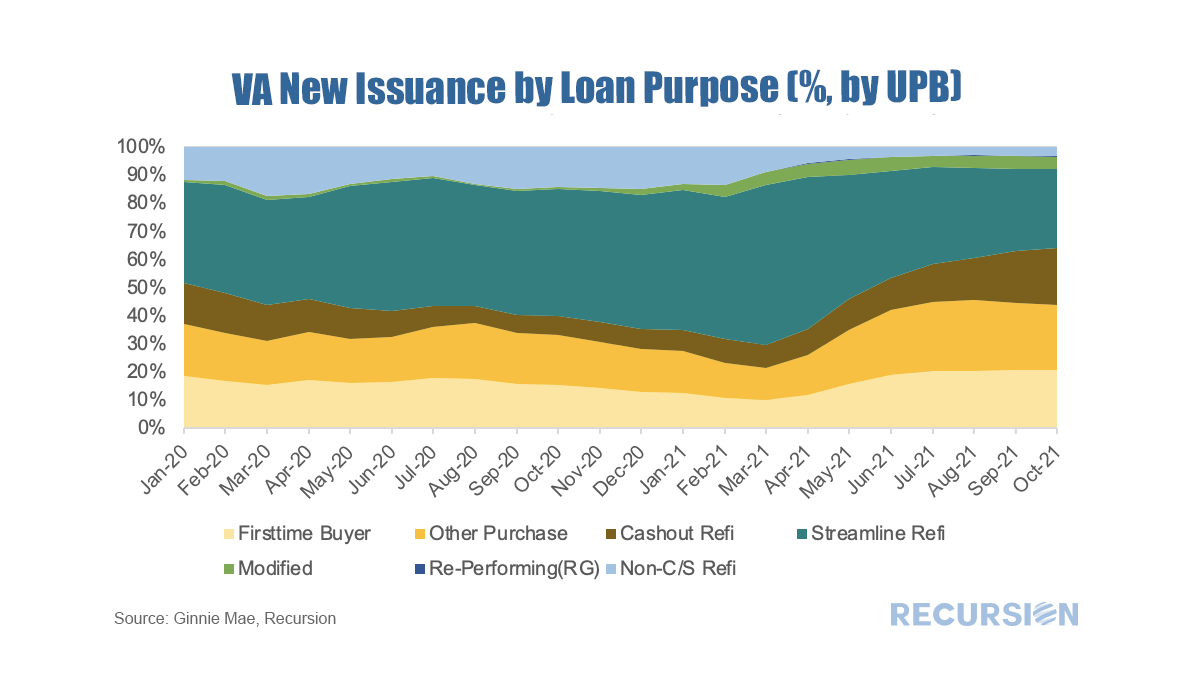
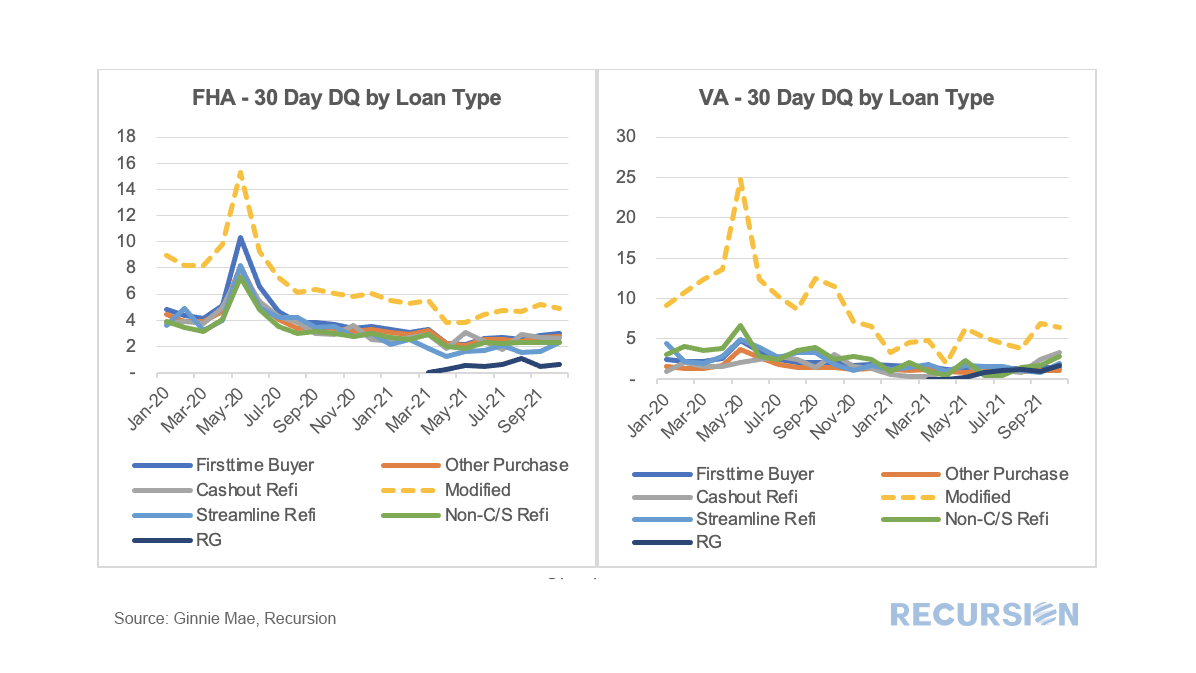
As we approach year-end and the beginning of the process of phasing out forbearance programs, the natural question market participants are asking is which indicators should they be watching to gain a sense of the mortgage landscape in 2022. Along these lines, there is a significant difference between the Ginnie Mae programs and the GSE’s. In particular, for conforming loans, it is the Agencies themselves that buy nonperforming loans out of pools, while for FHA and VA, this function is performed by servicers. As the timeframe for buyouts on the part of the GSE’s was extended to 24 months earlier this year, we won’t see much activity prior to April 2022 on this front[1]. So in this post, we focus on the Ginnie Mae programs. As we have written previously, it is challenging to follow the path of a loan once it has been purchased out of a pool. At the aggregate level, we can view the activity of individual lenders using the FHA Neighborhood Watch data[2]. In terms of the process, a nonperforming loan is bought out of a pool, and one of three actions can be taken. First, the borrower can be taken into foreclosure. Second, the borrower can become current and roll the unpaid balance into a second lien, in a process known as a partial claim. Third, the borrower can accept a loan modification. In terms of the scale of buyouts, after an early spurt of activity in 2020 on the part of some parties, notably banks, the involuntary prepayment rate, measured by CDR(constant default rate), has settled down in recent months. FHA nonbank servicers have been more active in this space than other categories over the past year. As forbearance plans begin to expire towards the end of the year, these numbers may start to rise. Recently, however FHA extended its forbearance programs in some circumstances, in part because of concerns about servicer capacity once these programs expire.[3] The first option following purchase is foreclosure. So far, this category has not been much utilized as high house prices create incentives to stay in homes, and policy is very much focused on supporting that outcome. It should be noted that the Federal Reserve Bank of Chicago estimated that the total number of foreclosures in the 2007-2010 period was 3.8 million[4]. The second outcome is a partial claim. These loans may be re-pooled after a consecutive six-month period of performance. The third option is a modification. Recent updates by HUD to the recovery “waterfall” create strong incentives for borrowers to select this option[5]. To get a handle on how the landscape is beginning to change, we can look at a breakdown of new issuance by loan purpose for the two major GNM programs. There are many distinctions here, but for our purposes, the main point is the growing gap in the share of RG and mod pools between the two programs. For FHA, the RG pool share peaked at 7.3% in July and has settled down near 5% the last few months, while for VA, the share has been de minimis with no single month share reaching as high as 0.15%. For mods, the FHA share has steadily risen from 5% to 13% during the course of 2021, while it has been in a steady range between 4% and 5% the past eight months for VA. Finally, the shares of pool issuance matter insofar as the different categories perform in a distinct manner. Below find the 30-day DQ rates by category for each program. The key takeaway here is that mods tend to perform worse than other loan types and that, at least for FHA loans, the RG pools perform better. The outlook here though is particularly uncertain as these new waterfall choices are untested, and their performance in different economic and market environments is yet to be determined. In this situation, access to digital tools using loan-level data will be essential to navigating murky waters. [1] https://capitalmarkets.fanniemae.com/mortgage-backed-securities/single-family-mbs/fannie-mae-extends-timeframe-single-family-mbs-delinquent-loan-buyout-policy
[2] https://www.recursionco.com/blog/fha-buyouts-and-loan-counts [3] https://www.hud.gov/press/press_releases_media_advisories/HUD_No_21_160 [4] https://www.chicagofed.org/publications/chicago-fed-letter/2016/370 [5] https://www.hud.gov/press/press_releases_media_advisories/HUD_No_21_115 |
Archives
July 2024
Tags
All
|
RECURSION |
|
Copyright © 2022 Recursion, Co. All rights reserved.

 RSS Feed
