|
In a recent post[1], we looked at the share of the use of the cash window for bank and nonbank sellers. We found a reversal in the long-term upward trend in this share this year, correlated with the imposition of FHFA imposed lender-level caps on the use of the cash window. We next turn to performance. We look below at prepayment speeds for the 2018, 2019 and 2020 cohorts broken down by bank and nonbank sellers. 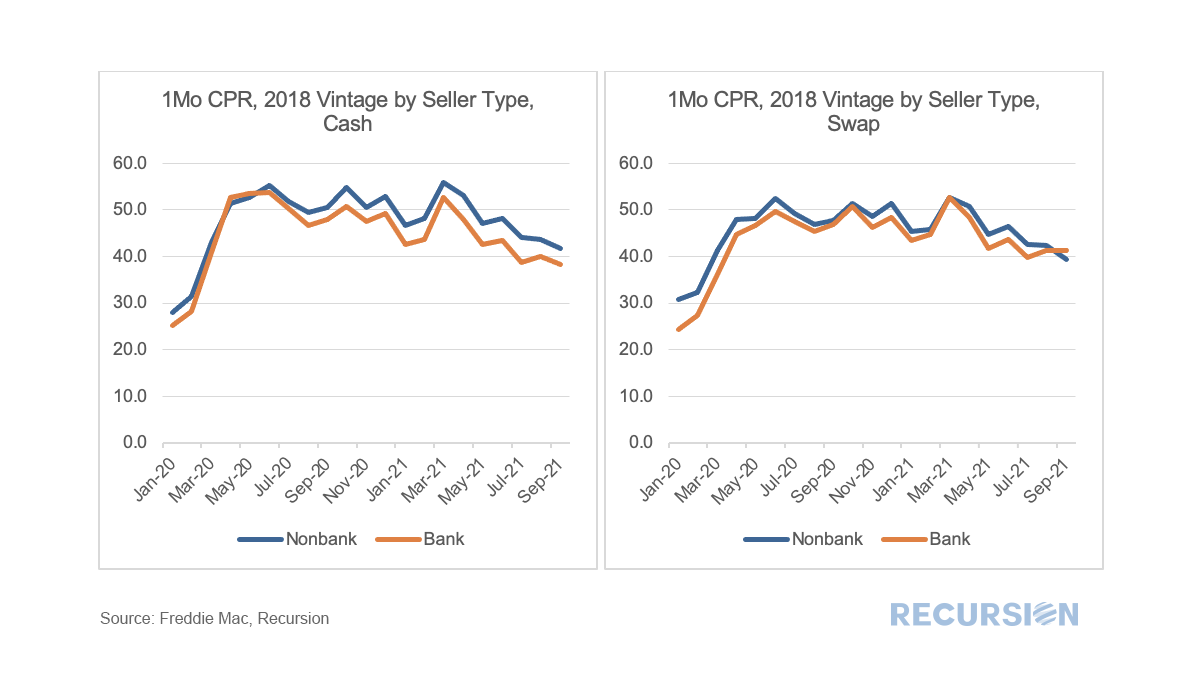 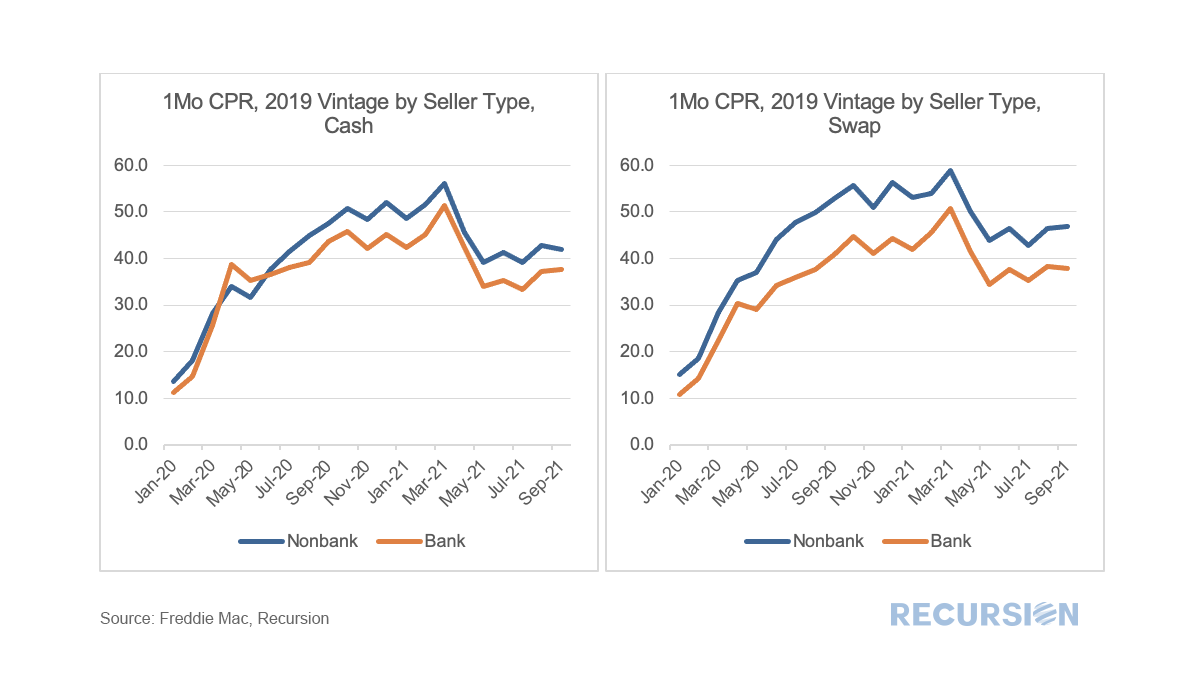 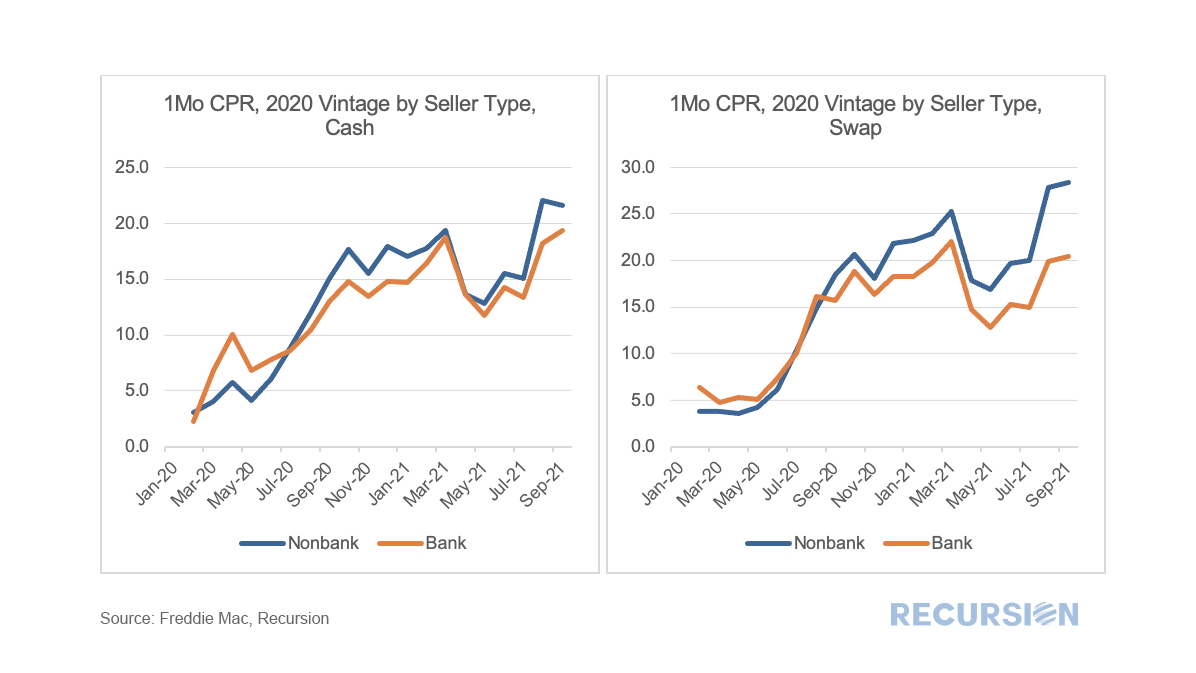 There are many interesting observations that can be drawn from these charts, but we focus now on the swap-cash gaps for nonbanks and banks between prepayment speeds for the 2019 and 2020 vintages. 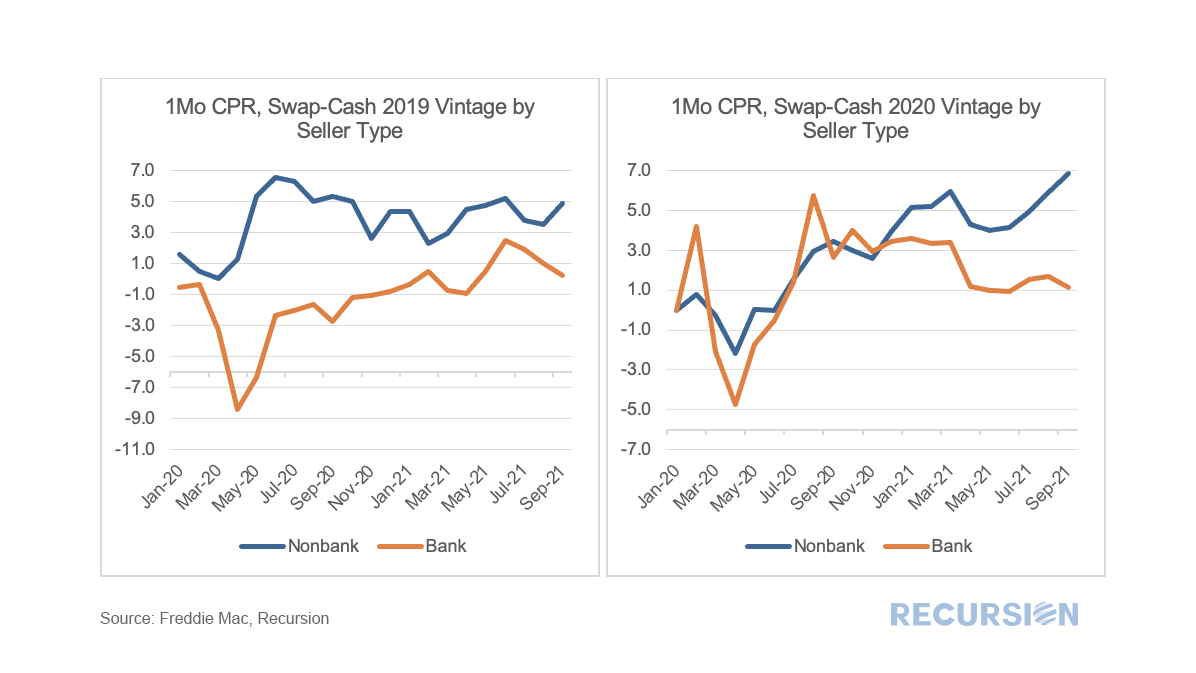 What comes across here is the possibility of using the breakdown between cash and swap transactions as a basis for a natural experiment relating prepayment speeds, lender types and other factors. In this instance, we look at a common determinant of CPR, namely loan size. 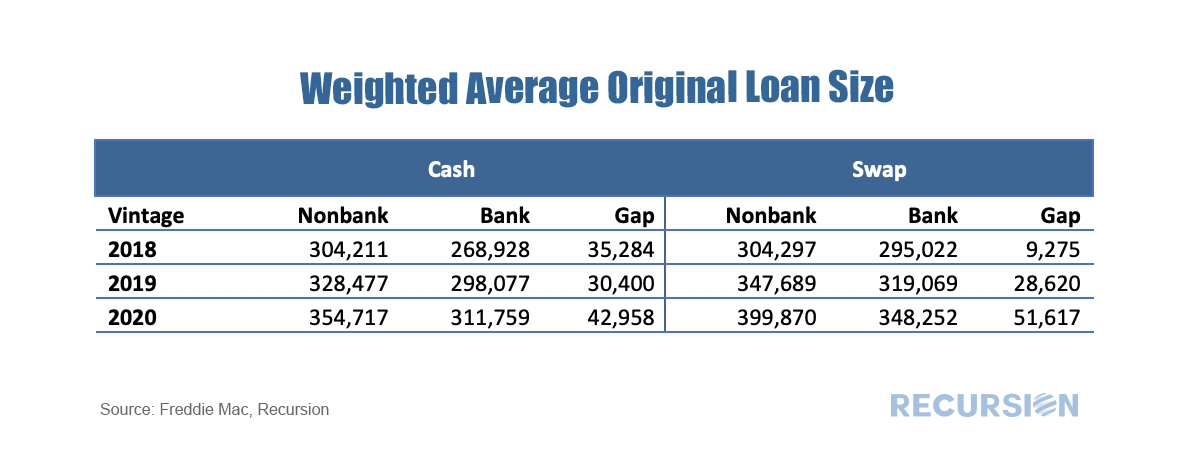 The main takeaway here is that the increase we observe in the prepayment speed of nonbanks vs banks for the 2020 vintage correlates with the increase in nonbank loan sizes relative to those of banks that year. Of course, many other factors come into play regarding the results we report here, but this note serves as a baseline for further analysis. |
Archives
July 2024
Tags
All
|
 RSS Feed
RECURSION |

Copyright © 2022 Recursion, Co. All rights reserved.