|
In a fine recent paper, the Federal Reserve Bank of Philadelphia “highlights the immediacy of the challenges facing mortgage servicers and policymakers” that arise from the resolution of mortgage forbearance and delinquencies[1]. As of the time of writing, the Philly Fed stated that “some 2.73 million mortgages are either in forbearance or past due; about 0.78 million of those are in Coronavirus Aid, Relief, and Economic Security (CARES) Act forbearance plans”. In addition, “about 47 percent of loans in forbearance will expire in the first quarter of 2022; another 42 percent will expire in the second quarter”. They go on to discuss recent trends and provide data on income and demographics of these borrowers.
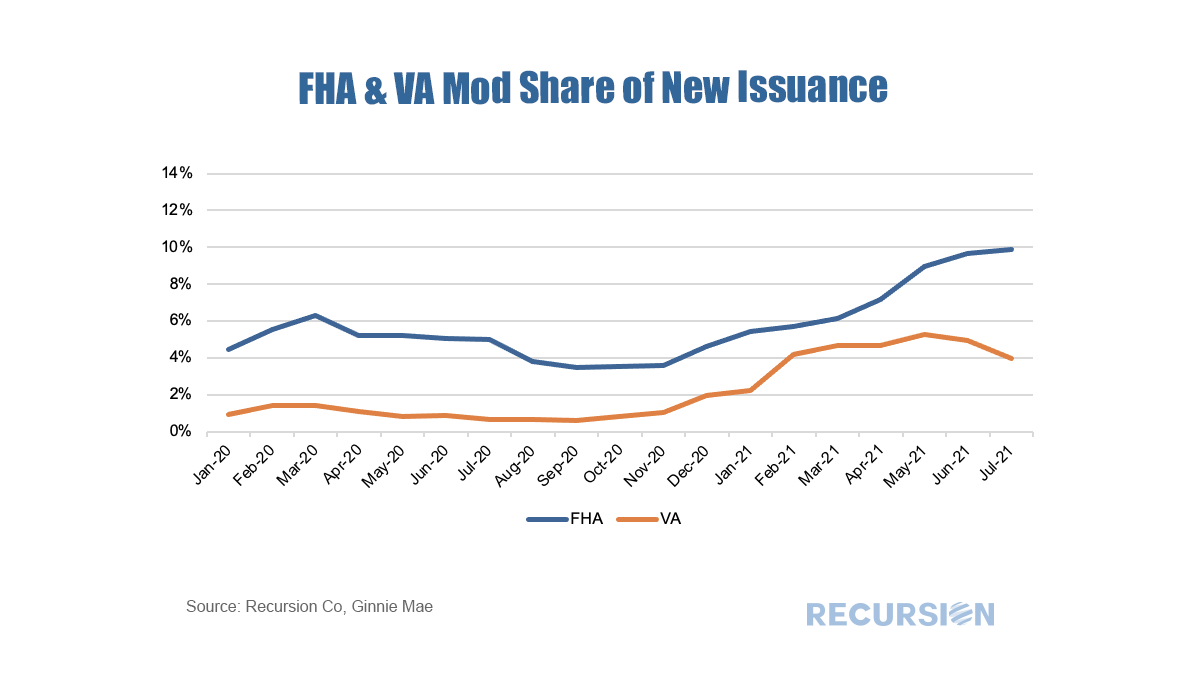
The point of this brief article is to look at secondary market indicators to shed additional light on these issues. The note is broken into two parts, the first looks at Government programs, notably FHA and VA, while the second looks at the GSEs. On June 25, 2021, Ginnie Mae announced the creation of a new pool type C-ET that consists of modified loans with original terms greater than 361 months and less than or equal to 480 months[1]. The Custom pool design implies that each pool is created by a single issuer. Other custom pools are limited to 360-month maturities, so this structure is designed to enhance liquidity for these borrowers. 7 such pools were issued in December 2021, and 1 in January 2022 so far. The 8 pools have only 13 loans, from 3 issuers. 8 out the 13 loans are Rural loans, 5 are VA. 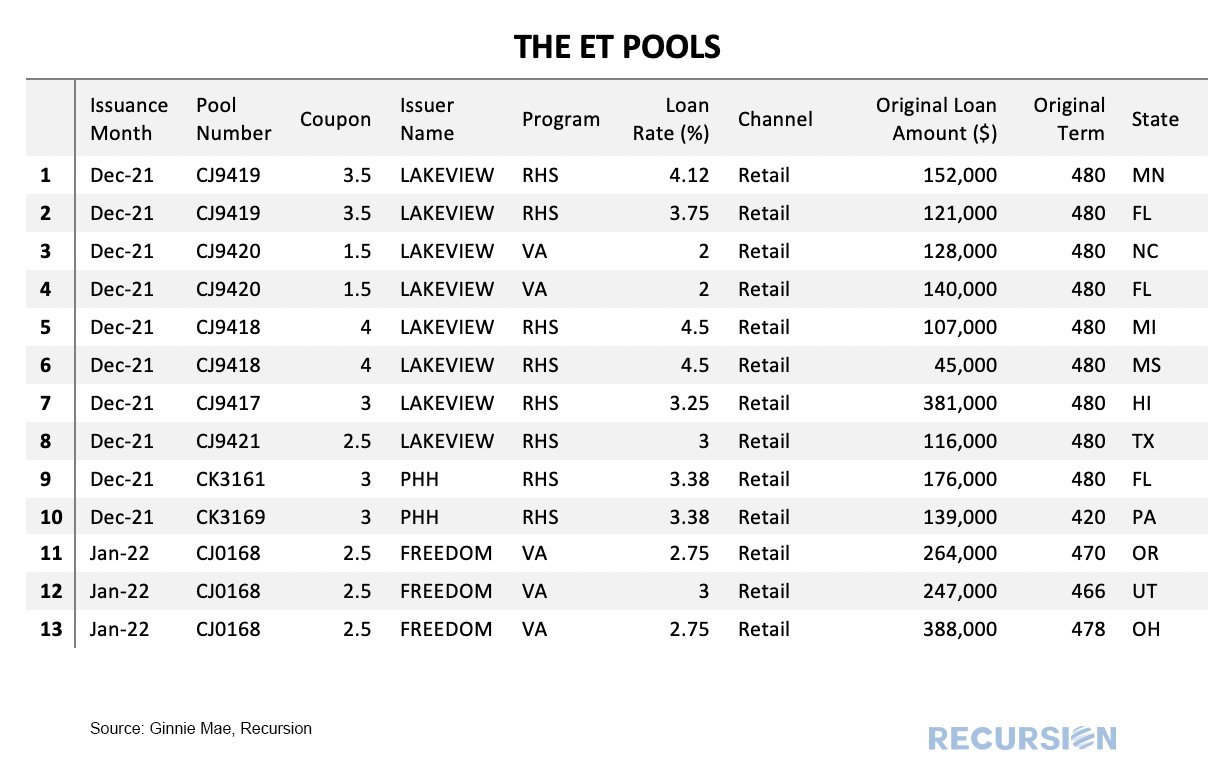 Once again, Ginnie Mae has provided the market with new investment opportunities, and analysts with the opportunity to learn about how markets behave under long-term timeframes. Over the past six months, prepayment speeds of Ginnie Mae securities have notably widened against those of the GSEs. 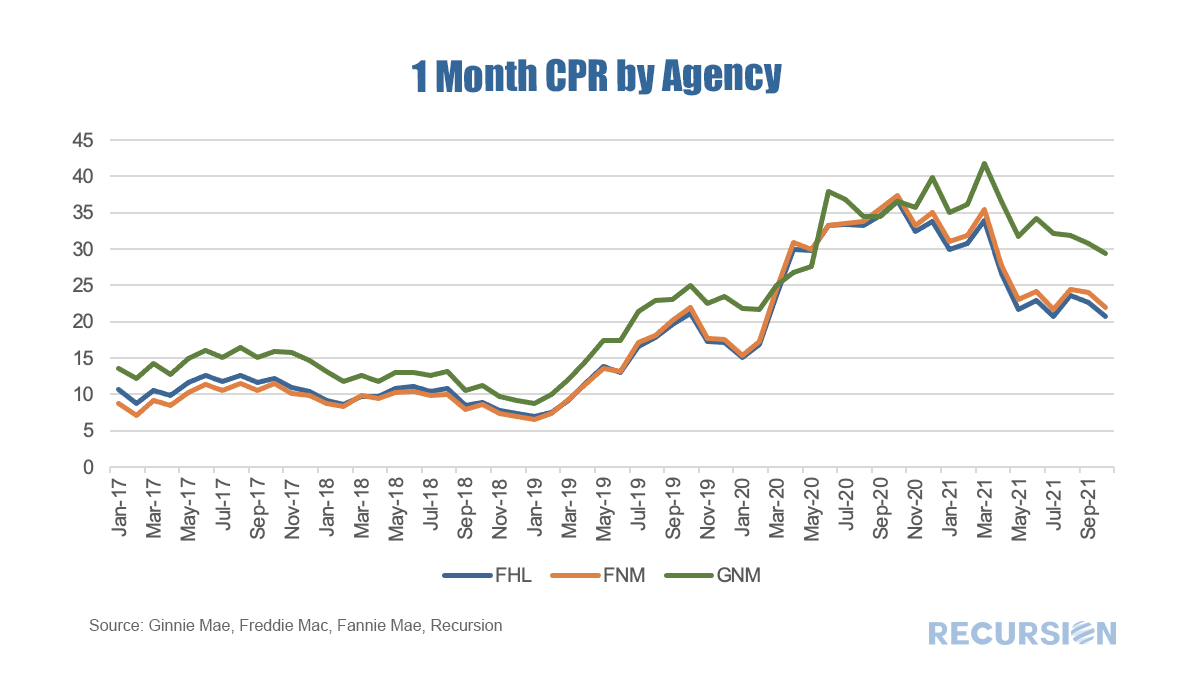 As we approach year-end and the beginning of the process of phasing out forbearance programs, the natural question market participants are asking is which indicators should they be watching to gain a sense of the mortgage landscape in 2022. Along these lines, there is a significant difference between the Ginnie Mae programs and the GSE’s. In particular, for conforming loans, it is the Agencies themselves that buy nonperforming loans out of pools, while for FHA and VA, this function is performed by servicers. As the timeframe for buyouts on the part of the GSE’s was extended to 24 months earlier this year, we won’t see much activity prior to April 2022 on this front[1]. So in this post, we focus on the Ginnie Mae programs. As we have written previously, it is challenging to follow the path of a loan once it has been purchased out of a pool. At the aggregate level, we can view the activity of individual lenders using the FHA Neighborhood Watch data[2]. In terms of the process, a nonperforming loan is bought out of a pool, and one of three actions can be taken. First, the borrower can be taken into foreclosure. Second, the borrower can become current and roll the unpaid balance into a second lien, in a process known as a partial claim. Third, the borrower can accept a loan modification. In terms of the scale of buyouts, after an early spurt of activity in 2020 on the part of some parties, notably banks, the involuntary prepayment rate, measured by CDR(constant default rate), has settled down in recent months. FHA nonbank servicers have been more active in this space than other categories over the past year. As forbearance plans begin to expire towards the end of the year, these numbers may start to rise. 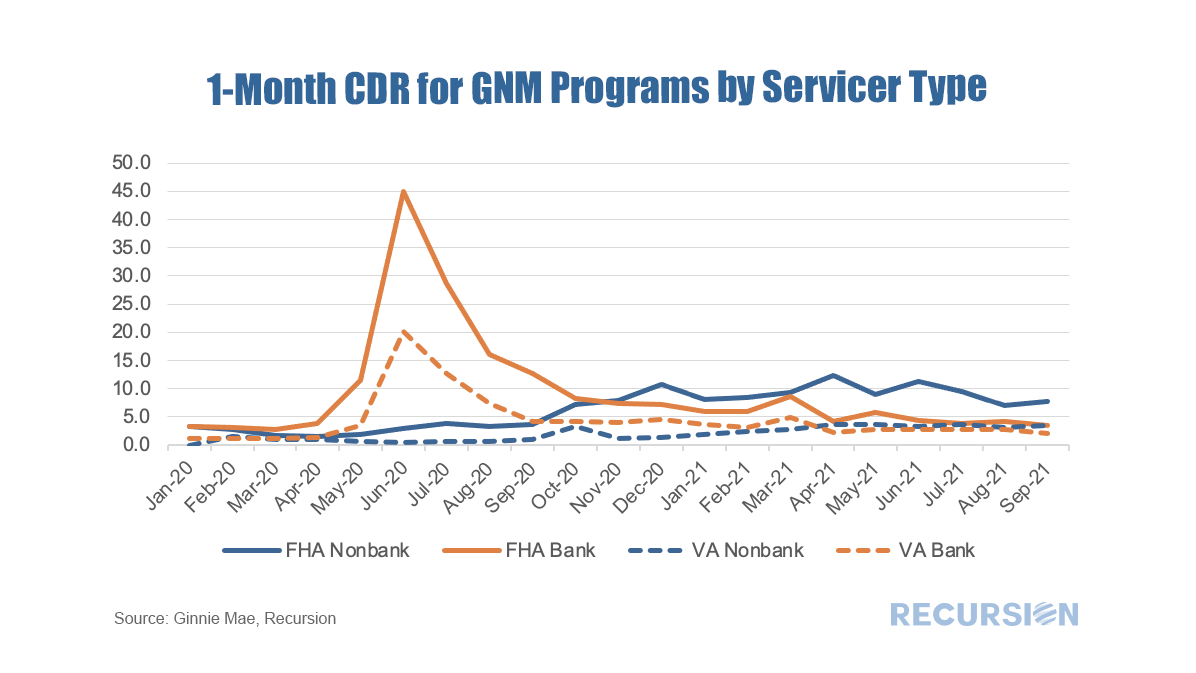 One of the many recurring themes of these posts is that the shock of the Covid-19 Pandemic and subsequent policy response has resulted in structural changes in behavior that cause loan performance metrics to shift compared to the pre-crisis world. An interesting example of this can be found in the performance of modified loans in Ginnie Mae programs. Modified loans in these programs are those that have been purchased out of pools by servicers that are past due that subsequently have features such as rate and term adjusted in order to bring households back to a current status. These are then often resecuritized into a new GNM pool.
 Credit provision is one of the great areas of concern addressed by the New Housing Policy. In a previous post[1], we mentioned that we have integrated HUD LMI Neighborhood information with our tools. We can view aggregate credit creation through Cohort Analyzer, and its composition through HMDA Analyzer. 2020 marked an unprecedented year for mortgage production as the pandemic sparked aggressive moves by the Federal Reserve driving mortgage rates to record lows, coupled with a flight of households away from density towards more sparsely populated areas. Trends in the major programs by loan count can be seen here: 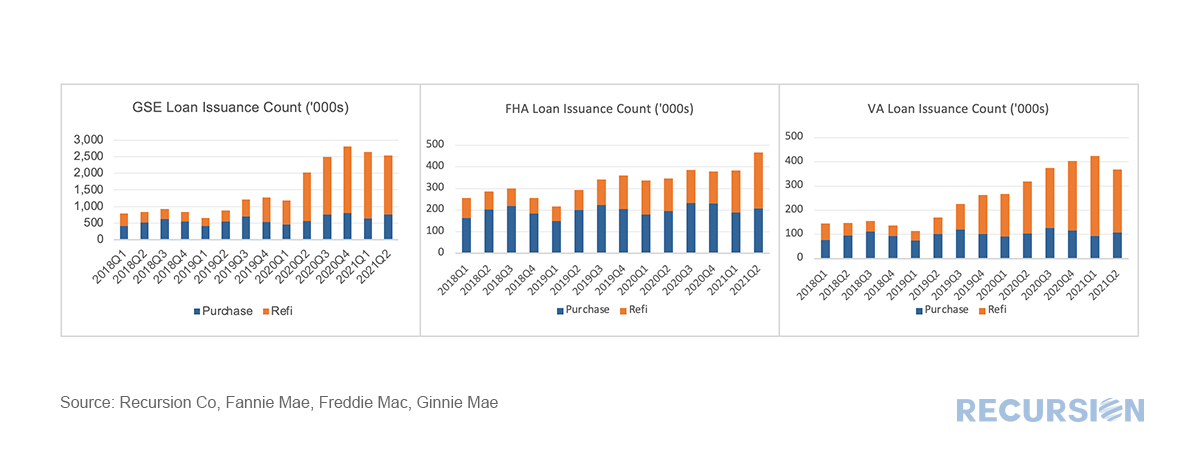 *This chart can be duplicated using the above two queries
In a recent Liberty Street Economics blog post, researchers at the New York Federal Reserve discussed the background and landscape of mortgages qualifying for Covid forbearance under the CARES Act[1]. 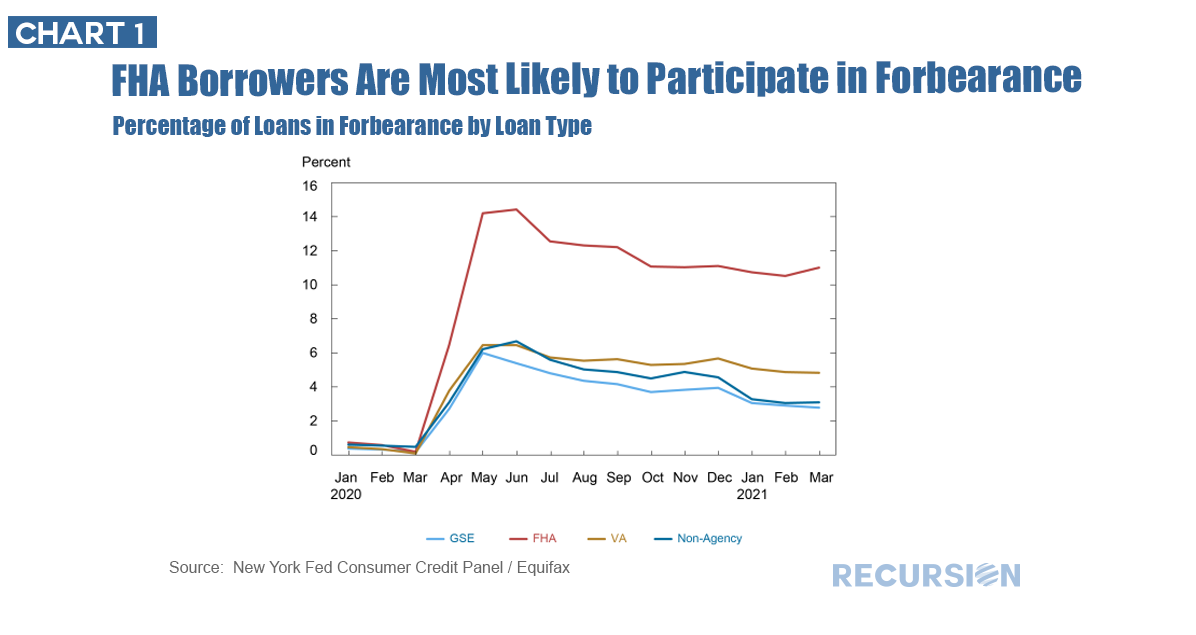 In a recent post, we commented on the drop in the number of loans in forbearance in Ginnie Mae pools[1]. Because of the different capital strictures, it’s interesting to look at the breakdown between banks and nonbanks. 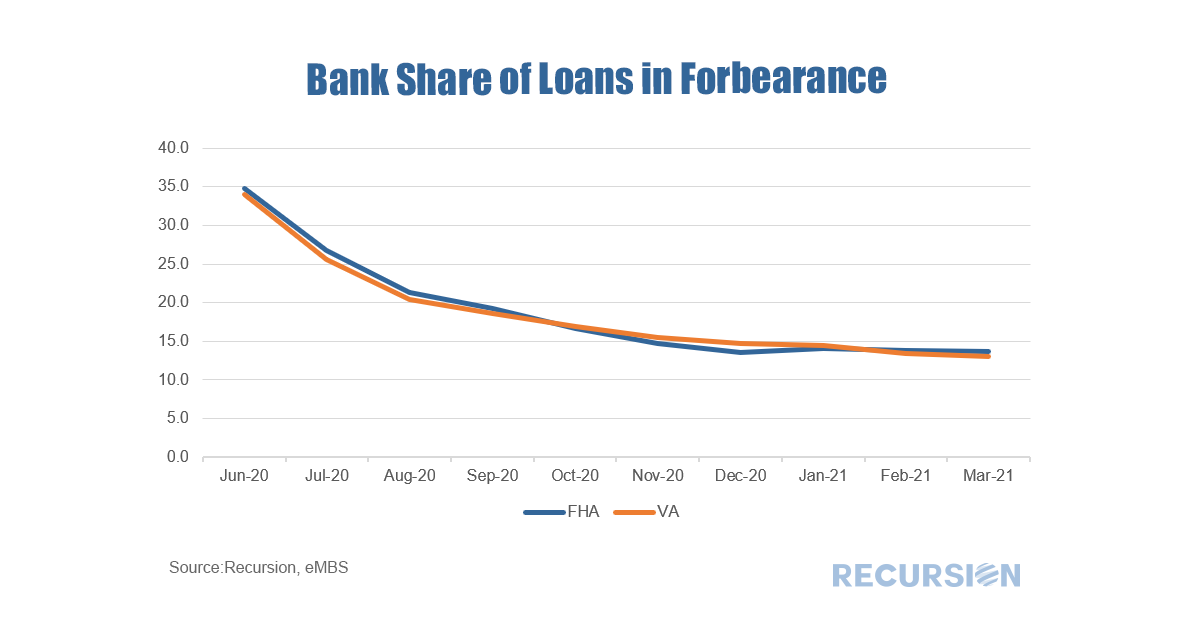 |
Archives
February 2024
Tags
All
|
 RSS Feed
RECURSION |
|

Copyright © 2022 Recursion, Co. All rights reserved.