• HOME
  • solutions
    • RECURSION ANALYZERS
    • Mortgage Company Data
    • Recursion DataCloud
    • Customized Solutions
  • BLOG
  • CLIENT LOGIN
    • Recursion Analyzers
  • ABOUT US
    • OVERVIEW
    • OUR TEAM
    • News & Events >
      • Recursion In News
      • Recursion Data Citations
  • CONTACT
RECURSION CO
  • HOME
  • solutions
    • RECURSION ANALYZERS
    • Mortgage Company Data
    • Recursion DataCloud
    • Customized Solutions
  • BLOG
  • CLIENT LOGIN
    • Recursion Analyzers
  • ABOUT US
    • OVERVIEW
    • OUR TEAM
    • News & Events >
      • Recursion In News
      • Recursion Data Citations
  • CONTACT
BLOG

A Quick Note on the GNM – GSE Early Delinquency Gap

8/11/2022

 
There has been a modest but persistent widening of the gap in 1-month DQ rates between the Ginnie Mae programs and the GSEs over the past couple of years. Previously, our experience was that these are mostly driven by developments in the labor market[1]. In fact, there has been a recent small but persistent rise in the number of initial jobless claims that correlates with this widening:
Picture
run underlying query
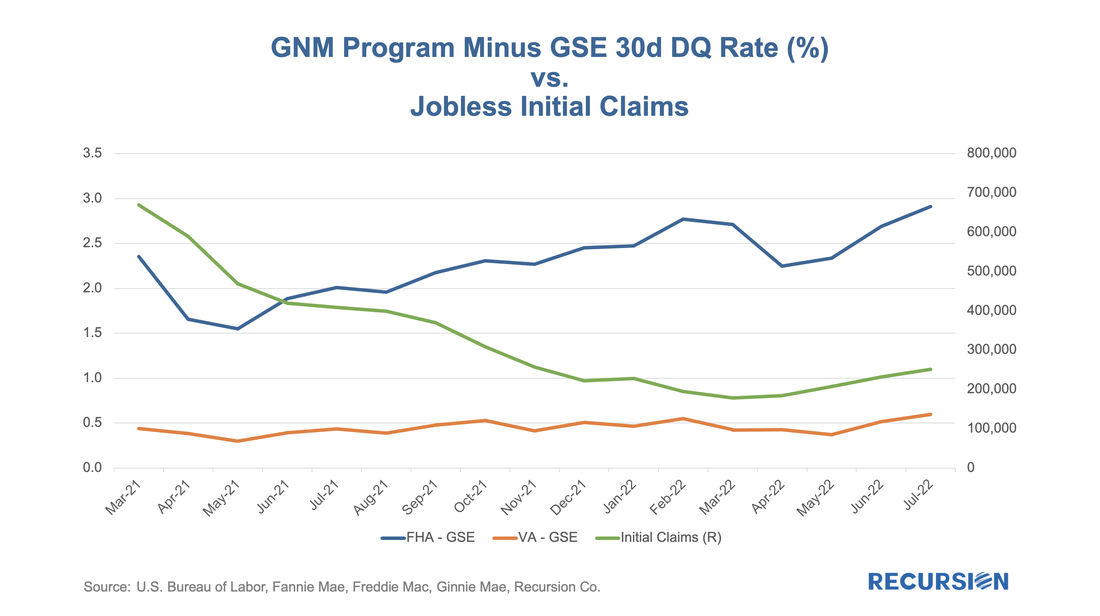
The theory worked until about one year ago,  but the widening in the DQ spread has preceded the rising trend in claims.

An alternative explanation comes from a different part of the macro scene: inflation. In a report earlier this year, Shernette McLeod at TD bank looked at the impact of higher inflation on different income categories[2]. While the direct impact is felt most heavily on middle-income households, lower-income families have very limited ability to adjust to this shock, particularly as their savings tend to be low and their budgets are already stretched. As a result, the overall impact of higher inflation can be severe for this group. According to the 2021 HMDA data, the median income of FHA borrowers is $65k per year compared to $85k for VA and $105k for conventional borrowers.

Consequently, when we looked at the spreads vs. the inflation rate, the correlation is striking:
Picture
run underlying query
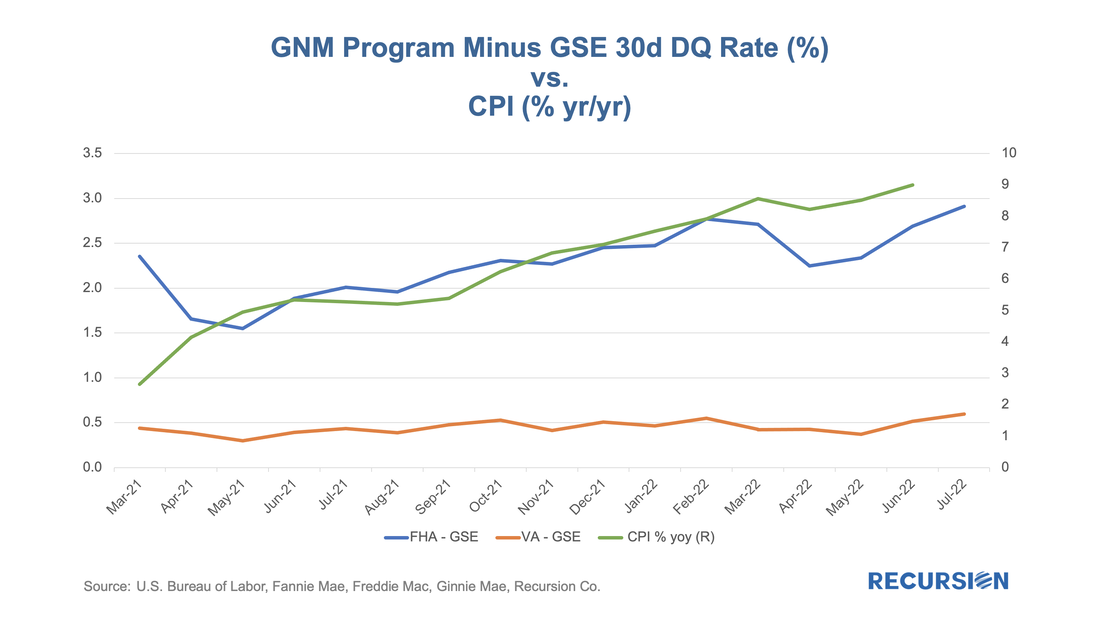
So far, the overall impact is relatively small, with the 30-day DQ rate as of August 1 for FHA at 3.76% vs. 0.59% for the GSEs, but the trend is clear.
​
Even with only 18 months of observations, the graph is in line with the conclusions drawn in the TD paper. The balance between growth and inflation facing the Fed is very complex and rife with possibilities of unintended consequences.

[1] Unemployment and the Coming Wave of Delinquencies - RECURSION CO
[2] A Look at Inflation’s Impact by Income and Age in the U.S. (td.com)
​​Recursion is a preeminent provider of data and analytics in the mortgage industry.
Please contact us if you have any questions about the underlying data referenced in this article.

    Archives

    July 2023
    June 2023
    May 2023
    April 2023
    March 2023
    February 2023
    January 2023
    December 2022
    November 2022
    October 2022
    September 2022
    August 2022
    July 2022
    June 2022
    May 2022
    April 2022
    March 2022
    February 2022
    January 2022
    December 2021
    November 2021
    October 2021
    September 2021
    August 2021
    July 2021
    June 2021
    May 2021
    April 2021
    March 2021
    February 2021
    January 2021
    December 2020
    November 2020
    October 2020
    September 2020
    August 2020
    July 2020
    June 2020
    May 2020
    April 2020
    March 2020
    February 2020
    May 2019
    March 2019
    February 2019

    Tags

    All
    Affordability
    ARM
    Bank\Nonbank
    Borrower Assistant Plan
    Cash Window
    Climate Change
    CMBS
    CMO
    Conforming Loan
    Conventional Loan
    COVID 19
    CPR\CDR\CRR\CCR
    Credit Score\DTI\LTV
    CRT\CAS\STACR
    Delinquency
    Early Buyout
    Early Payment Default
    ESG
    ET Pools
    Fannie Mae
    Fed
    FHA
    FHFA
    Forbearance
    Foreclosure
    Foreign Investor
    Freddie Mac
    Freddie Mae
    Ginnie Mae
    Green Loans
    HECM
    HELOC
    HMDA
    HUD
    LMI
    Manufactured Housing
    Modified Loans
    MSR
    Multifamily
    Occupancy Type\NOO
    Partial Claim
    Payoff
    PIW
    Prepayment
    PUD
    Purchase Loans
    Recursion In News
    Refi Loans
    Reperforming
    RG Pools
    Rural Housing
    Single Family
    Special Eligibility Program
    TBA Market
    TIC
    TPO
    UMBS
    US Treasury
    VA

    RSS Feed

RECURSION

SOLUTIONS ​
Recursion Analyzers
​
Mortgage Company Data
Recursion DataCloud
Customized Solutions


ABOUT US  ​
Overview
​Our team
CLIENT LOGIN   ​
Recursion Analyzers

CONTACT

224 West 30th St., Suite 303, New York, NY 10001
Contact Us

Picture
Copyright © 2022 Recursion, Co. All rights reserved.​
  • HOME
  • solutions
    • RECURSION ANALYZERS
    • Mortgage Company Data
    • Recursion DataCloud
    • Customized Solutions
  • BLOG
  • CLIENT LOGIN
    • Recursion Analyzers
  • ABOUT US
    • OVERVIEW
    • OUR TEAM
    • News & Events >
      • Recursion In News
      • Recursion Data Citations
  • CONTACT