|
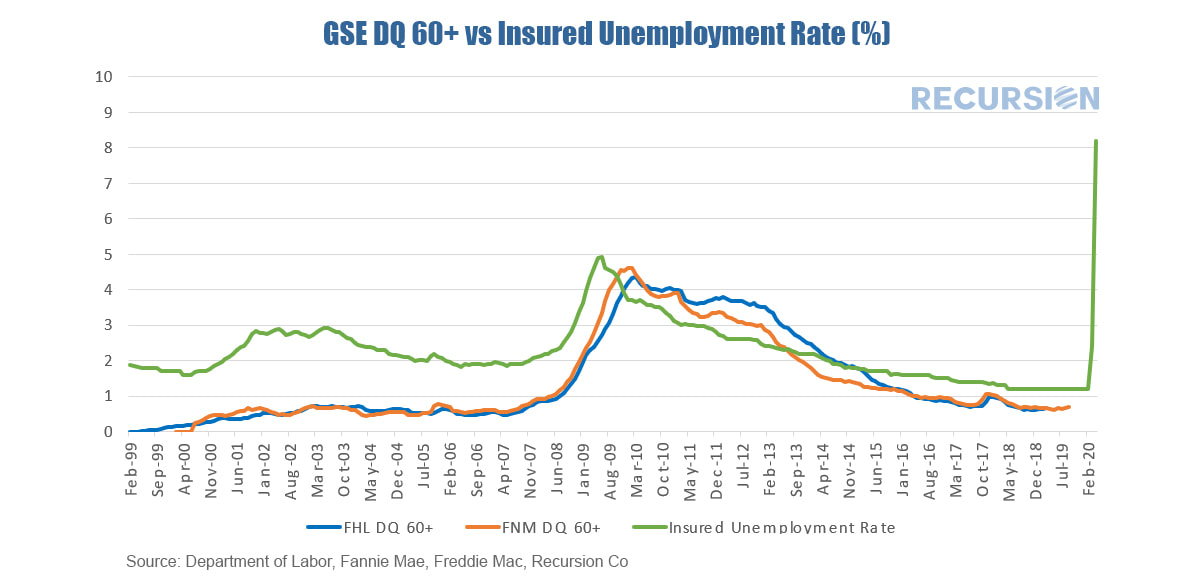
The Covid-19 Virus has clearly had a devastating impact on the jobs market in the US. Over the past four weeks, over 22 million people have filed for unemployment claims. This number has grabbed the headlines, but to get a more accurate sense of perspective on the problem it is best to look not at new claims, but instead at the stock of people who are receiving benefits, and then scale this by the size of the labor force. This concept is referred to as the “insured unemployment rate”[1], which was first reported in 1971. This figure reached an all-time high of 8.2% in the week ending April 4, greater than the peak during the global financial crisis of about 5% and the all-time peak near 7% in the mid-1970’s. For the mortgage market, the primary implication is for delinquencies. The two GSE’s Fannie Mae and Freddie Mac, have released a sample of their single family mortgage books of business back to 1999 in support of the Credit Risk Transfer Program (CRT), with enough information for us to calculate delinquency rates since that time. There is a striking correlation between 60+ day delinquencies and the insured unemployment rate: While it is unclear to what degree the correlation will persist in coming months, there is no doubt that the impending wave of delinquencies will post severe challenges for investors and policymakers. Access to enormous big data sets and digital tools will be essential for all market participants to navigate the challenging environment in the weeks and months ahead. [1] The “insured unemployment rate” differs from the more often-cited household survey unemployment rate insofar as the former includes
only people who are receiving benefits in the numerator of the calculation, while the latter also includes unemployed people not receiving benefits. |
Archives
July 2024
Tags
All
|
RECURSION |
|
Copyright © 2022 Recursion, Co. All rights reserved.


 RSS Feed
