|
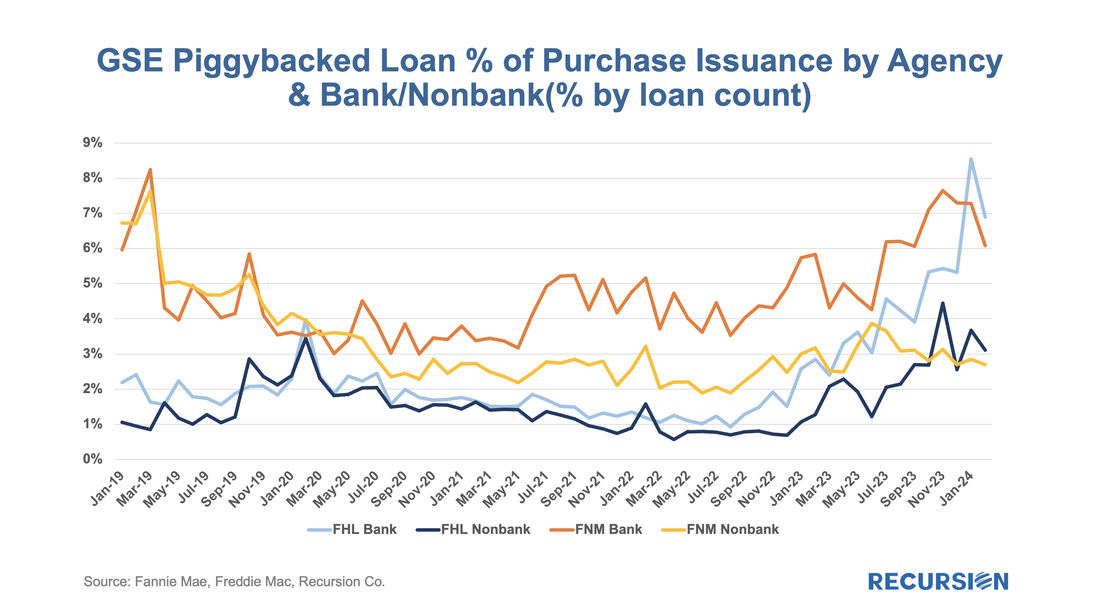
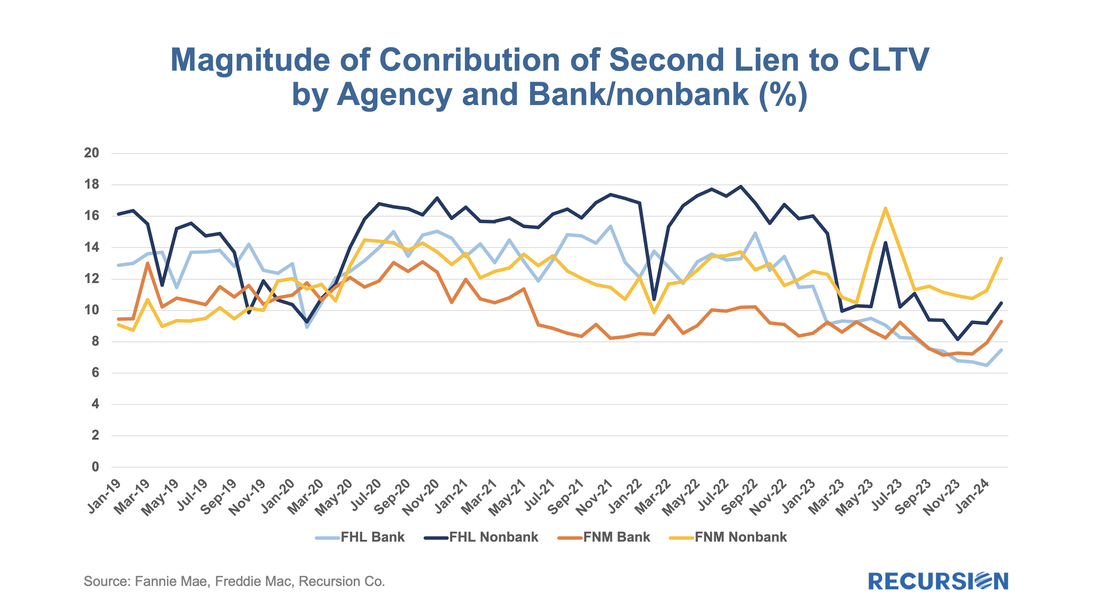
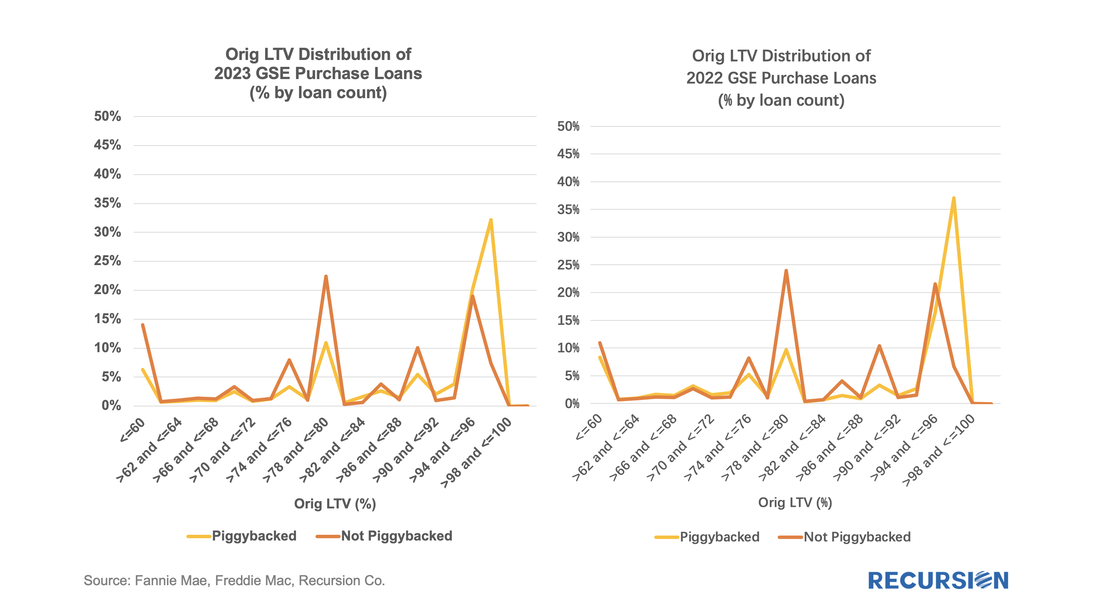
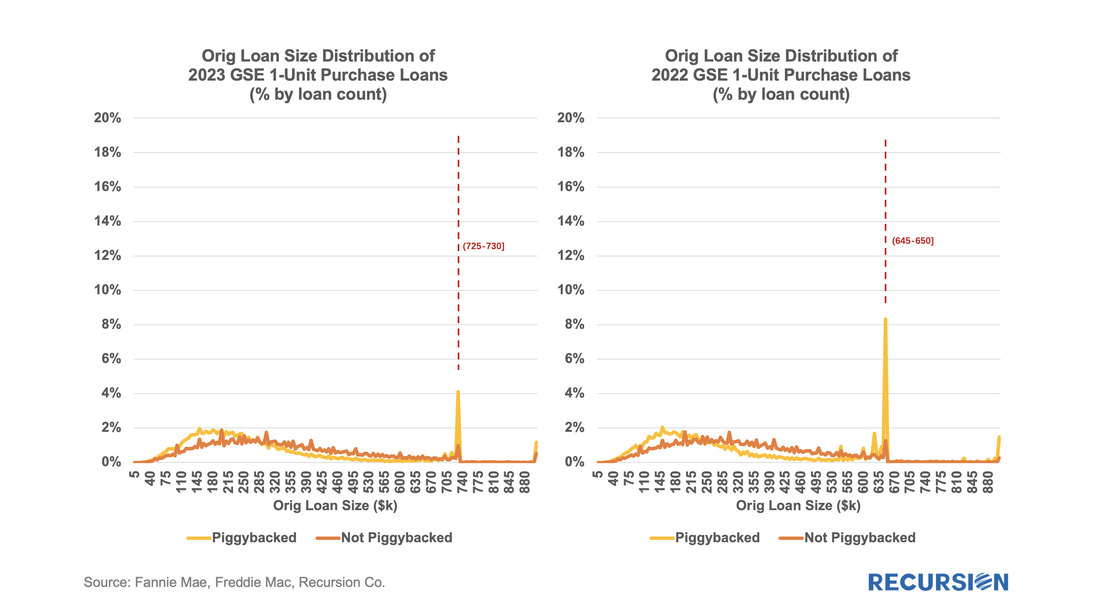
A little while ago, we wrote about DPAs and noted that there are distinct differences in how these are reported between the GSEs and FHA[1]. Subsequently, we looked into the issuers of these FHA DPA loans and noted that DPA usage has been broadening to include a growing set of lenders in recent years[2]. We now turn to the GSEs. We noted in our earlier reports that while there is no DPA flag for the Enterprises, we can derive some information about their use from the fact that DPAs are only allowed through their specified second lien programs. This leads us naturally to broaden our investigation to consider those cases where new loans are delivered in tandem: a first or primary mortgage along with a second lien or “piggyback” mortgage. The Enterprises refer to these as “secondary” mortgages. The question of course is do we have the information necessary to assess the scope and performance of loans with accompanying seconds? Given that the GSEs disclose the CLTV as well as the OLTV of a loan, if the former is higher than the latter, we can consider it as a piggybacked loan. Grist for the Recursion mill. To start, we limit ourselves to purchase loans, and we look at the share of deliveries with accompanying second liens by agency: Prior to Covid, Fannie Mae’s activity in this area was considerably greater than that of Freddie Mac. Subsequently, the previous pattern re-emerged, but once interest rates began to rise in the second half of 2022, the piggybacked share rose across all market groups. In recent months, the share of bank loans delivered to Fannie Mae with this feature fell behind that of Freddie Mac for the first time. For both GSEs, the share of bank loans using piggybanks has risen sharply relative to nonbanks. Next, we look at the size of the contribution of the second lien to the CLTV: It’s interesting to note that the average contribution of second liens to the CLTV of piggybacked loans over 2021-2022 was smaller for bank deliveries to Fannie Mae than for Freddie Mac. More usage but less impact per loan. Over the mid-2022 to end-2023 period, the average contribution across groupings shows a trend decline. Recently, however, the magnitudes are showing broad signs of recovery. Are there notable regularities in the distribution of usage of piggybacked purchase loans by loan characteristic? There are reasons to think so. First, let’s look at the Original LTV: There is a persistent spike in activity near 80 and 100 LTV. In the case of 80 LTV, it is reasonable to think that second liens can be used to avoid mortgage insurance. About 10% of deliveries for piggybacked loans occur in the LTV bucket between 78 and 80. A much bigger jump can be seen, however, at just below 100 LTV. The motivator here is likely to have a first lien that falls below the conforming loan limit. Over 30% of all piggybacked loans are in the 98-100 LTV bucket. To confirm this, we can look at the distribution of deliveries by loan size: There is a clear jump at the conforming loan limit and a smaller one at the jumbo limit. It’s interesting to note that the share of piggybacked loans near the limit halved from about 8% in 2022 to 4% last year. These charts set us up to dig further into important questions about the performance of piggybacked loans compared to others. This naturally takes us into a discussion of the concentration of this activity across lenders. More to come. |
Archives
July 2024
Tags
All
|
RECURSION |
|
Copyright © 2022 Recursion, Co. All rights reserved.


 RSS Feed
