|
With the release of 2019 HMDA data, we now have two years of loan-level information that contains both demographic and credit characteristics. Demographic information in HMDA includes income, race, and geography down to the census tract level, while credit characteristics include DTI. Our agency loan level databases contain a richer set of information regarding lending characteristics, but limited data on geography and demographics. For institutions looking to benchmark their performance in affordable and minority lending for regulatory purposes, 2019 HMDA, with data on thousands of lenders, is an invaluable tool. If you are interested in finding out more, please reach out. There are of course policy uses for this data as well. A significant difference between HMDA and the agency pool loan-level data is that HMDA contains data for loans held on book, the so-called “Unsold” category. This allows a comparison of loans that banks originate and keep and those they deliver. We can break this down in any number of ways, but let’s look at it for conforming loans broken down by DTI. 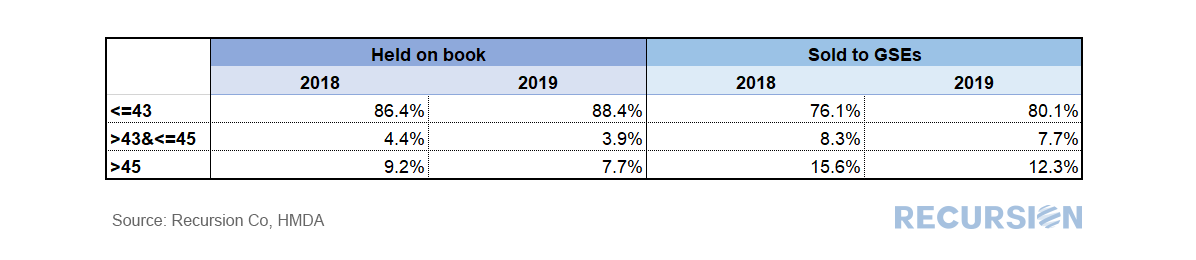 In the table above, we can readily observe that banks tend to keep higher-quality loans (as measured by DTI<=43) compared to those they deliver to the Enterprises. Of course, this is not a complete picture of this issue; there are many other ways to slice the data (credit score, LTV, loan size, geography). Moreover, as there is a correlation between low LTV and desirable loan characteristics for regulatory purposes (minority status, low income), we cannot simply conclude that it’s a matter of keeping the best for themselves. A second interesting question is: did behavior in this regard change between 2018 and 2019? Below you can find a chart of the change in the distribution between unsold and delivered loans between these two years. 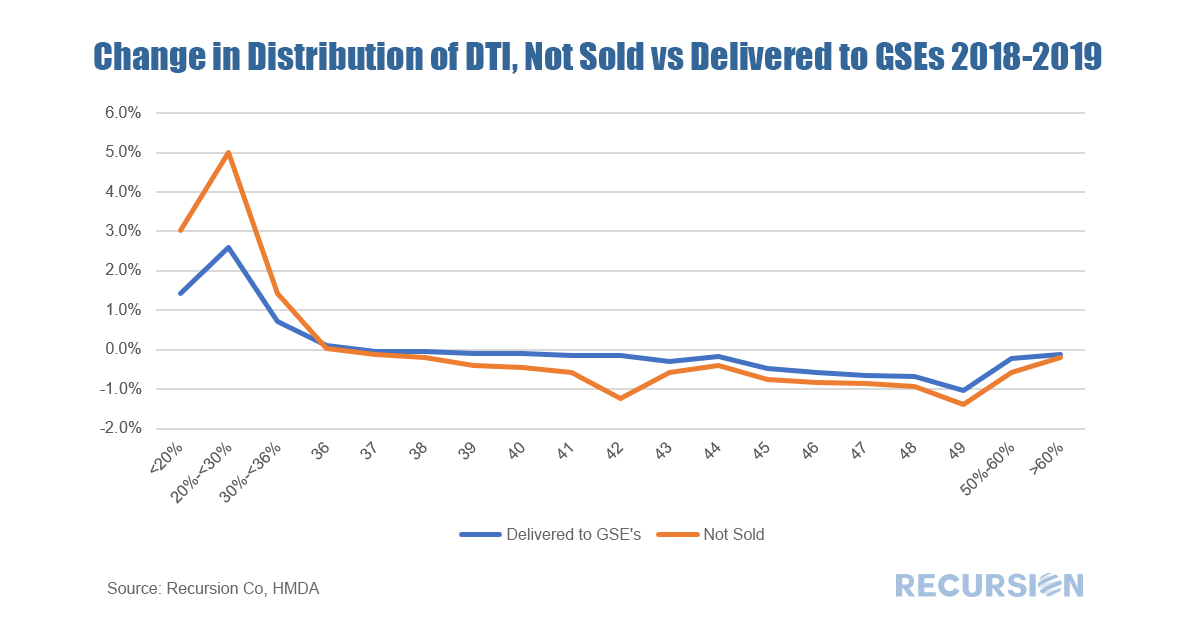 It appears that banks kept more of the loans associated with very low levels of indebtedness (DTI<35) in 2019 compared to 2018, while they distributed a small share of higher-risk loans across the spectrum of DTIs above that level.
Explanations for such behavior are the subject of future research. One of our major rules at Recursion is that we are a fintech data and analytics company and that we don’t give investment advice. So spoiler alert: the answer to the question is that anything is possible. But we noticed in the most recent weekly Freddie Mac survey that the 30-year mortgage rate edged up to 3.01% from a record-low 2.98% the prior week, the first sub-3.0% level ever recorded. Market lore says that at a certain level, rates give lenders sticker shock and mark a point below which they are reluctant to venture. In an early blog post we noted that mortgage rates were at record lows, but that Treasury yields were deeper into record-low territory, so mortgage spreads were actually quite wide[1]. Mortgage rates are set in the market reflecting offsetting pressures including: downward pressure from Federal Reserve purchases, upward pressure from record demand, and the costs of forbearance borne by servicers that they seek to recoup with higher margins on new business. Below is an update to the March chart with a new variable added: the inelegantly named OPUC: 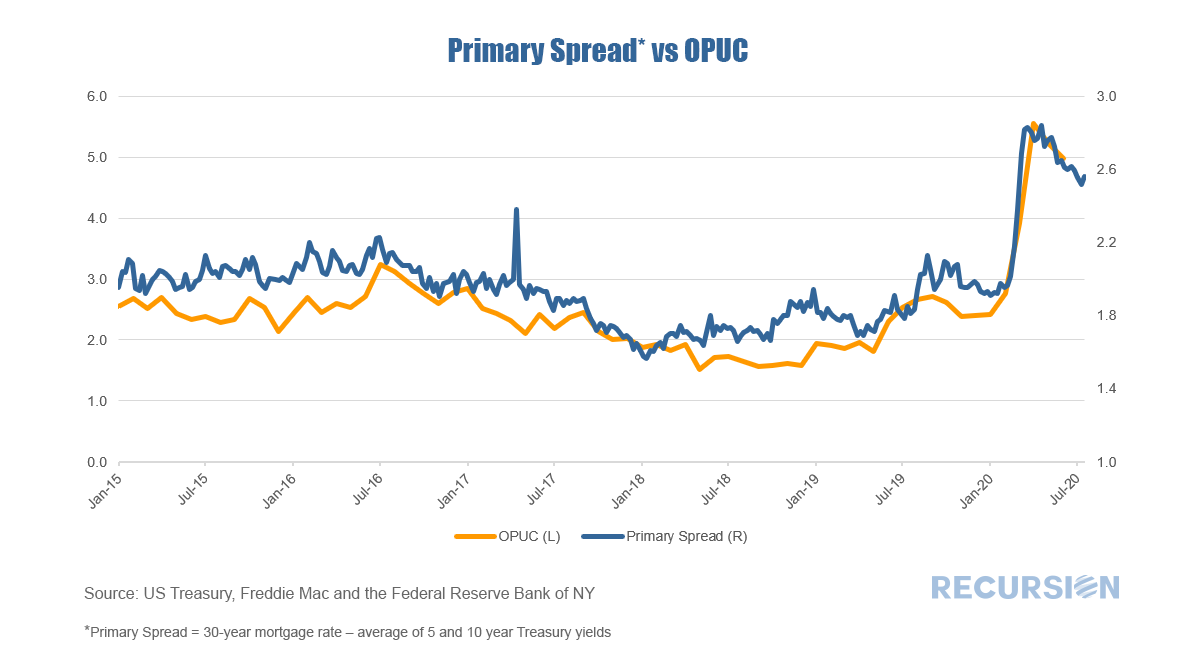 The long-raging and complex debate about housing finance policy basically boils down to two issues: first, how much risk should there be in the system, and second, who should bear it? Previous posts have addressed the use of big data in looking at the first issue by examining the trade-off between credit standards and delinquencies[1]. With regards to the distribution of risk, the topmost issue is the breakdown between the public and private sectors. This note approaches the second question by looking at the market shares of a government agency, FHA, vs that of the GSEs, which represent a mixture of public and private risk[2]. The competitiveness of one agency vs another is a multifaceted subject, as there are multiple aspects to their interaction. Among other approaches, they may compete via price (insurance fees) or via loan underwriting standards or product innovation. To launch this analysis, we just look at relative prices for purchase loans. As a proxy for price, we compare the weighted average coupon (WAC) between FHA and conforming loans in this category: 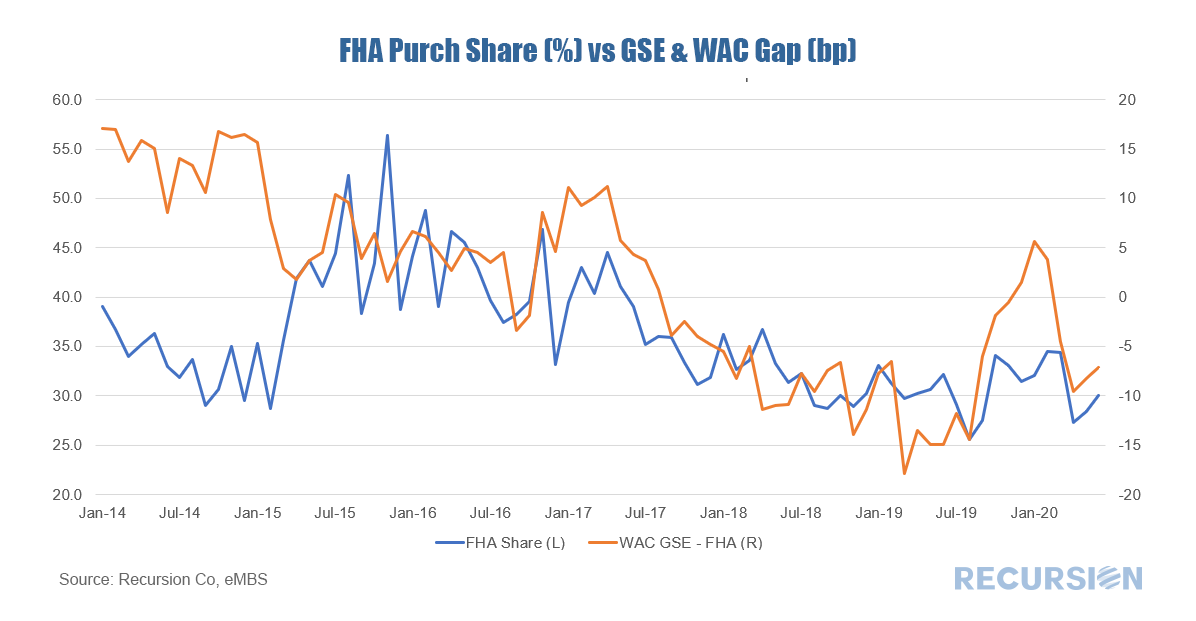 |
Archives
February 2024
Tags
All
|
 RSS Feed
RECURSION |
|

Copyright © 2022 Recursion, Co. All rights reserved.