• HOME
  • solutions
    • RECURSION ANALYZERS
    • Mortgage Company Data
    • Recursion DataCloud
    • Customized Solutions
  • BLOG
  • CLIENT LOGIN
    • Recursion Analyzers
  • ABOUT US
    • OVERVIEW
    • OUR TEAM
    • News & Events >
      • Recursion In News
      • Recursion Data Citations
  • CONTACT
RECURSION CO
  • HOME
  • solutions
    • RECURSION ANALYZERS
    • Mortgage Company Data
    • Recursion DataCloud
    • Customized Solutions
  • BLOG
  • CLIENT LOGIN
    • Recursion Analyzers
  • ABOUT US
    • OVERVIEW
    • OUR TEAM
    • News & Events >
      • Recursion In News
      • Recursion Data Citations
  • CONTACT
BLOG

Comments on Cashouts

4/8/2021

 
The increase in the number of cashout refis has led to some concerns about the implications for the quality of household balance sheets, similar to what occurred in the run-up to the Global Financial Crisis[1]. At that time, many homeowners were tempted to use their houses as a “piggy bank” as the national savings rate hit all-time lows. In the runup to the Global Financial Crisis, the national savings rate hit a sixty-year low of 2.2% while over the 2016-2019 period the rate averaged a much healthier 7.6%[2].

It is useful to scale the magnitude of assets being cashed out and Freddie Mac releases a very useful file documenting this quarterly for their book of business back to 1994[3]. In the fourth quarter of 2020, the amount cashed out reached $48.4 billion, about 58% of the $84.0 billion peak attained in the second quarter of 2006. As a share of household net worth, the most recent data point is 3.7%, well below the peak of 12.7% reached in Q2 2006.
Picture
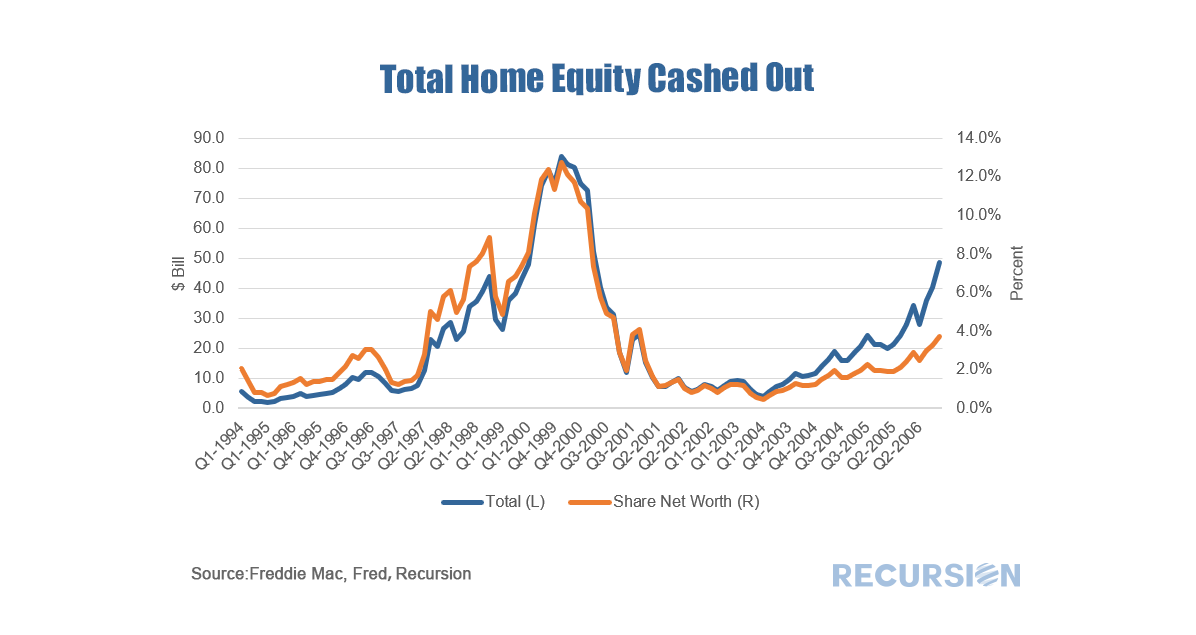
​It’s useful along these lines to ask about the credit profile of cashouts compared to other refinancings. Freddie Mac didn’t report cashout refi separately until 2008 Q3, but the following useful picture can be obtained.
Picture
Run Underlying Query
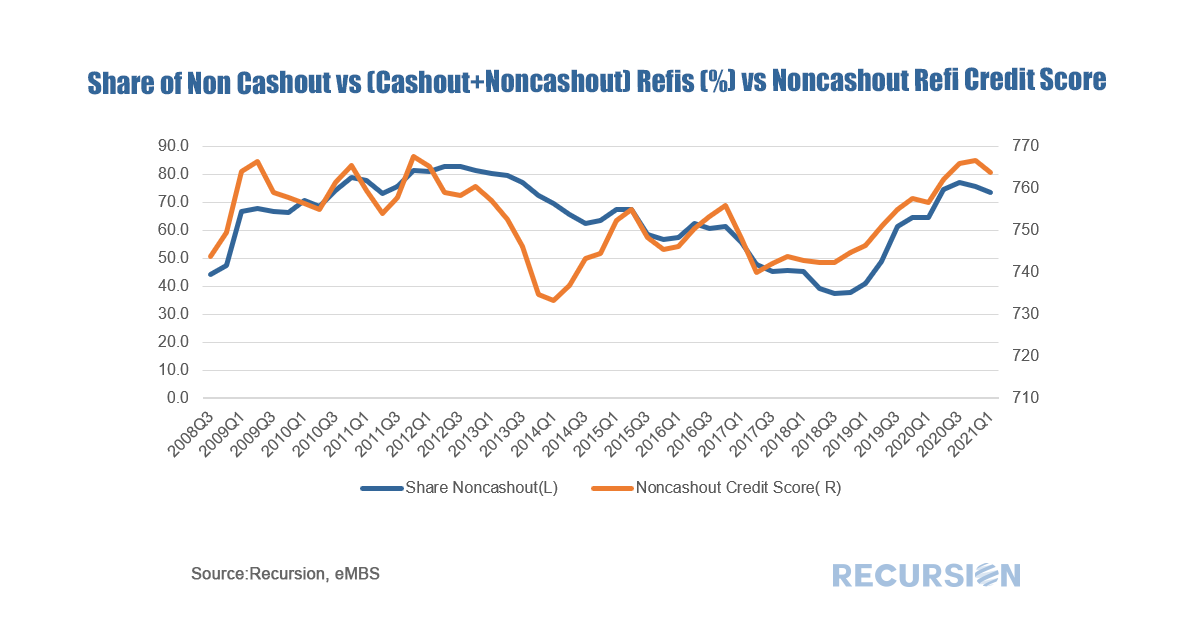
In general, lenders tend to “lean against the wind” by loosening credit conditions when demand for credit declines, and vice versa. Interestingly, it appears that the share of noncashout loans follows a pattern in which the share rises when credit in general is tightened. At the present time, the average FICO score in March for noncashouts was a tight 764, vs 753 for cashouts. It is difficult to pin the rise in equity cashouts in the current cycle to loosening credit conditions.
​
Of course, the proof is in performance, and now that we have loan-level DQs for the GSE’s beginning last month, we can look at this broken down by loan purpose for the Freddie Mac book:
Picture
Run Underlying Query
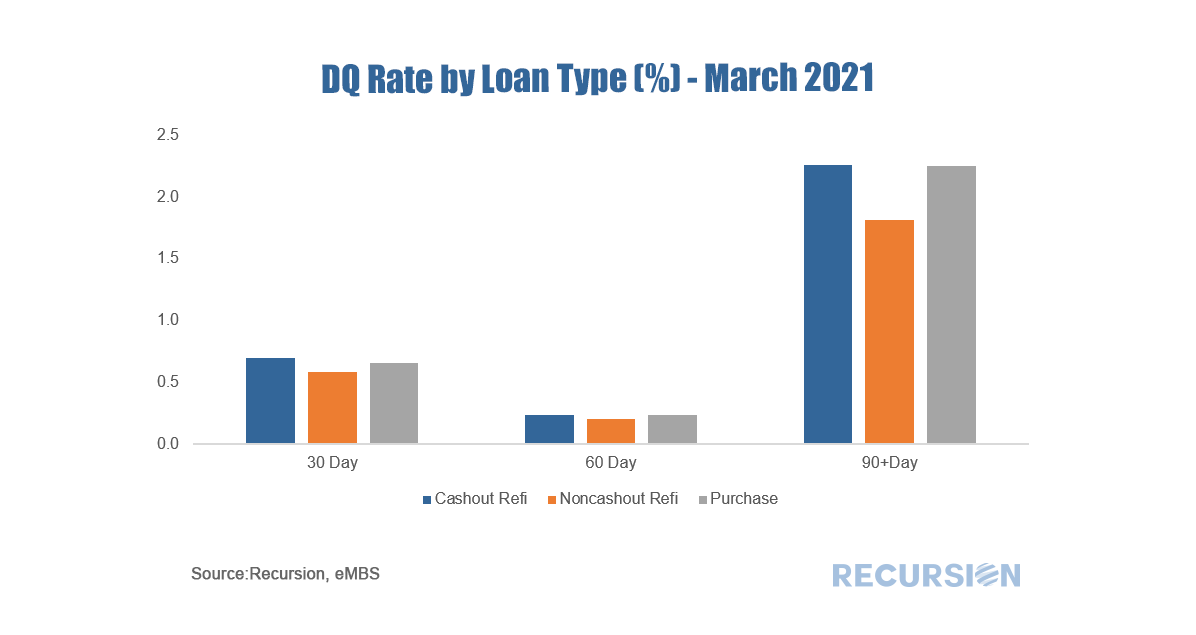
​The performance of cashouts is mildly worse than that for noncashouts, but more in line with purchase mortgages. These statistics will bear watching in future months, particularly as forbearance programs begin to expire towards the end of the year.

[1] https://www.nber.org/digest/dec09/refinancing-boom-and-financial-crisis
[2] https://fred.stlouisfed.org/series/PSAVERT
[3] http://www.freddiemac.com/research/datasets/refinance-stats/index.page

    Archives

    March 2023
    February 2023
    January 2023
    December 2022
    November 2022
    October 2022
    September 2022
    August 2022
    July 2022
    June 2022
    May 2022
    April 2022
    March 2022
    February 2022
    January 2022
    December 2021
    November 2021
    October 2021
    September 2021
    August 2021
    July 2021
    June 2021
    May 2021
    April 2021
    March 2021
    February 2021
    January 2021
    December 2020
    November 2020
    October 2020
    September 2020
    August 2020
    July 2020
    June 2020
    May 2020
    April 2020
    March 2020
    February 2020
    May 2019
    March 2019
    February 2019

    Tags

    All
    Affordability
    ARM
    Bank\Nonbank
    Borrower Assistant Plan
    Cash Window
    Climate Change
    CMBS
    CMO
    Conforming Loan
    Conventional Loan
    COVID 19
    CPR\CDR\CRR\CCR
    Credit Score\DTI\LTV
    CRT\CAS\STACR
    Delinquency
    Early Buyout
    Early Payment Default
    ESG
    ET Pools
    Fannie Mae
    Fed
    FHA
    FHFA
    Forbearance
    Foreclosure
    Foreign Investor
    Freddie Mac
    Ginnie Mae
    Green Loans
    HECM
    HELOC
    HMDA
    HUD
    LMI
    Manufactured Housing
    Modified Loans
    MSR
    Multifamily
    Occupancy Type\NOO
    Partial Claim
    Payoff
    PIW
    Prepayment
    Purchase Loans
    Recursion In News
    Refi Loans
    Reperforming
    RG Pools
    Rural Housing
    Single Family
    Special Eligibility Program
    TBA Market
    TIC
    TPO
    UMBS
    US Treasury
    VA

RECURSION

SOLUTIONS ​
Recursion Analyzers
​
Mortgage Company Data
Recursion DataCloud
Customized Solutions


ABOUT US  ​
Overview
​Our team
CLIENT LOGIN   ​
Recursion Analyzers

CONTACT

224 West 30th St., Suite 303, New York, NY 10001
Contact Us

Picture
Copyright © 2022 Recursion, Co. All rights reserved.​
  • HOME
  • solutions
    • RECURSION ANALYZERS
    • Mortgage Company Data
    • Recursion DataCloud
    • Customized Solutions
  • BLOG
  • CLIENT LOGIN
    • Recursion Analyzers
  • ABOUT US
    • OVERVIEW
    • OUR TEAM
    • News & Events >
      • Recursion In News
      • Recursion Data Citations
  • CONTACT