• HOME
  • solutions
    • RECURSION ANALYZERS
    • Mortgage Company Data
    • Recursion DataCloud
    • Customized Solutions
  • BLOG
  • CLIENT LOGIN
    • Recursion Analyzers
  • ABOUT US
    • OVERVIEW
    • OUR TEAM
    • News & Events >
      • Recursion In News
      • Recursion Data Citations
  • CONTACT
RECURSION CO
  • HOME
  • solutions
    • RECURSION ANALYZERS
    • Mortgage Company Data
    • Recursion DataCloud
    • Customized Solutions
  • BLOG
  • CLIENT LOGIN
    • Recursion Analyzers
  • ABOUT US
    • OVERVIEW
    • OUR TEAM
    • News & Events >
      • Recursion In News
      • Recursion Data Citations
  • CONTACT
BLOG

Fannie Mae Performance Shortfall – Continued

2/10/2021

 
Our last post demonstrated that Fannie Mae performance at the pool level has been lagging that of Freddie Mac since the start of the pandemic[1]. The question remains as to why. The challenge in answering this question is that unlike the case for Ginnie Mae programs, Fannie Mae and Freddie Mac have not been releasing performance data on the loan level[2]. Those who subscribe to our monthly risk reports know that we have been tracking relative underwriting standards between the two mortgage giants for some time. We do this not by looking at the average levels of underwriting characteristics, but rather at looking at the tails of these characteristics. Our experience is that this is a far superior method for this as distinct policy about risk come in much clearer this way. We focus on the share of GSE deliveries ​with LTV>95, DTI>45, and credit score<680.
Picture
Picture
Picture
Picture
Run Underlying Query
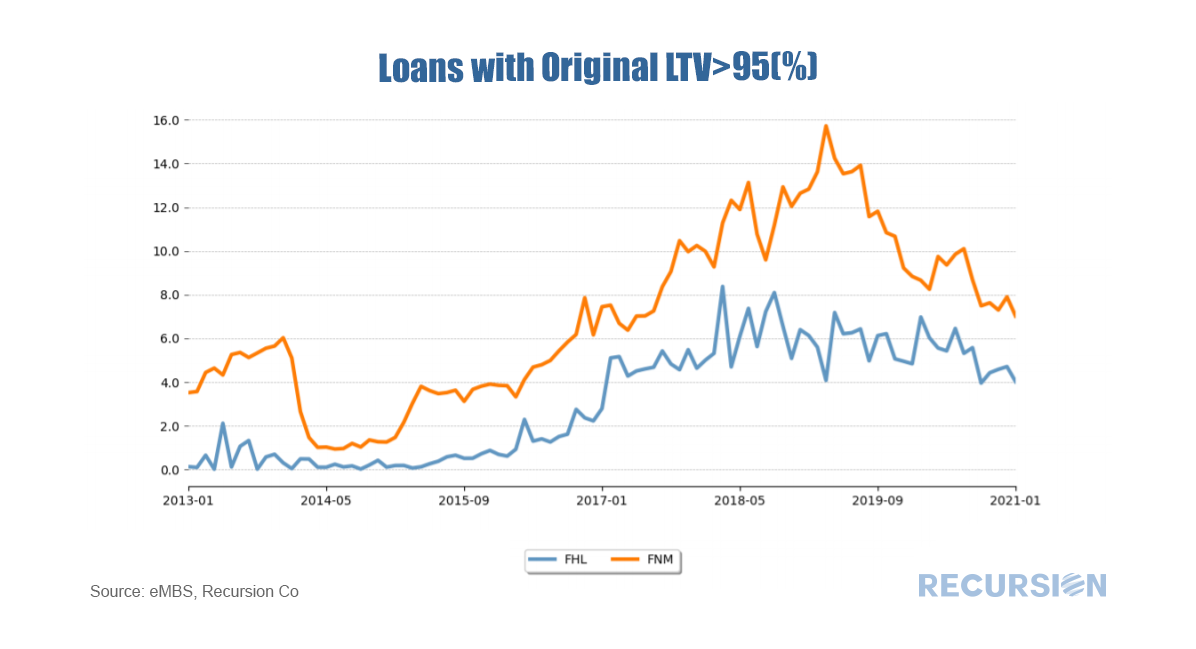
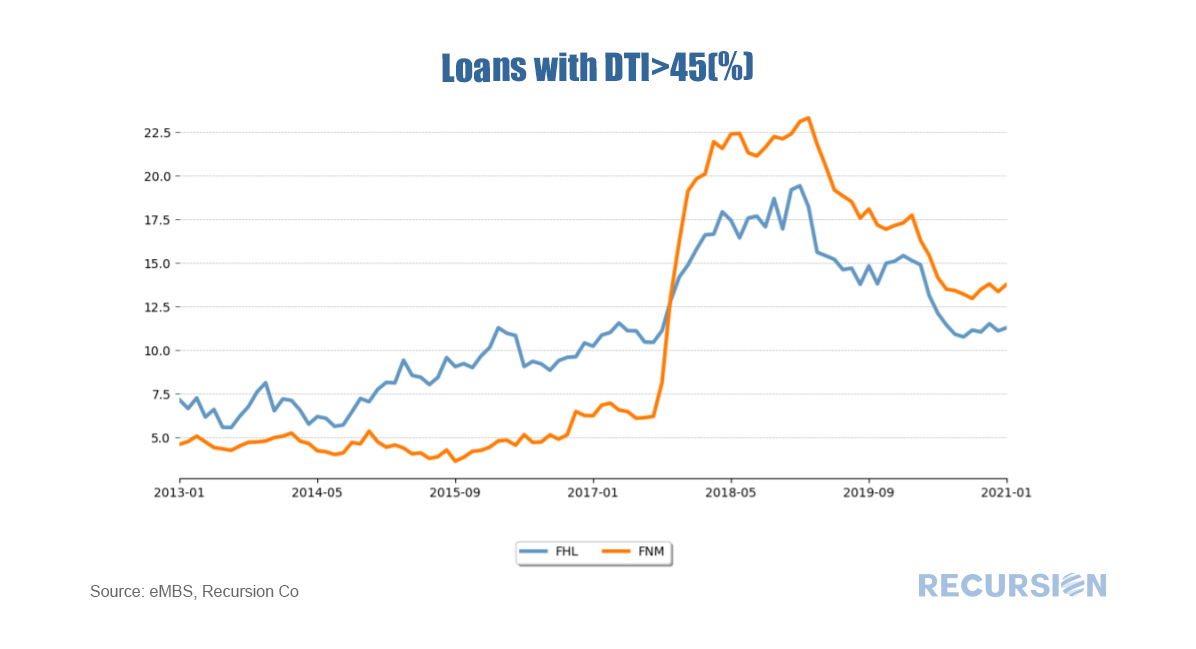
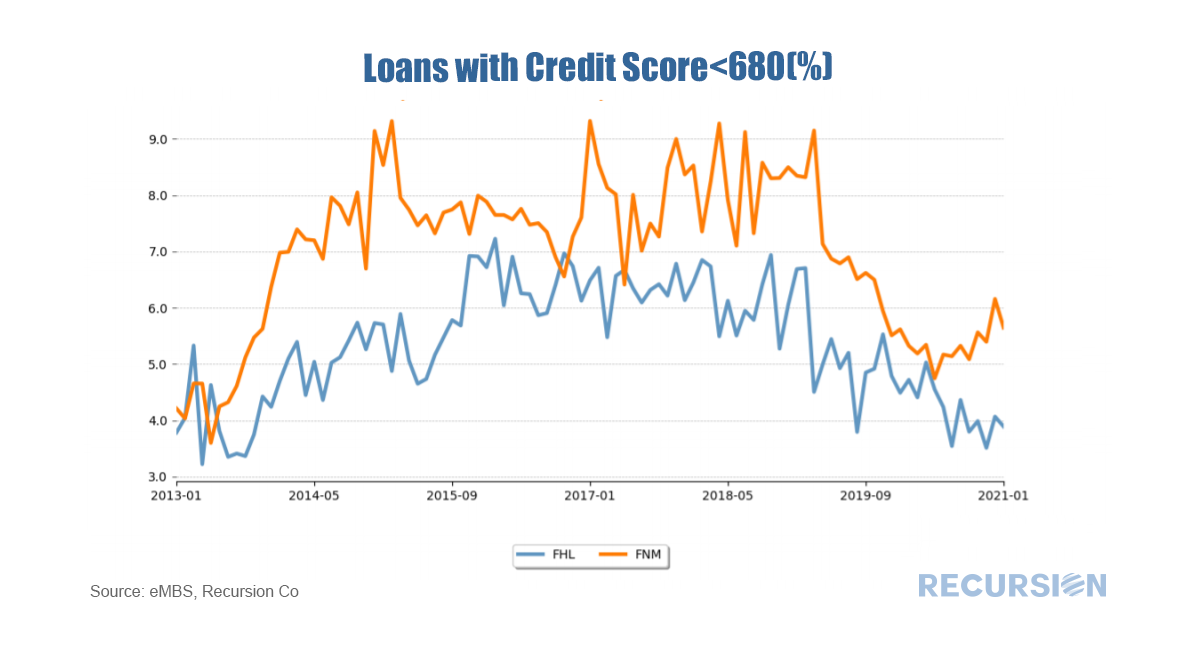
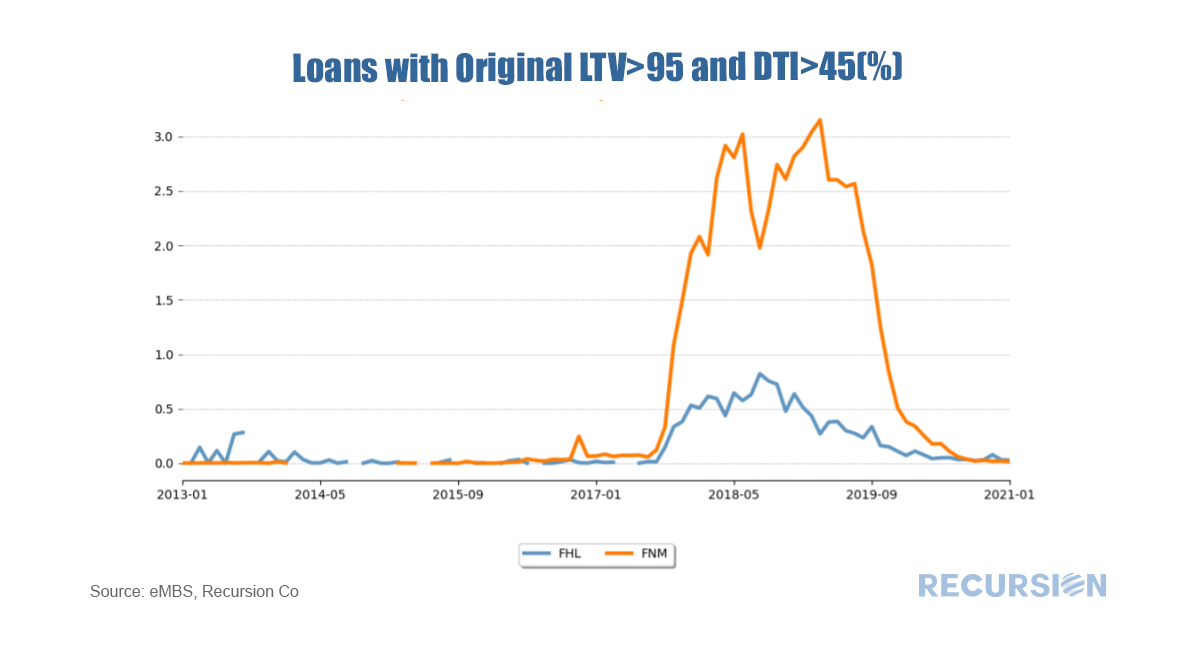
​Casual observation shows that since 2018, Fannie Mae has had a greater percentage of highly leveraged, low credit-score loans delivered to them than has Freddie Mac, with a clear peak of this difference in 2018, and early 2019. This raises a suggestion for investigating the source of the delinquency difference between the two Enterprises. We do not have loan-level data, but we do have pool level data, so we can investigate DQ differences by vintage. The chart below this shows the difference in total delinquency rates by vintage for the 2.0%, 2.5% and 3% coupons.
Picture
Run Underlying Query
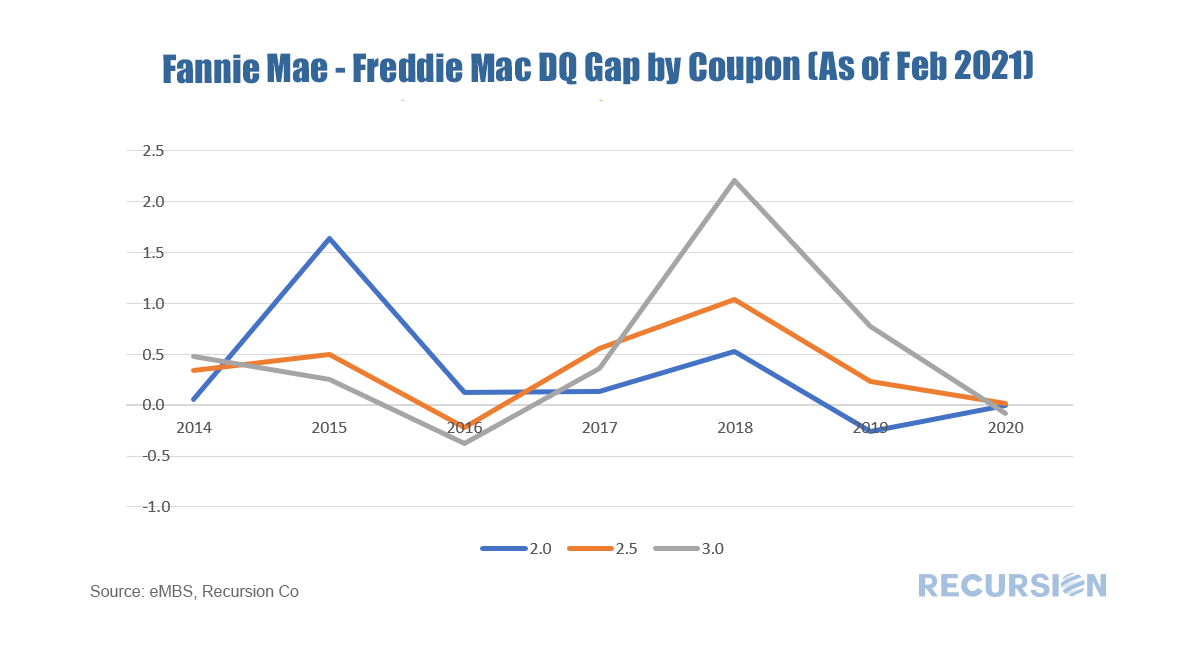
​The clear spike in the gap in 2018 is strong prima facie evidence that relative underwriting standards are at the center of the performance difference.

[1] https://www.recursionco.com/blog/fannie-mae-february-pool-level-performance-falls-vs-freddie-mac
[2] The GSEs will begin to provide such data beginning next month. See http://www.freddiemac.com/research/datasets/sf_loanlevel_dataset.page

    Archives

    March 2023
    February 2023
    January 2023
    December 2022
    November 2022
    October 2022
    September 2022
    August 2022
    July 2022
    June 2022
    May 2022
    April 2022
    March 2022
    February 2022
    January 2022
    December 2021
    November 2021
    October 2021
    September 2021
    August 2021
    July 2021
    June 2021
    May 2021
    April 2021
    March 2021
    February 2021
    January 2021
    December 2020
    November 2020
    October 2020
    September 2020
    August 2020
    July 2020
    June 2020
    May 2020
    April 2020
    March 2020
    February 2020
    May 2019
    March 2019
    February 2019

    Tags

    All
    Affordability
    ARM
    Bank\Nonbank
    Borrower Assistant Plan
    Cash Window
    Climate Change
    CMBS
    CMO
    Conforming Loan
    Conventional Loan
    COVID 19
    CPR\CDR\CRR\CCR
    Credit Score\DTI\LTV
    CRT\CAS\STACR
    Delinquency
    Early Buyout
    Early Payment Default
    ESG
    ET Pools
    Fannie Mae
    Fed
    FHA
    FHFA
    Forbearance
    Foreclosure
    Foreign Investor
    Freddie Mac
    Ginnie Mae
    Green Loans
    HECM
    HELOC
    HMDA
    HUD
    LMI
    Manufactured Housing
    Modified Loans
    MSR
    Multifamily
    Occupancy Type\NOO
    Partial Claim
    Payoff
    PIW
    Prepayment
    Purchase Loans
    Recursion In News
    Refi Loans
    Reperforming
    RG Pools
    Rural Housing
    Single Family
    Special Eligibility Program
    TBA Market
    TIC
    TPO
    UMBS
    US Treasury
    VA

RECURSION

SOLUTIONS ​
Recursion Analyzers
​
Mortgage Company Data
Recursion DataCloud
Customized Solutions


ABOUT US  ​
Overview
​Our team
CLIENT LOGIN   ​
Recursion Analyzers

CONTACT

224 West 30th St., Suite 303, New York, NY 10001
Contact Us

Picture
Copyright © 2022 Recursion, Co. All rights reserved.​
  • HOME
  • solutions
    • RECURSION ANALYZERS
    • Mortgage Company Data
    • Recursion DataCloud
    • Customized Solutions
  • BLOG
  • CLIENT LOGIN
    • Recursion Analyzers
  • ABOUT US
    • OVERVIEW
    • OUR TEAM
    • News & Events >
      • Recursion In News
      • Recursion Data Citations
  • CONTACT