|
The Covid-19 pandemic has resulted in a great economic shock that has been met with a tremendous policy reaction in the form of interest rate cuts and MBS purchases by the central bank. Prepayments have picked up substantially during the year. The question arises as to whether the magnitude of the response is unusual compared to previous episodes of rate declines, and whether they can rise further should borrowing costs fall further. The magnitude of the relationship between rates and refis is complex and depends crucially on a number of factors. First, the relationship is path-dependent. That is, it doesn’t just matter if rates fall 1.0%, but whether this decline takes rates to new lows so that the biggest possible set of borrowers can profitably refinance. Great gobs of sophisticated statistics and modeling go into forecasting prepays on the part of lenders and investors. But a look at prepays over time shows three main waves of refis over the past 20 years. The first (A) is 2000-2003, (B) 2008-2013, and (C) 2019-2020. In all three instances, rates reached new lows. The dates correspond roughly to the times when the mortgage rate broke to a new low until a new trough was formed (or the present in the case of “C”) 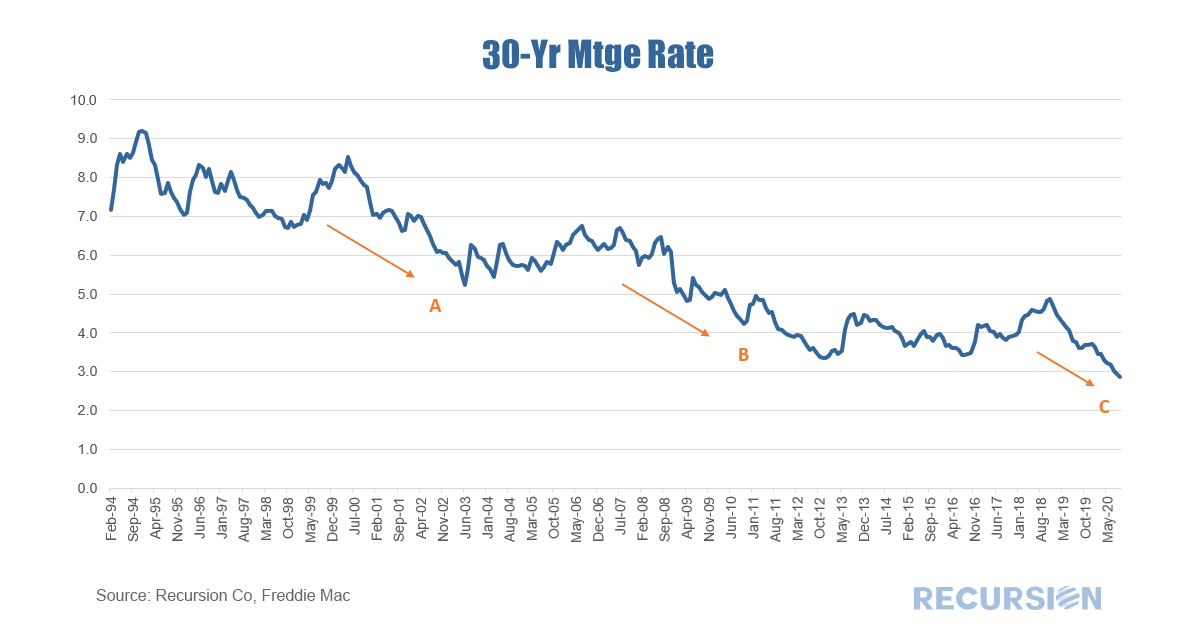 Here are the corresponding periods for prepays: 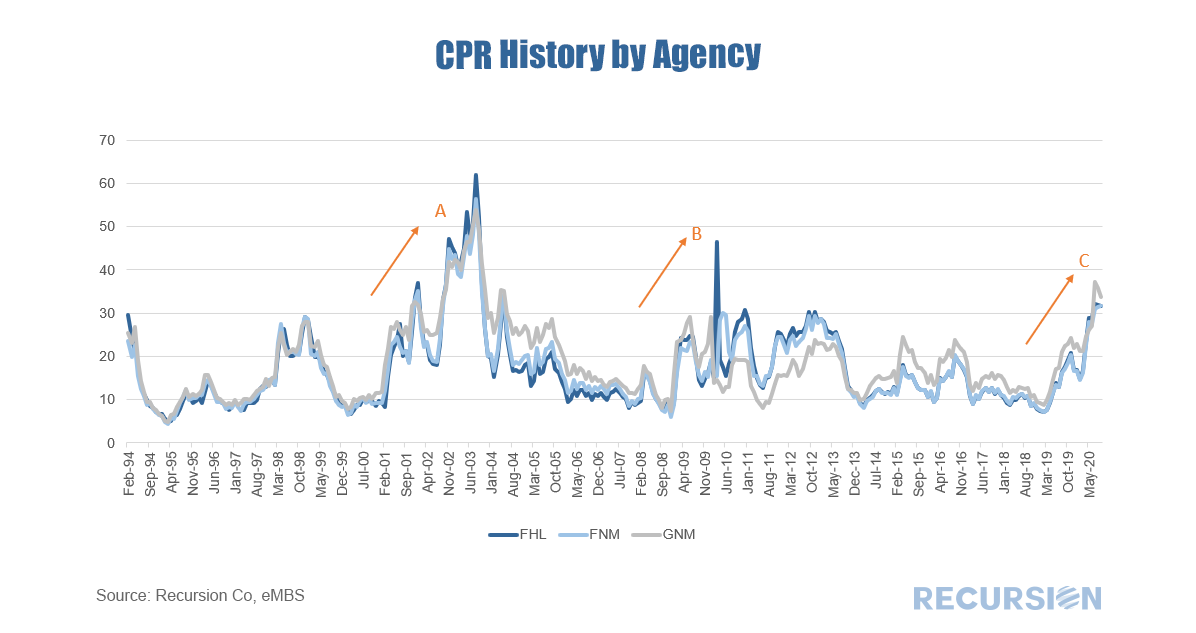 Here are the corresponding periods for originations: 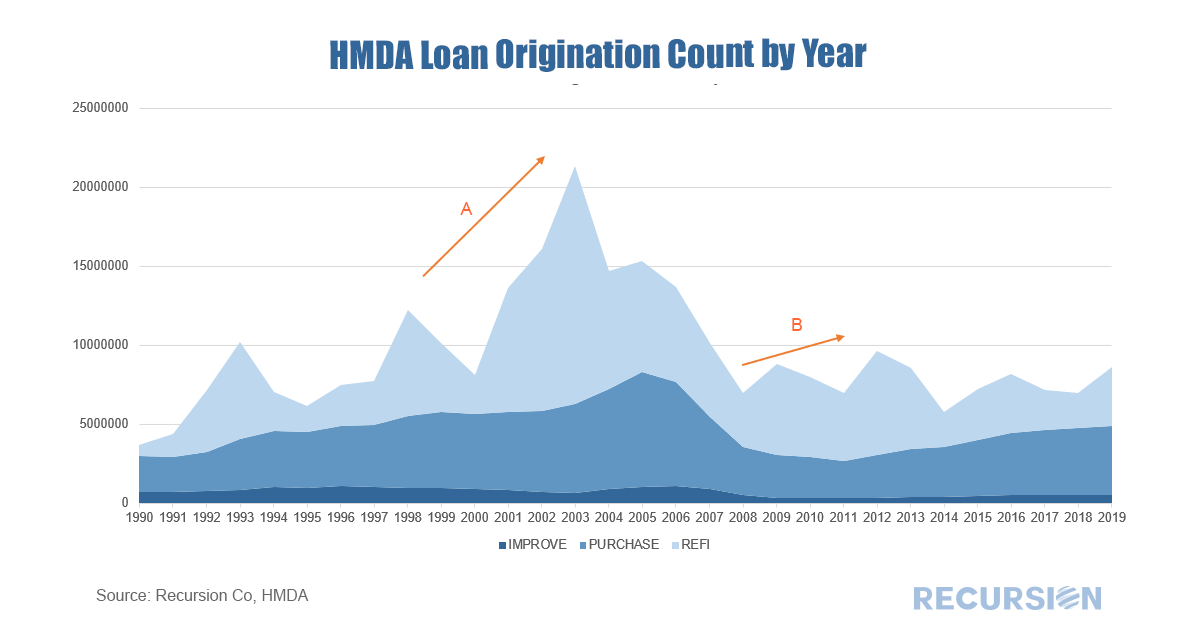 Here is a summary of the three periods: 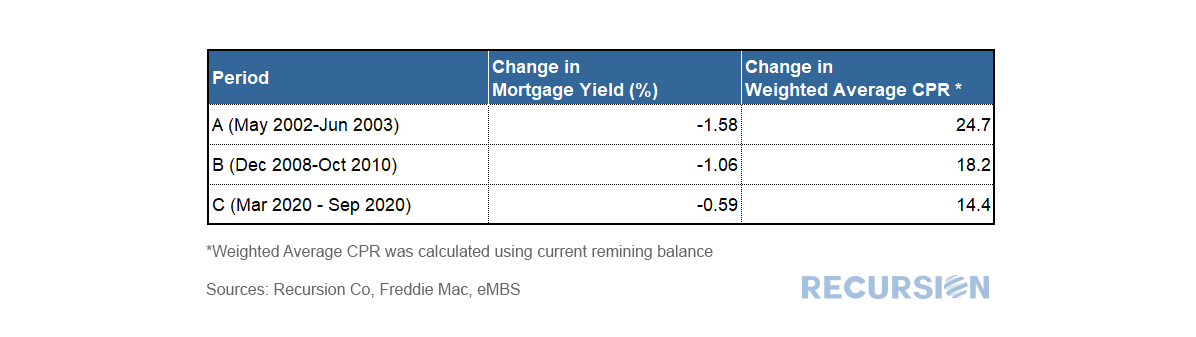 Notably, the biggest jump in prepays occurred in the early 2000s, reaching a record high of 60 CPR. Rates had fallen substantially based on aggressive Fed ease in the wake of the bursting of the tech stock bubble. This passed right through to refis. There was also a substantial decline in rates with the Global Financial Crisis(GFC), but the refi response was more muted due to declining house price, but perhaps also more stretched out in time (off and on through 2013). The current episode with Covid-19 has resulted in record-low mortgage rates, and a substantial spike in refis, but still well below the experience of 2002-04. What might explain the differences? A clear place to look is at credit conditions. If rates drop the same amounts in time periods X and Y, but credit conditions are tighter in Y than X, we can reasonably expect a bigger refi impact in X than Y. Below shows the Urban Institute’s Housing GSE Credit Availability Index, which is used to evaluate lender’s risk tolerance: 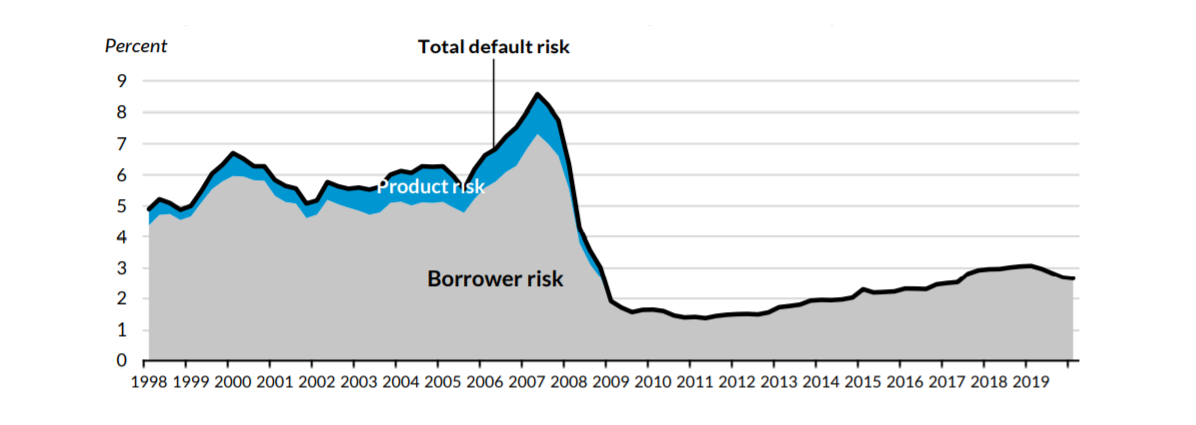 Note: Urban Institute’s Housing Credit Availability Index for GSE Chanel. Adapted from Urban Institute Housing Finance at a Glance (August 2020). (https://www.urban.org/research/publication/housing-finance-glance-monthly-chartbook-august-2020)
As can be seen, credit was extremely loose before the GFC, very tight thereafter, followed by a period of modest loosening until 2019. This correlates well with the magnitude of the response of prepays to interest charges in the three regimes. Too hot, too cold and just right? Maybe. All of this is important not just for investors but for the central bank as the Fed attempts to steer the economy through this uniquely uncertain period. Recently, credit conditions appear to have started tightening. It’s unclear whether this is a “normal” market reaction as volumes rise and capacity is constrained (good credits are easier to process) or whether lenders are becoming more cautious based on a more pessimistic view of the economic outlook. There is a big difference between the two in terms of choosing a successful investment strategy or an optimal monetary policy. The answer is unlikely to come from attempts to model borrower and lender behavior in a nuanced way and more likely to be discerned by careful observation of emerging trends in big data sets. |
Archives
July 2024
Tags
All
|
 RSS Feed
RECURSION |
|

Copyright © 2022 Recursion, Co. All rights reserved.