|
We’ve written many, many times about the inexorable rise in the role of nonbanks in the mortgage market[1]. A variety of factors have contributed to these gains, including superior technology, a relatively less oppressive regulatory environment, and Covid-19 chasing people out of bank branches online. This picture can be a little blurry, however, depending on the way you look at the market. There is, for example, the distinction between servicing book shares and origination shares. Our agency disclosure data doesn’t provide information on originators, but we can use “seller” as a proxy. The table below looks at the trends in outstanding portfolio and issuance for the conforming and Government markets over the period January 2022 – July 2023: 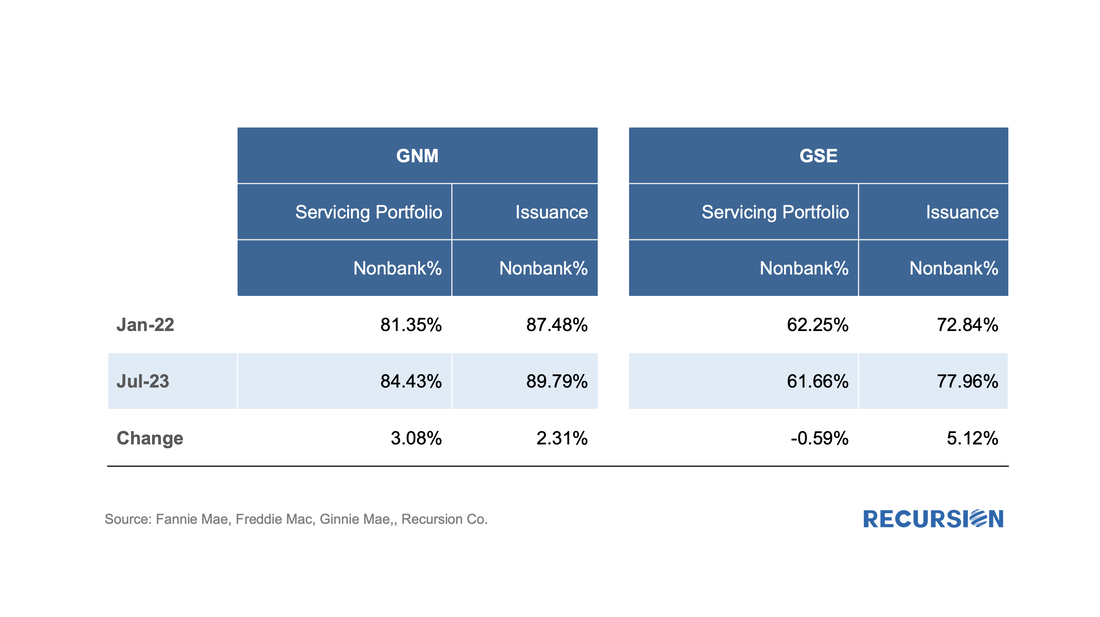 Overview The release of the Financial Accounts of the United States (also known as the Z.1[1]) is always an opportunity to learn about important structural changes in the mortgage market. This is particularly the case in our current environment of high home prices and borrowing costs which we call “mortgage winter”. In this note, we focus on the breakdown on the ownership of risk for single family mortgages. This is not the share of ownership of MBS; it is who bears the credit risk for the loans. Unsurprisingly, the growth in single-family mortgage credit outstanding in Q1 grew by the smallest amount in almost 7 years in the first quarter of 2023: 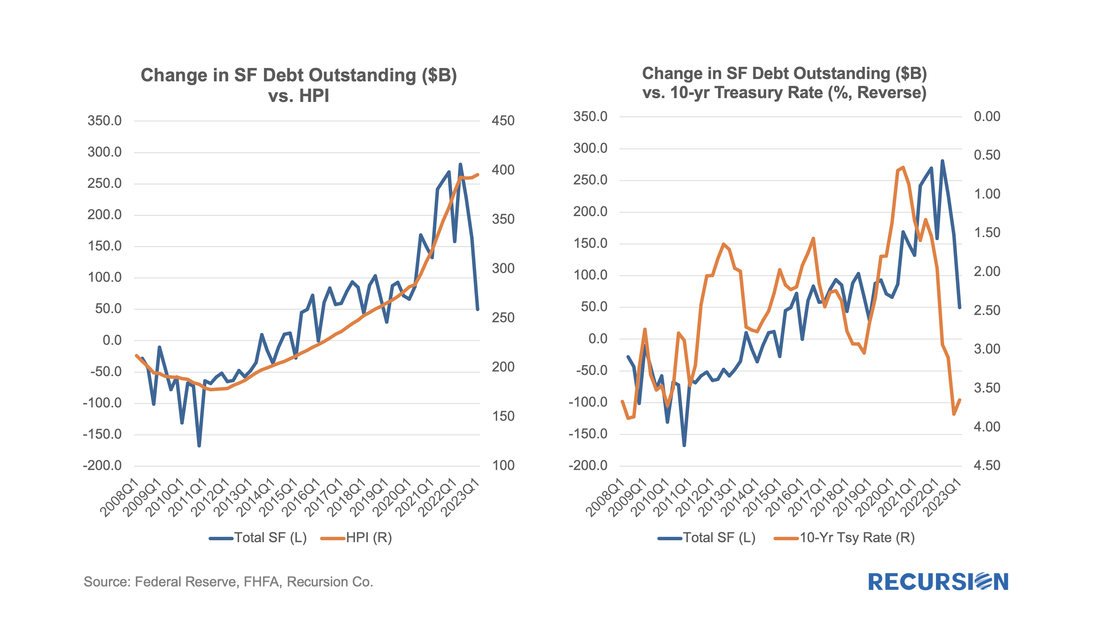 Rising inflation and 30-year mortgage rates near 20-year highs of around 7%, coupled with historically high house prices, have sharply dampened housing demand in the US. This is particularly true for lower-income borrowers where household budgets are badly stretched. These developments have caught the attention of policymakers, who, in response, have taken it upon themselves to lower mortgage fees to partially compensate for these factors. This is an interesting moment in the formation of housing policy as we have two sets of changes taking effect close together in time. First, FHA announced on February 22, 2023, that it would cut its mortgage insurance premiums by 0.30% to 0.55% effective March 20. More recently, on March 22, GSEs implemented a rather complex set of changes in their upfront fee schedules, effective May 1: 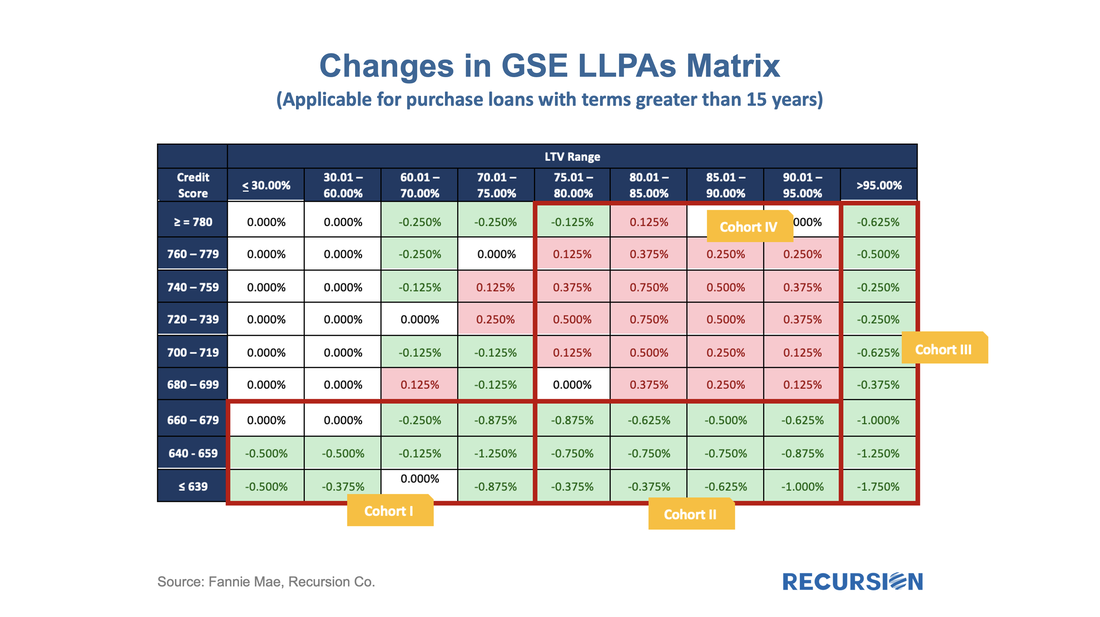 To read the full article, please send an email to inquiry@recursionco.com
As famous investor Warren Buffett once stated, “Only when the tide goes out do you learn who has been swimming naked.” Well, it turns out that only in a declining market can you see which segments are resilient. In this case, we will look at Planned Unit Developments or PUD’s. A PUD is a planned neighborhood, generally consisting of a group of single-family homes that are bound together by a Homeowners Association (HOA). In this manner, it is like a condo, with the significant difference that the property is usually a stand-alone structure that the buyer owns along with the lot on which it is located. Details about eligibility can be found in Fannie Mae’s selling guide[1]. Below finds the ratio of purchase mortgage deliveries from PUDs to those of 1-4 unit conventional loans: 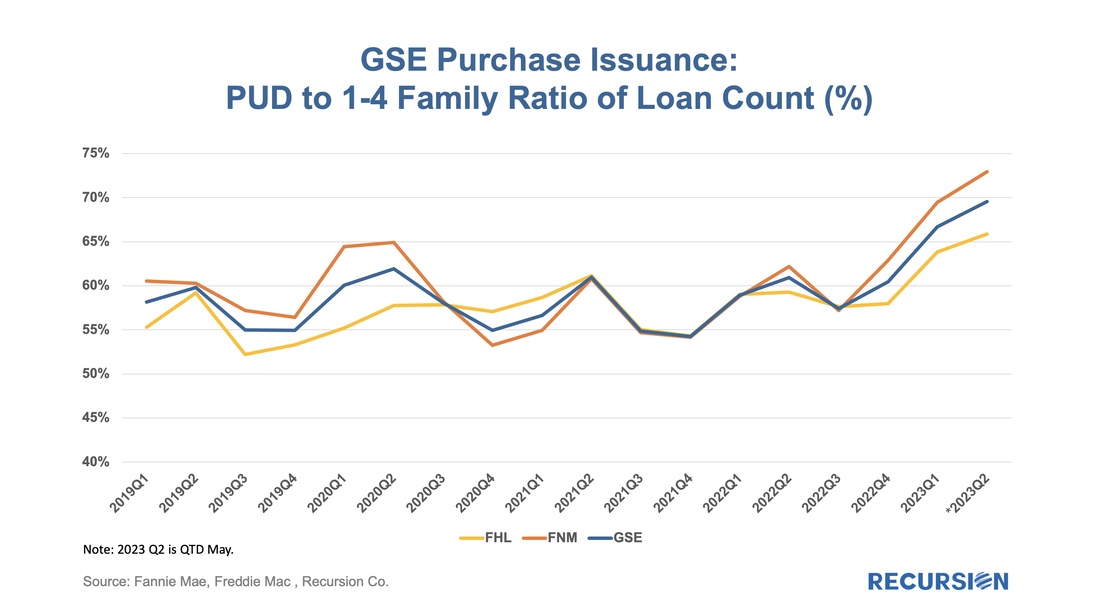 The release of the Agency performance data in early May provided confirmation that the dip in Early Payment Defaults[1] we have witnessed over the last three months ended a 16-month long uptrend in this statistic for FHA loans. A similar but far more muted pattern can be seen for VA and conventional mortgages. In a previous post, we speculated that the uptrend was correlated with the higher inflationary trend observed since early 2021[2]. Below please find an update of the chart: 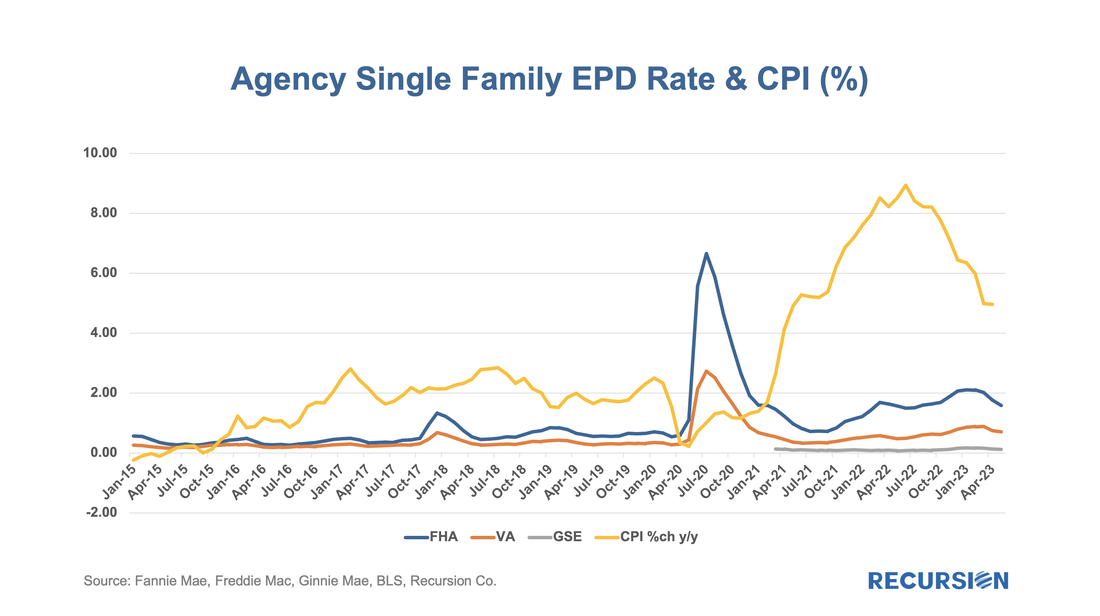 As daily April Agency mortgage loan delivery data completed, we found convincing evidence that the freeze in market activities we have witnessed since the fourth quarter of 2022 is continuing, although there are some new twists. Here is the chart for the loan counts of purchase market deliveries to the GSEs back to 2019. Rather than do this as a time series, we stack the years over an annual monthly x-axis to better correct for the seasonality in the time series: 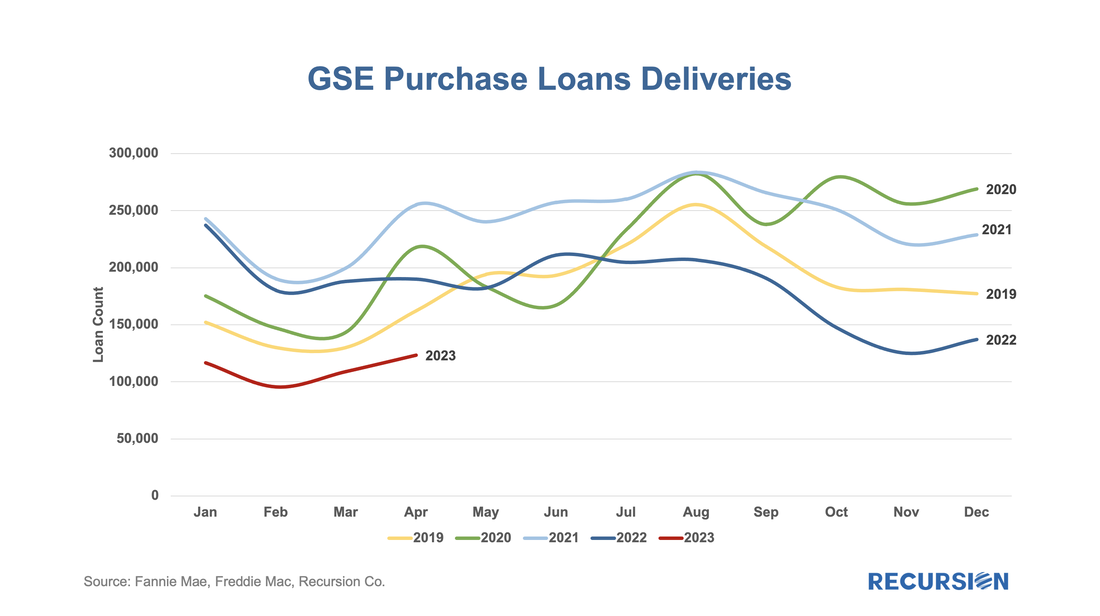 The recent release of “Social Scores” on the part of the GSE’s serves to point out the broad range of ESG issues facing the mortgage market.[1] Of course, this covers a lot of policy territory, and over time investors, lenders and policymakers will have to come to grips with the details associated with these concerns. In today’s post, we look at environmental issues related to the condo market. These issues came to a head with the disaster in Surfside Florida in June 2021, when the partial collapse of Champlain Towers South, a 12-story condo, resulted in 98 deaths and over $1 billion being awarded to victims in a class action lawsuit. Implications for regulation and insurance costs continue to be felt as the event brought home the immediacy of issues surrounding climate change to the general public. In October 2021, Fannie Mae issued a Lender Letter presenting tightened requirements that impact the eligibility of loans made in buildings with five or more attached units[2]. These new policies were “designed to support the ongoing viability of condo and co-op projects…(as) aging infrastructure and significant deferred maintenance are a growing concern across the nation.” These new standards came into effect on January 1, 2022. Among other things, they may land a building on an “unavailable” status if there is significant deferred maintenance, failure to pass local regulatory inspections, or not meeting the 10% budget reserve requirement. To see if there is any impact, we start with a look at Freddie Mac and Fannie Mae condo loan deliveries from January 2019 to March 2023. During this period, the two Enterprises delivered 1.16 million purchase loans securitized by a condo, of which Fannie Mae generally had a share of about 57%: 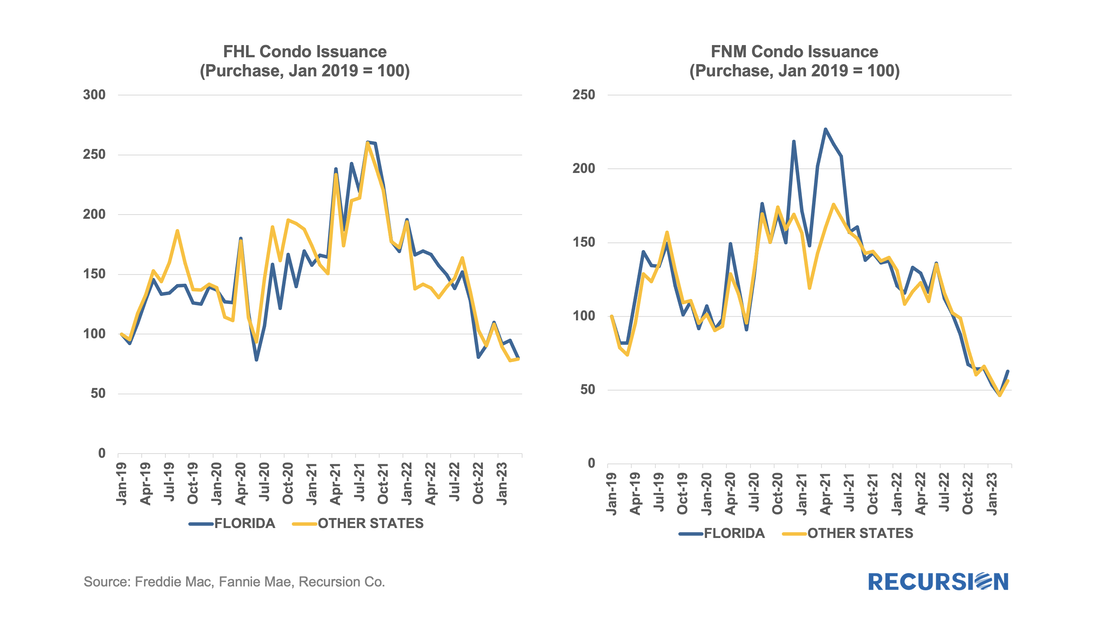 Introducing the Recursion Agency Multifamily Dataset Part 2: Outstanding Balance Benchmarking3/20/2023
In a recent post, we introduced the Recursion Agency Multifamily Dataset, a complete accounting of multifamily loans securitized in Agency pools, going back to 2009. We provided a breakdown of issuance for the total market and by agency in that post. A natural question that arises is how can we benchmark our new dataset? In this case, we look at outstanding balance rather than issuance volume. The Agencies provide quarterly data on total outstanding balances on their web sites. When we compare this to our own data, we get this: 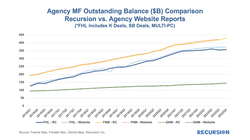 To read the full article, please send an email to inquiry@recursionco.com |
Archives
February 2024
Tags
All
|
 RSS Feed
RECURSION |
|

Copyright © 2022 Recursion, Co. All rights reserved.