|
In a recent post[1], we discussed the various factors behind the elevated pace of prepayments in Ginnie Mae securitized pools relative to those in conventional pools. A key driver of the difference in speeds is the different incentives facing Ginnie Mae program servicers regarding loan buyouts on one hand and those facing the GSE’s on the other. In the first case, the economics of the transaction are often favorable for servicers with cash available to purchase loans out of pools while the GSE’s take a more balanced view of the interests of servicers and investors.
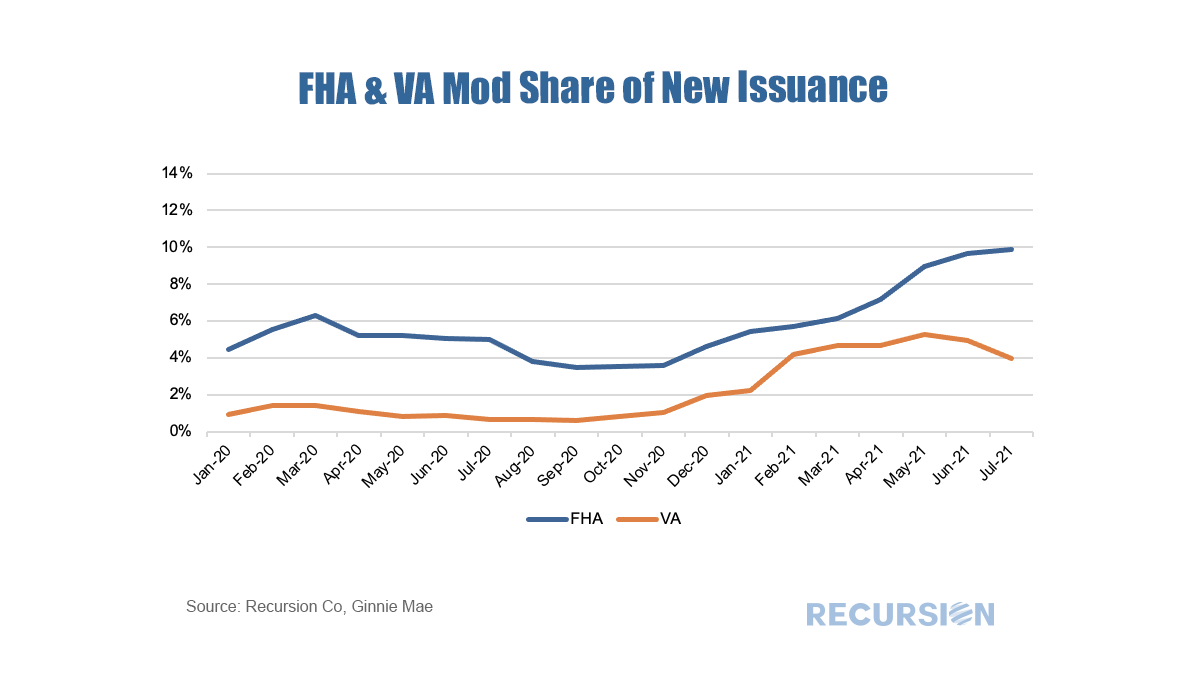
The key regulation driving GSE behavior in this regard is the September 30, 2020 statements by the Enterprises extending the timeframe for delinquent loan buyouts from four consecutive months to twenty four consecutive months[2]. While forbearance was not explicitly mentioned in these announcements, there is clearly a connection between this timeframe and that of the duration of the forbearance programs. For conventional loans that entered a plan prior to February 28 2021, borrowers have a maximum 18 months of forbearance available to them[3]. Since the biggest share of loans in forbearance took place in Q2 2020, that 18 month period is running out for many. As borrowers work with their servicers to consider their options, loan buyouts should start to pick up in coming months as distressed borrowers pursue loan modifications or enter into foreclosure proceedings. In addition, distressed borrowers with equity in their homes may choose to sell their properties, leading to a pickup in voluntary prepayments. Over the past six months, prepayment speeds of Ginnie Mae securities have notably widened against those of the GSEs. 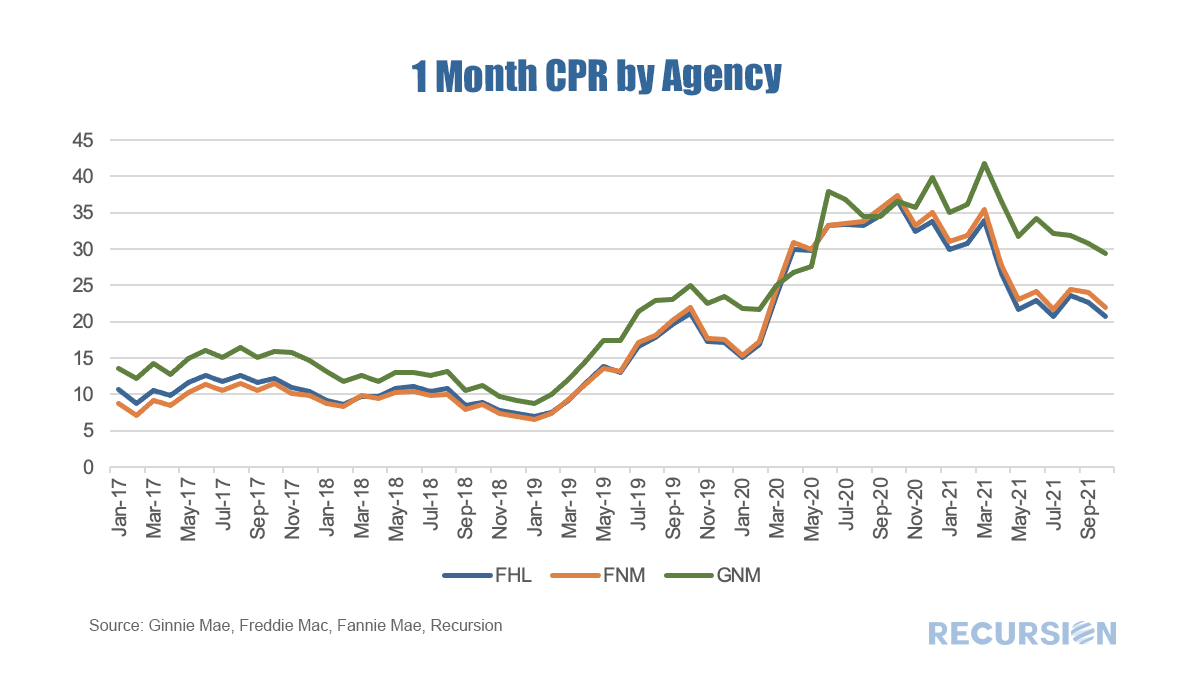 Received wisdom in the mortgage market holds that distress in the mortgage market eases as the labor market improves. While there is certainly some justification for this view, in fact there are many factors that drive performance so the direct correlation with the jobs market does not always hold. 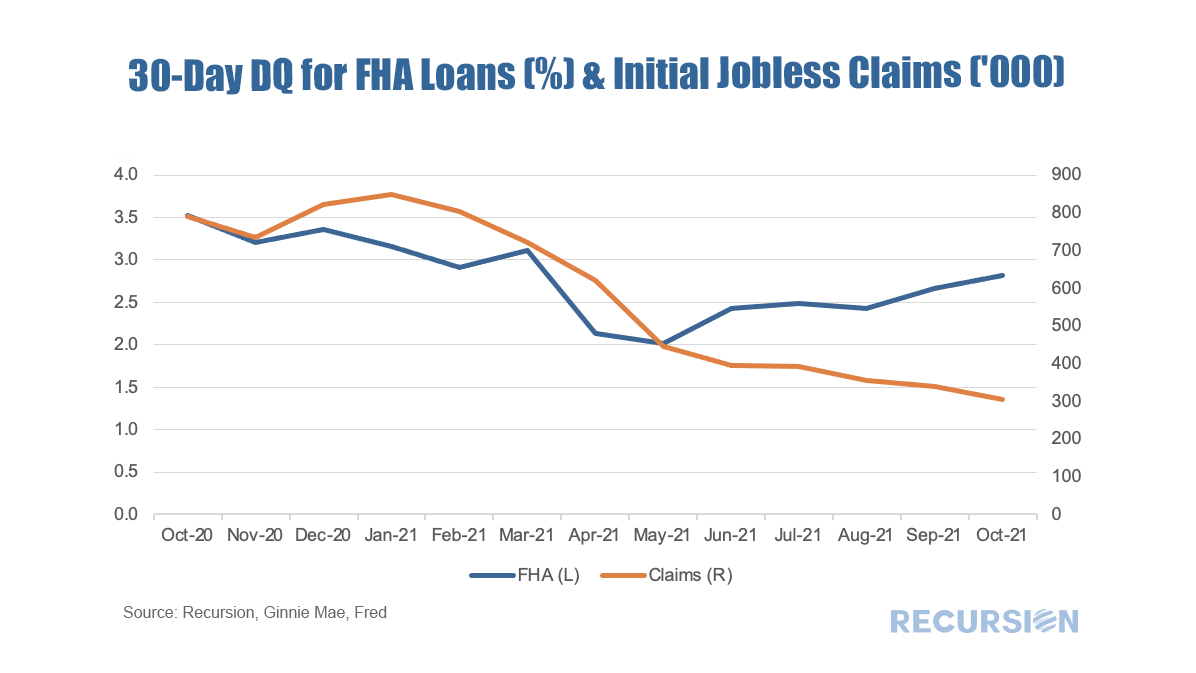 One of the many recurring themes of these posts is that the shock of the Covid-19 Pandemic and subsequent policy response has resulted in structural changes in behavior that cause loan performance metrics to shift compared to the pre-crisis world. An interesting example of this can be found in the performance of modified loans in Ginnie Mae programs. Modified loans in these programs are those that have been purchased out of pools by servicers that are past due that subsequently have features such as rate and term adjusted in order to bring households back to a current status. These are then often resecuritized into a new GNM pool.
 The new FHFA Acting Director Sandra Thompson has lost no time in implementing new policies designed to support homeownership with the aim of creating greater wealth equality. This is the basis of the New Housing Policy we described in a recent post[1]. At first, this involved extending foreclosure moratoriums for distressed families until the end of the year[2]. Then recently, the GSE regulator announced a change in its modification policy to broaden the eligibility for rate mods to any qualifying household that were previously only available to those with a mortgage greater than or equal to 80% of the current home valuation (Current LTV>=80)[3]. This program is designed to allow as many credit-worthy borrowers to stay in their homes as possible. The LTV limit is significant because the surge in house prices we have witnessed over the past year has meant that a relatively small share of loans should have Current LTVs greater than or equal to 80. Our loan-level data set allows us to examine this question by looking at over 25 million GSE loans. Below finds a snapshot of the total combined June books of the GSEs broken down in this manner: 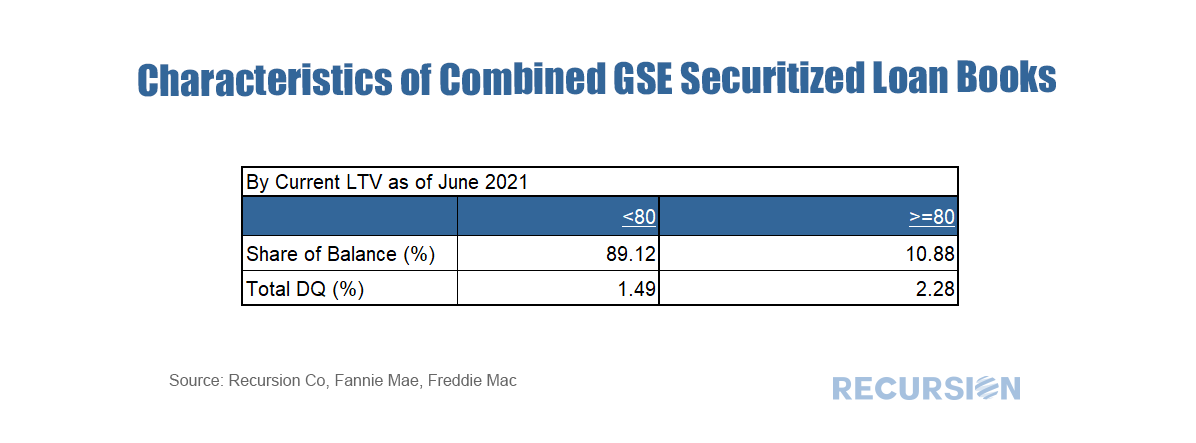 In a previous post, we mentioned the Recursion Matched data set[1], which uses a proprietary algorithm to match the loans provided in the monthly Agency loan tapes, with HMDA data. This allows for a broad analysis of loan performance (delinquency and prepayment rates) in terms of both underwriting standards (credit score, DTI, LTV) with demographic and household economic characteristics (income, race, gender, etc). We are always working to improve our algorithm, below find the match rates for Ginnie Mae loans over the 2013-2020 period. HMDA has released more characteristics in recent years, allowing for a greater matching rate. 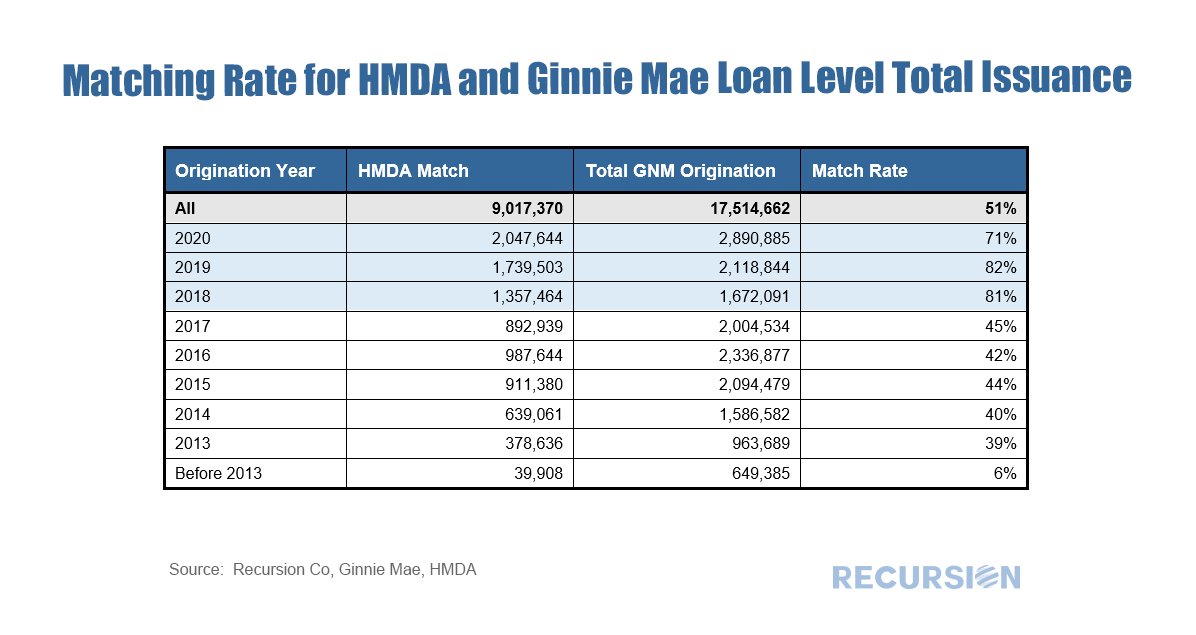 We received the first loan-level performance data for the GSE’s a few months ago, so it’s about time to see what tentative observations can be drawn from this new data set. As a popular theme for this blog is the bank/nonbank share this seems a good place to start. In general, we have noticed that nonbank DQ’s tend to be higher than those for banks, and that this distinction is correlated with the relatively more generous credit terms available in the nonbank sector. Below find a table that demonstrates this for 2018 and 2019 vintage mortgages: 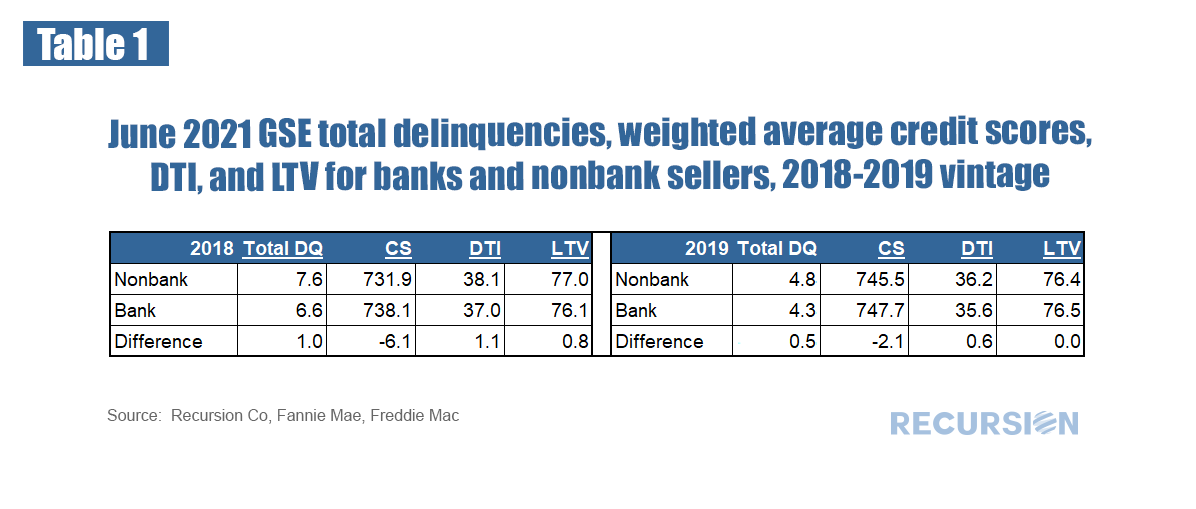 This can be summarized: 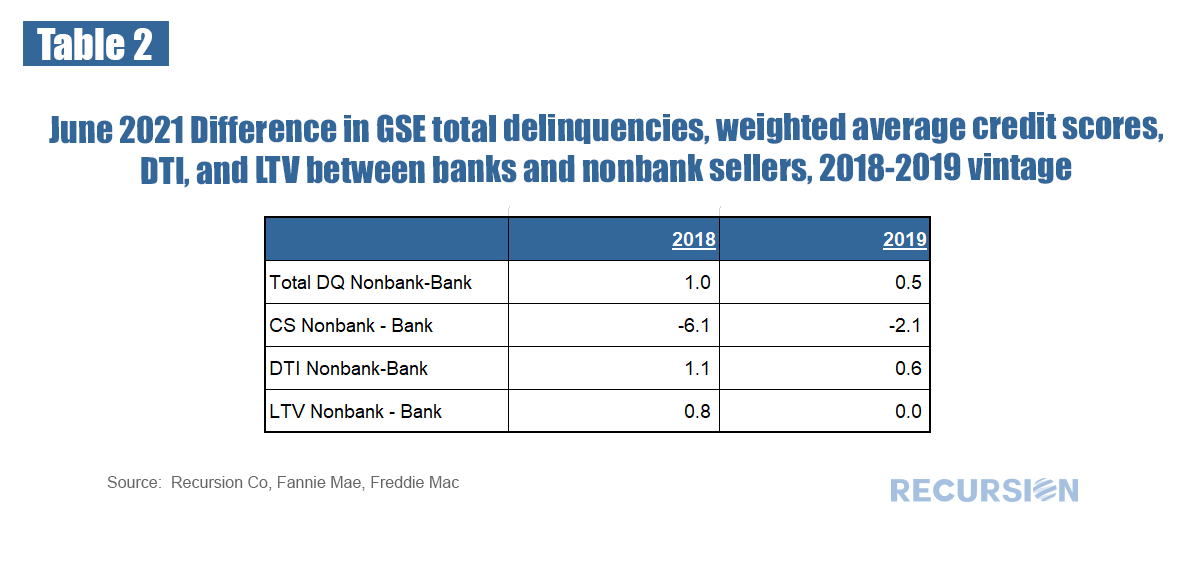 In a recent post we discussed trends in the conforming purchase market by occupancy type[1]. In this note we look at performance metrics. To begin, we look at prepayment speeds. It’s important to note that certain fees (which Fannie Mae calls LLPA’s[2] and Freddie Mac calls Credit Fees[3]) vary by occupancy type, particularly for those with high LTV’s. 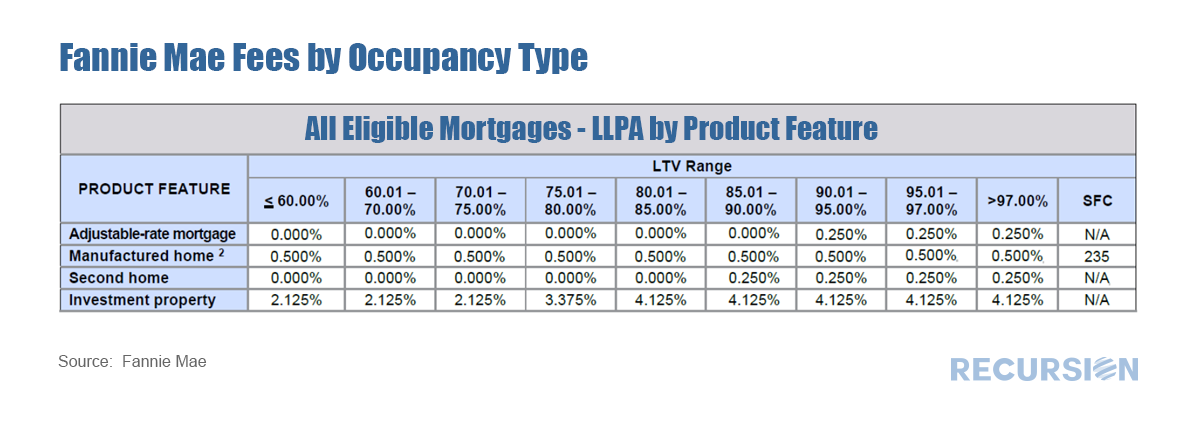 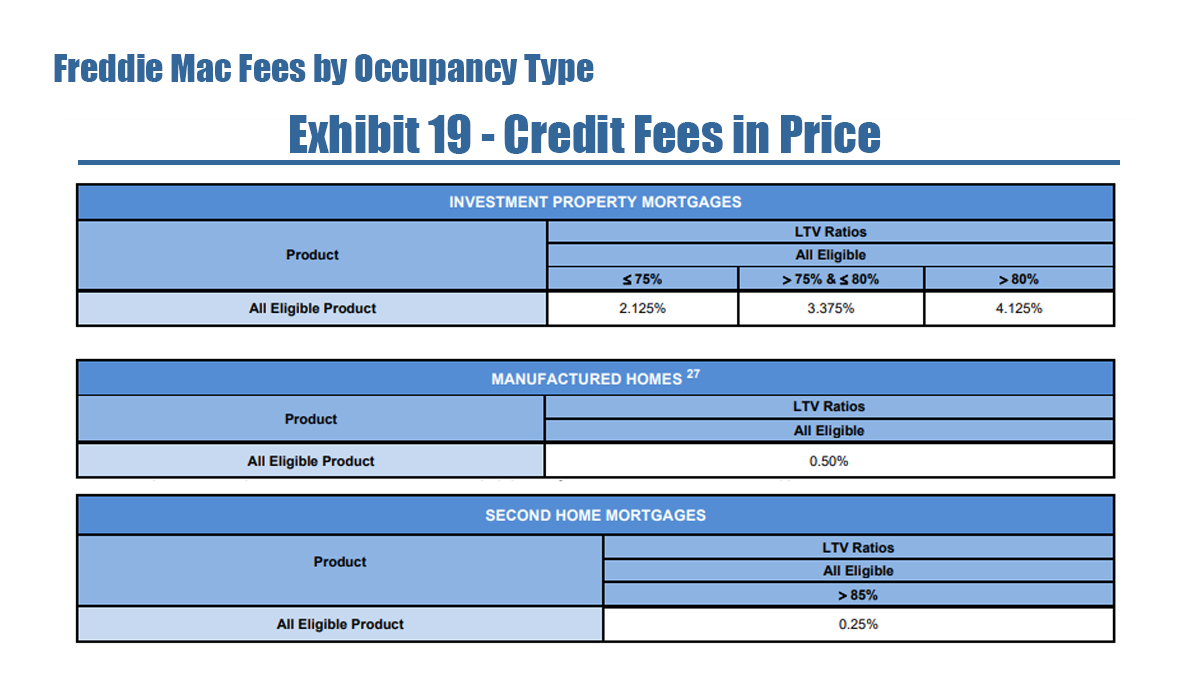 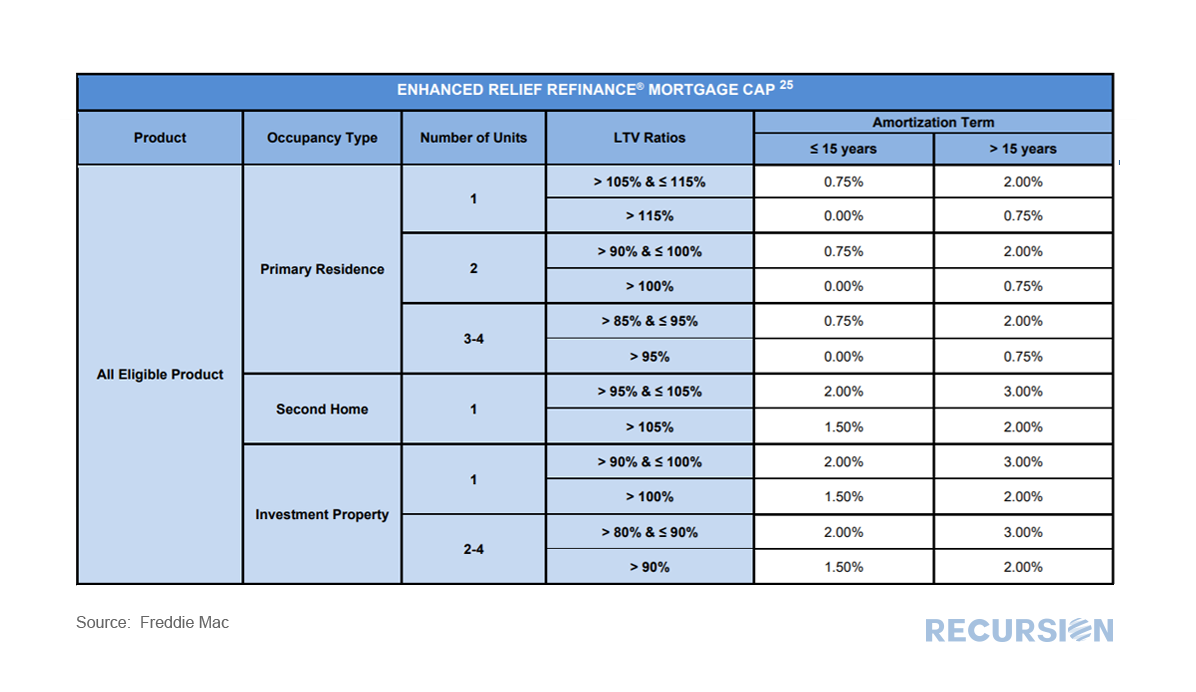 |
Archives
February 2024
Tags
All
|
 RSS Feed
RECURSION |
|

Copyright © 2022 Recursion, Co. All rights reserved.