|
The increase in the number of cashout refis has led to some concerns about the implications for the quality of household balance sheets, similar to what occurred in the run-up to the Global Financial Crisis[1]. At that time, many homeowners were tempted to use their houses as a “piggy bank” as the national savings rate hit all-time lows. In the runup to the Global Financial Crisis, the national savings rate hit a sixty-year low of 2.2% while over the 2016-2019 period the rate averaged a much healthier 7.6%[2]. It is useful to scale the magnitude of assets being cashed out and Freddie Mac releases a very useful file documenting this quarterly for their book of business back to 1994[3]. In the fourth quarter of 2020, the amount cashed out reached $48.4 billion, about 58% of the $84.0 billion peak attained in the second quarter of 2006. As a share of household net worth, the most recent data point is 3.7%, well below the peak of 12.7% reached in Q2 2006. 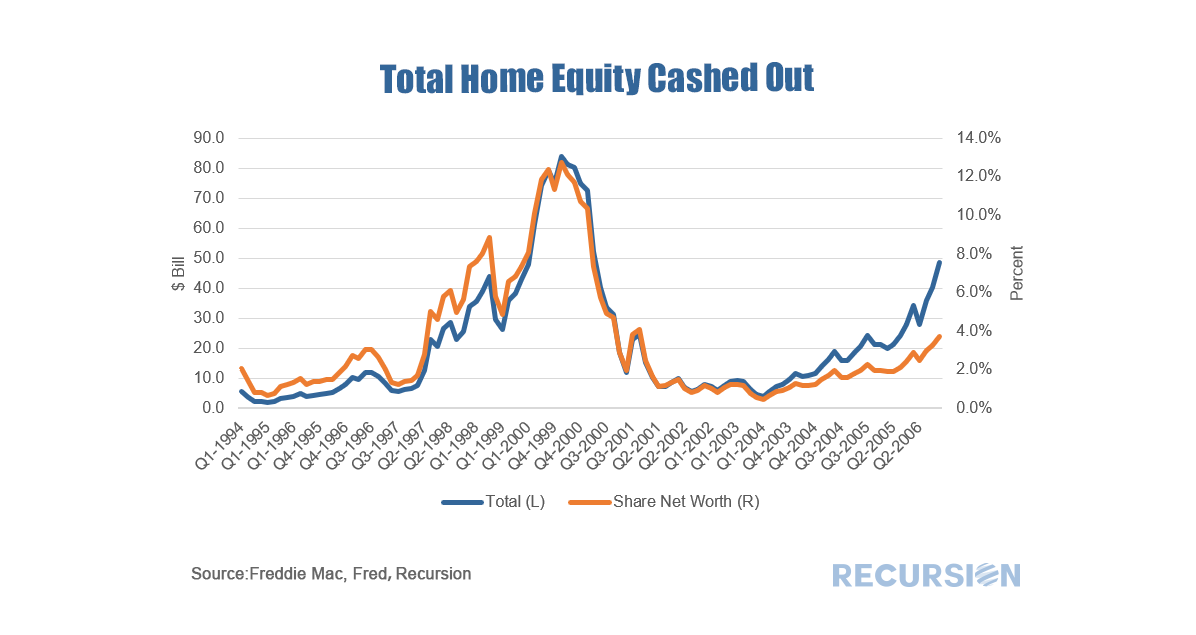 It’s useful along these lines to ask about the credit profile of cashouts compared to other refinancings. Freddie Mac didn’t report cashout refi separately until 2008 Q3, but the following useful picture can be obtained. 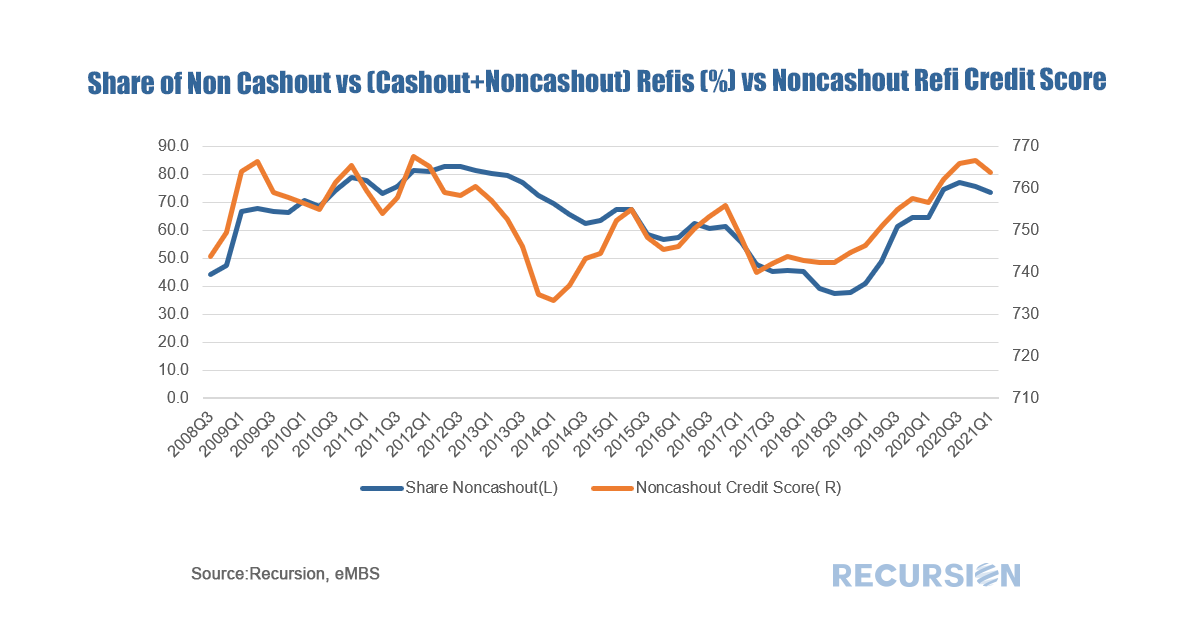 In general, lenders tend to “lean against the wind” by loosening credit conditions when demand for credit declines, and vice versa. Interestingly, it appears that the share of noncashout loans follows a pattern in which the share rises when credit in general is tightened. At the present time, the average FICO score in March for noncashouts was a tight 764, vs 753 for cashouts. It is difficult to pin the rise in equity cashouts in the current cycle to loosening credit conditions. Of course, the proof is in performance, and now that we have loan-level DQs for the GSE’s beginning last month, we can look at this broken down by loan purpose for the Freddie Mac book: 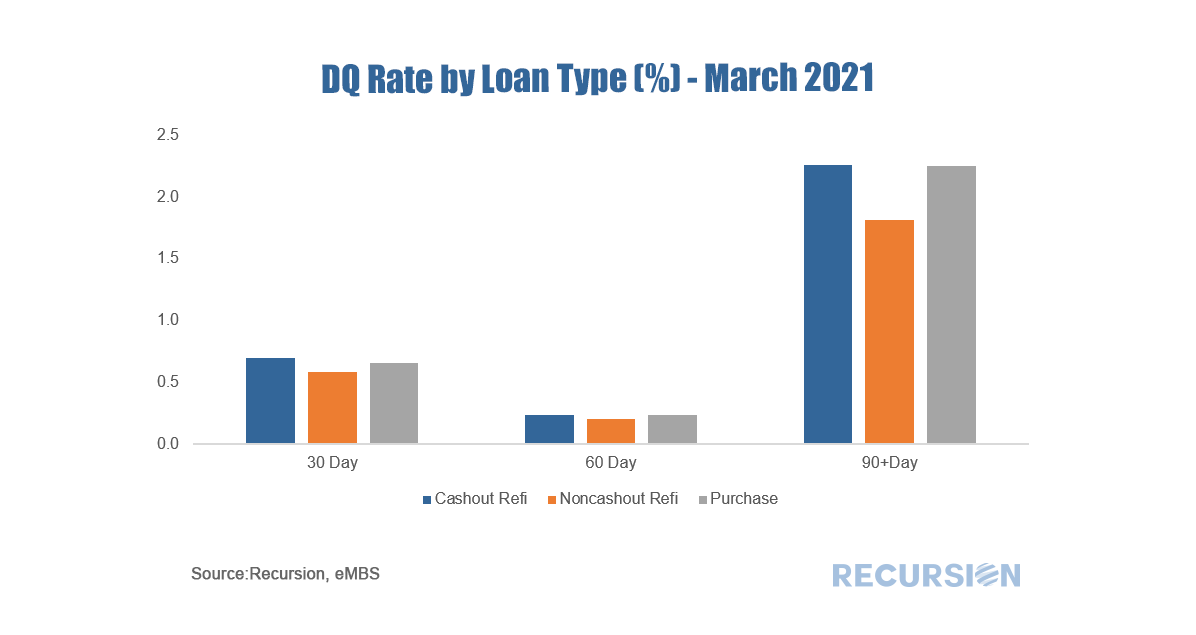 The performance of cashouts is mildly worse than that for noncashouts, but more in line with purchase mortgages. These statistics will bear watching in future months, particularly as forbearance programs begin to expire towards the end of the year. On March 30, FHA released its Quarterly Report to Congress on FHA Single-Family Mutual Mortgage Insurance Fund Programs for Q4 2020[1]. The report shows that the MMI fund grew to $82.3 billion from $79.9 billion the prior quarter. However, the year-to-date actual net loss rate on claim activity of 35.2% is higher than the projection of 30.1% percent, as the portfolio-level serious delinquency rate increased in the quarter to 11.9%, from 11.6% percent last quarter. Consequently, Secretary Fudge in a statement indicated stated that “Given the current FHA delinquency crisis and our duty to manage risks and the overall health of the fund, we have no near-term plans to change FHA’s mortgage insurance premium pricing.”[2] As we have noted previously, the Covid-19 crisis is very distinct from the Global Financial Crisis (GFC) insofar as while both periods experienced high delinquency rates, house prices now are soaring as opposed to collapsing in the earlier crisis. 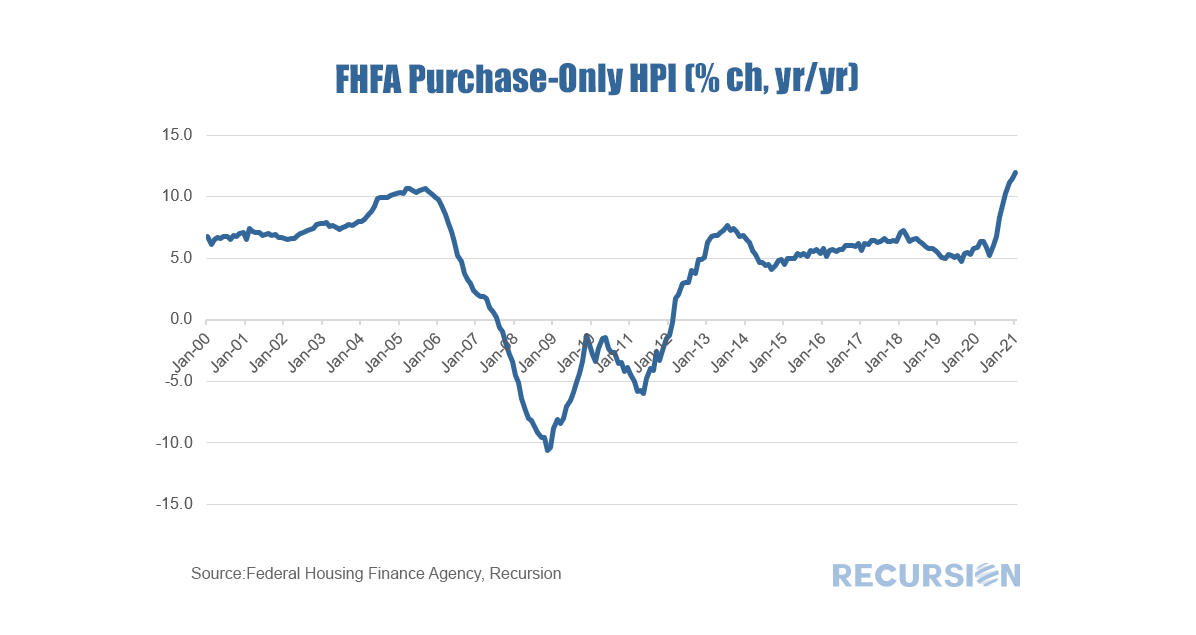 In a recent post, we discussed the relative performance of loans with property inspection waivers vs those with traditional appraisals that qualified for a waiver[1]. We commented that the observed out-performance of loans with waivers as measured by lower total delinquency rates (DQs) was likely influenced by relatively tighter lending standards (eg higher credit scores, lower DTI) for these loans compared to eligible loans that received a traditional waiver. A fully rigorous examination of this issue would be an extensive undertaking outside the scope of these brief posts. But let’s do a quick example as a demonstration of what our tools can produce along these lines. To make for an apple-to-apple comparison, below find two grids containing the difference between the total delinquency rates for purchase loans with PIWs compared to those that are eligible but obtain a traditional appraisal. The first is for loans originated in 2019 and the second is for those originated in 2020:  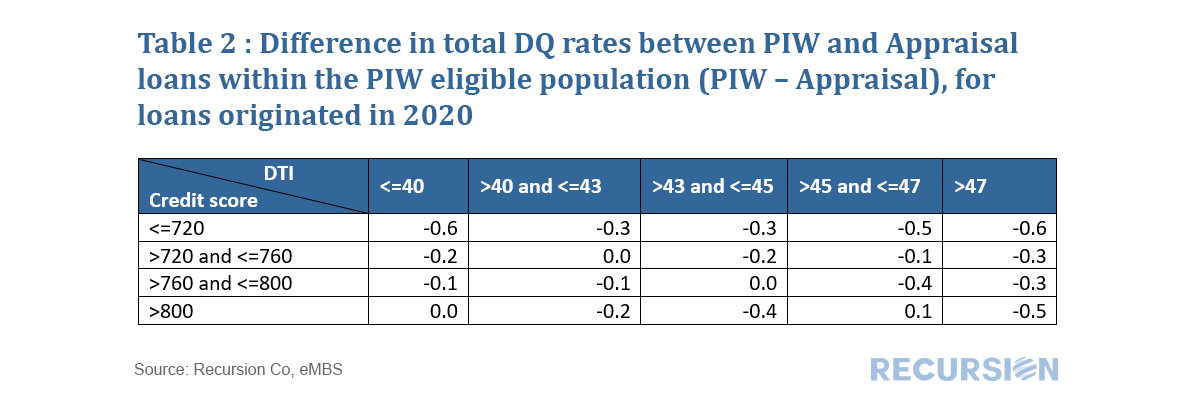 We find that PIW’s are more extensively used in 2020 than in 2019. In addition, in 2019 the range of PIW takeup across cells was 8%-13%, while for 2020 it was 14%-28%. In both cases, takeup tends to rise with credit score. Lenders appear to be more willing to allow a waiver for borrowers with better credit. 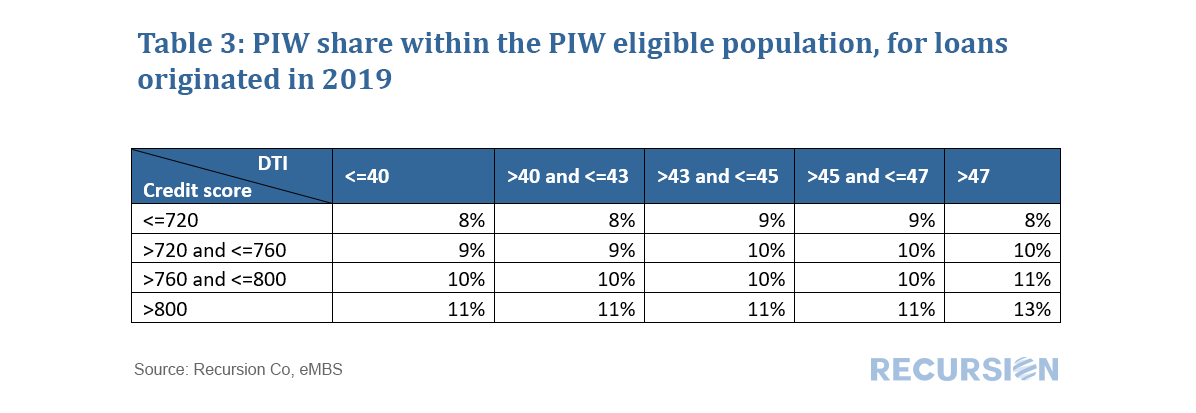 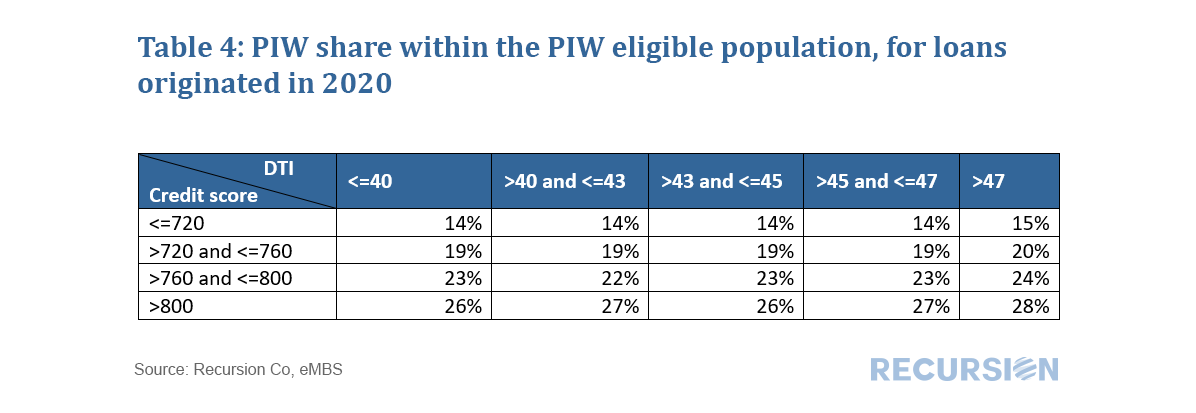 For 2019, there are a number of outliers, but there is no clear pattern across the grid. Many lenders were just beginning to implement their waiver programs that year. By 2020, PIWs became a standard part of the toolkit. For most of the center of the grid, loans with waivers very slightly outperform those eligible loans using appraisals. Bigger outperformance can be seen, however, along the edges, i.e. loans with credit scores less than 720, and DTIs greater than 47. It appears it is not the waiver itself that leads to outperformance, but likely that underwriters are more careful and pay more attention in general to these riskier classes of loans. Further work would look at performance across the largest servicers, and by state. In a recent post, we discussed our comment letter to FHFA regarding policies and procedures related to property inspection wavers (PIWs)[1]. In that note we commented that one of the best ways to assess the impact of the program is to look at the performance of loans with appraisal waivers vs those eligible to obtain waivers but did not. At the time the note was posted (late February 2021) the loan-level data needed to perform such a calculation was not available, so we used a sample obtained from the reference loans in the pools used by the Fannie Mae Connecticut Avenue Security (CAS) Credit Risk Transfer (CRT) program. Earlier this month we obtained the loan level DQ data for the books of the GSEs as of the end of February 2021 so a more comprehensive analysis is now possible. As stated in the comment letter, the eligibility rules to obtain a PIW vary by product type and agency, so to obtain an apples-to-apples comparison we need to look at the performance of loans with waivers against those that are eligible to use them but did not, as opposed to all loans. Since waivers are generally a recent development, we look at performance for loans originated in 2019 and 2020. 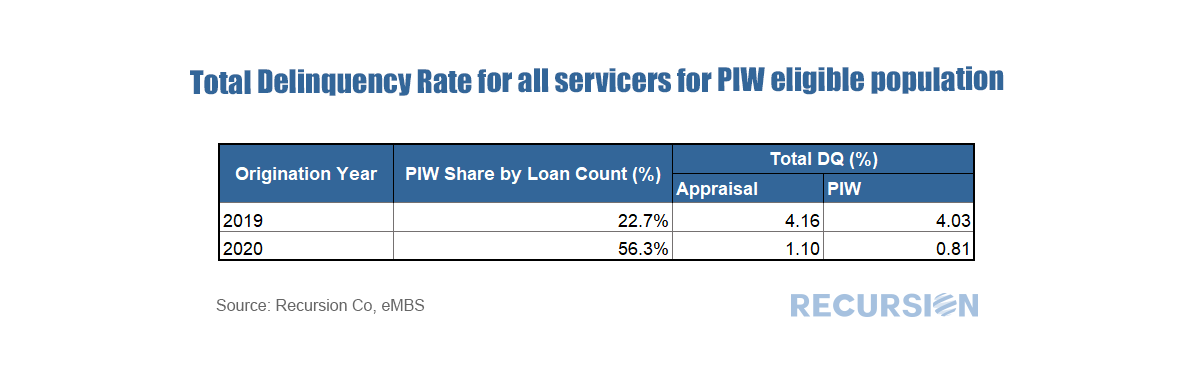 The release of loan-level dq data by the GSEs opens the door for much new analysis. In today’s blog we will look at servicer type. Below find a table of average DQ’s for each available type, along with average levels of underwriting characteristics: 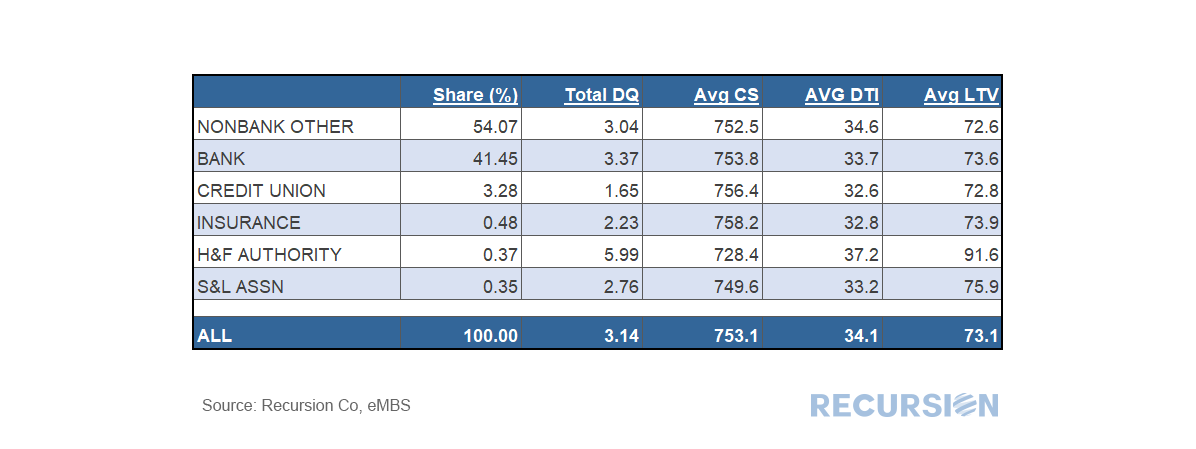 It’s interesting to note that banks tend to service loans with a modestly higher total DQ rate than the “Nonbank Other” category. The table also shows that banks have a tighter credit box with respect to credit score (higher) and DTI (lower) than nonbanks but have a more generous appetite for higher LTV loans. The data also presents financial analysts and strategists with a great deal of information about the performance of individual institutions. As an example, we look at the 100 largest servicers from the bank and “nonbank other” category (known as “nonbanks” from now on). There are 43 banks and 57 nonbanks in this group. The charts below plot total DQ’s vs credit score and DTI for each servicer type. Comparing different points or a single point vs trend lines can provide useful insights regarding the competitive landscape. 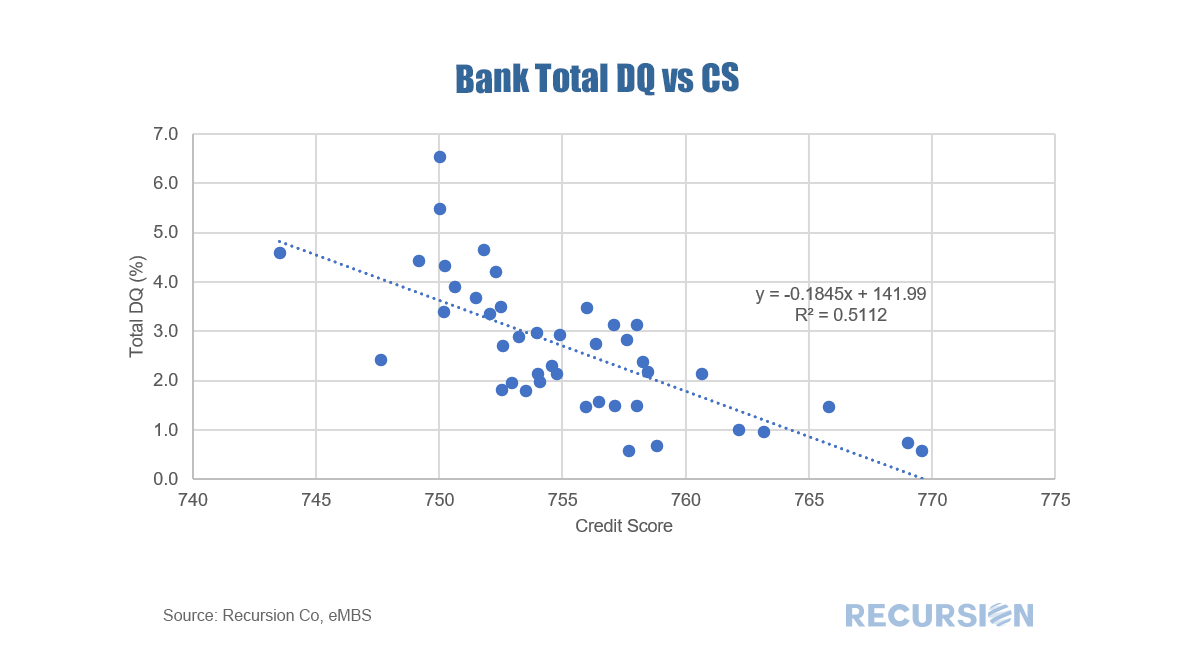 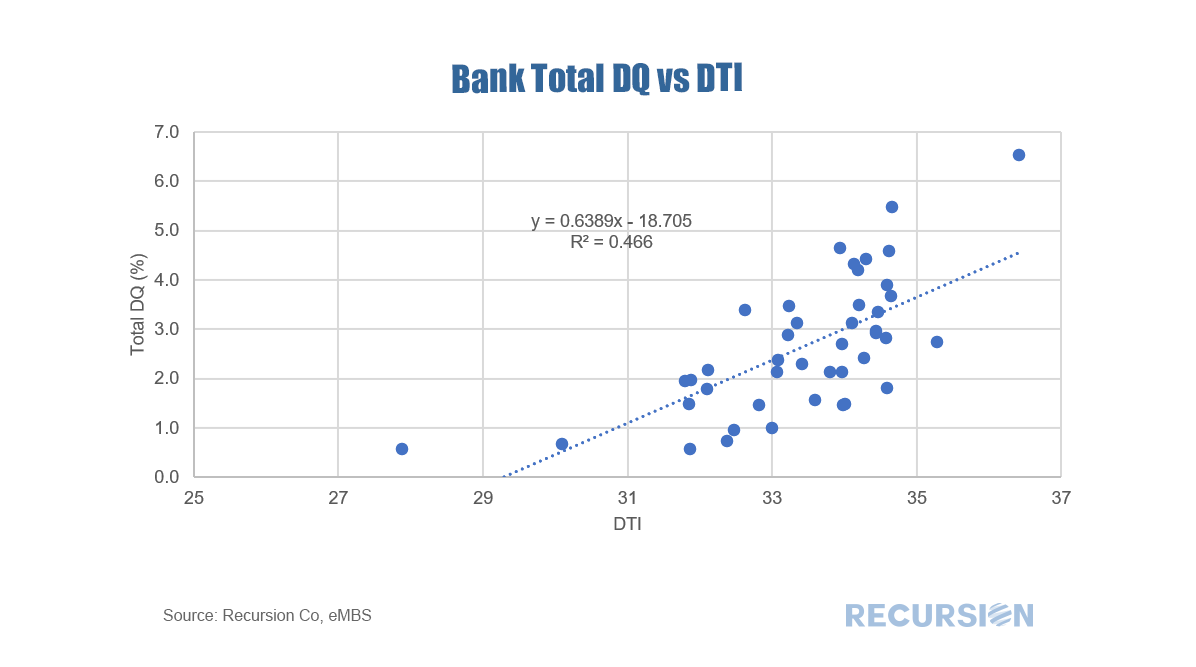 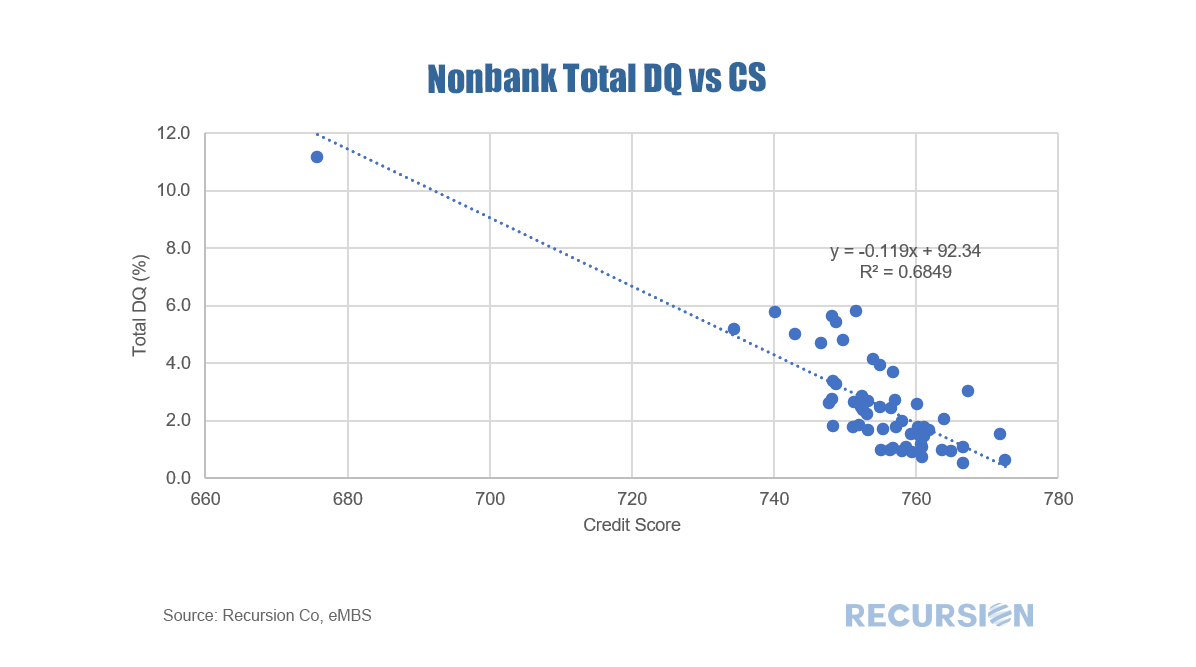 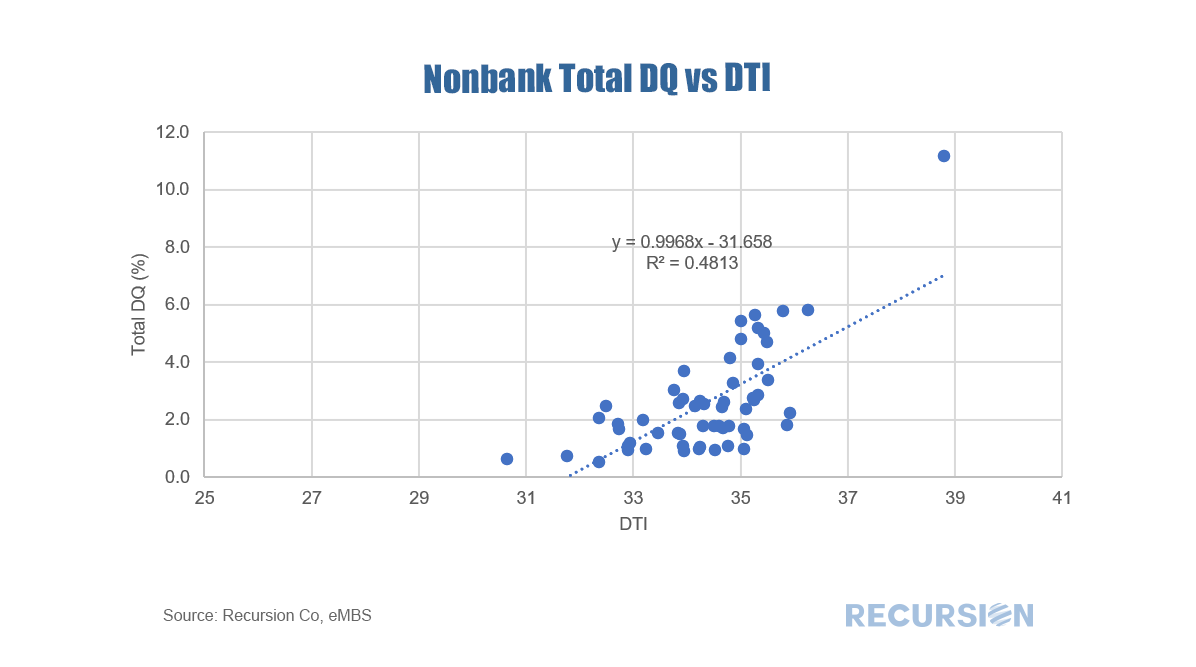 Of course, these charts just scratch the surface of what is possible here.
With the release of GSE DQ data for the first time late last week, we can start to slice and dice the information in a myriad of ways. Let’s look first at total DQ’s for the GSEs by state: 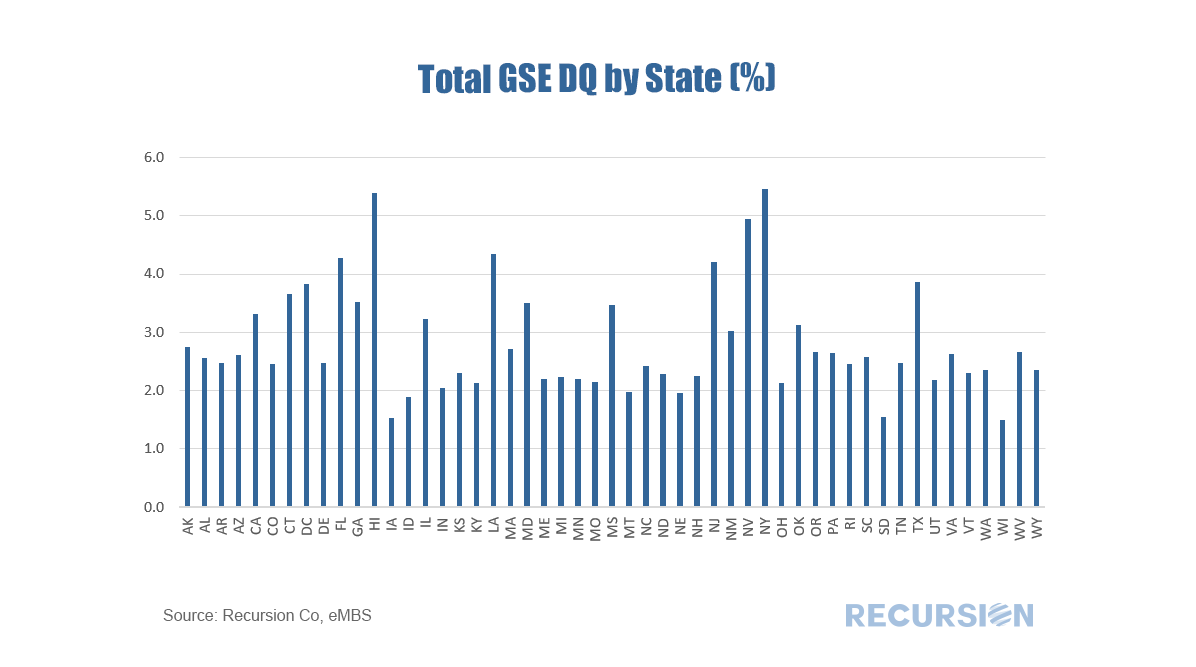 Our last post demonstrated that Fannie Mae performance at the pool level has been lagging that of Freddie Mac since the start of the pandemic[1]. The question remains as to why. The challenge in answering this question is that unlike the case for Ginnie Mae programs, Fannie Mae and Freddie Mac have not been releasing performance data on the loan level[2]. Those who subscribe to our monthly risk reports know that we have been tracking relative underwriting standards between the two mortgage giants for some time. We do this not by looking at the average levels of underwriting characteristics, but rather at looking at the tails of these characteristics. Our experience is that this is a far superior method for this as distinct policy about risk come in much clearer this way. We focus on the share of GSE deliveries with LTV>95, DTI>45, and credit score<680. 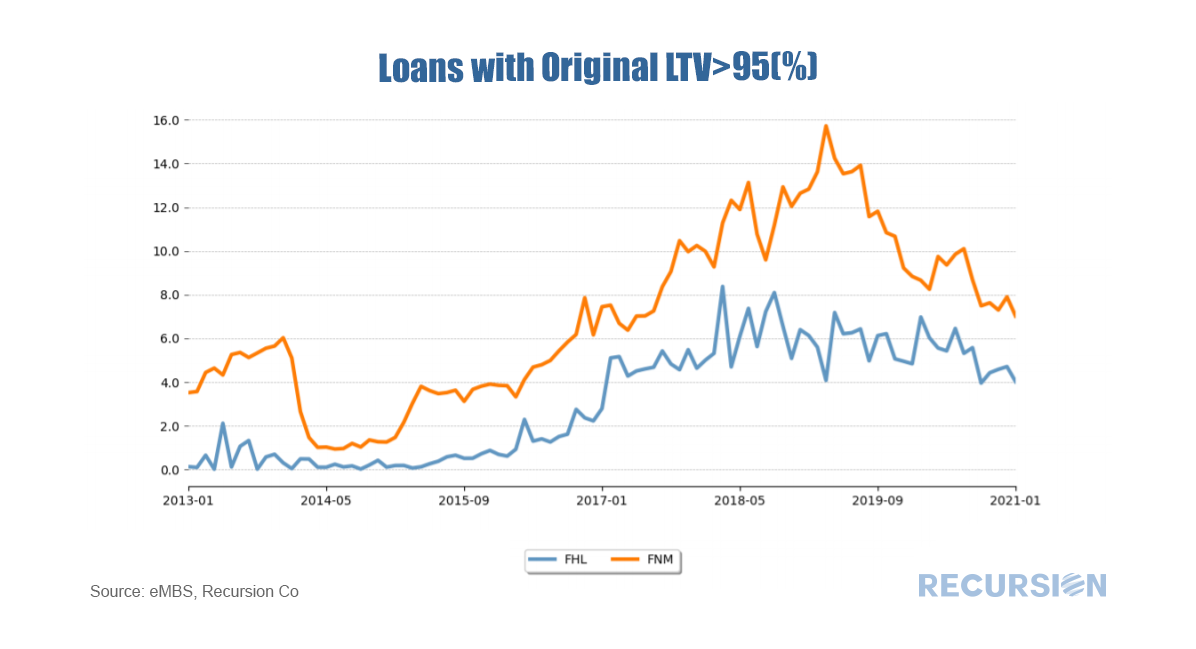 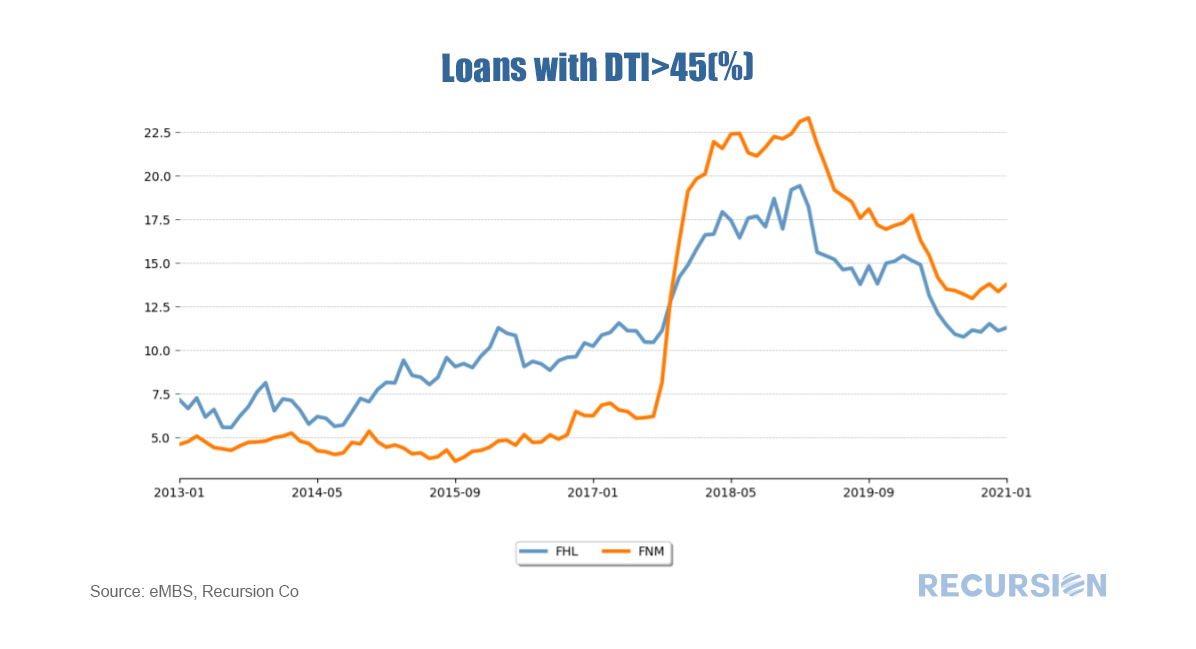 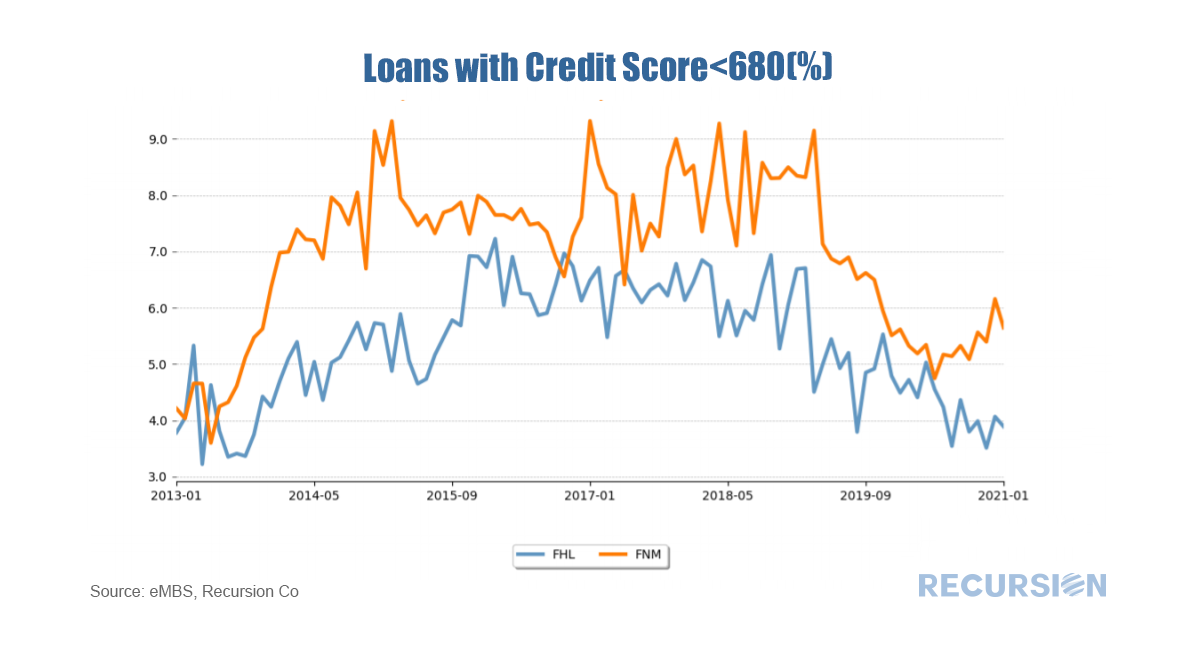 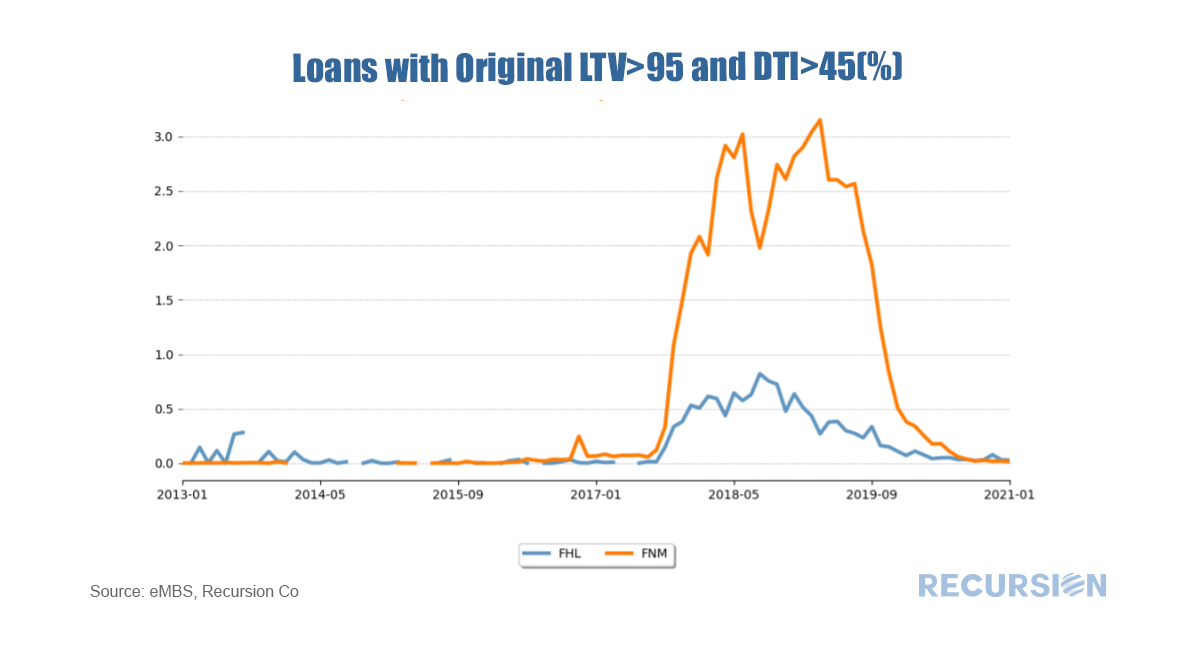 Data released last evening showed that total delinquencies for loans in Fannie Mae pools were unchanged in February at 3.6% in February, the first month that the rate did not decline since the Covid-19 Pandemic struck last spring. Notably, the same rate for Freddie Mac pools declined by 0.2% to 2.9%, the low reached since April 2020. 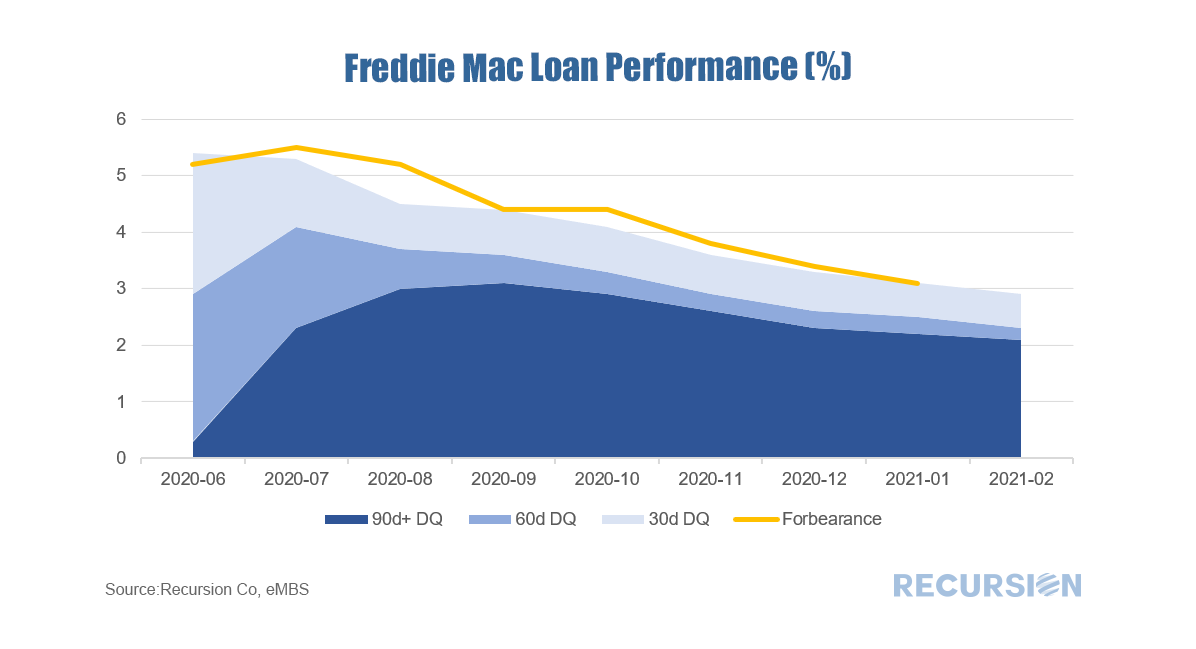 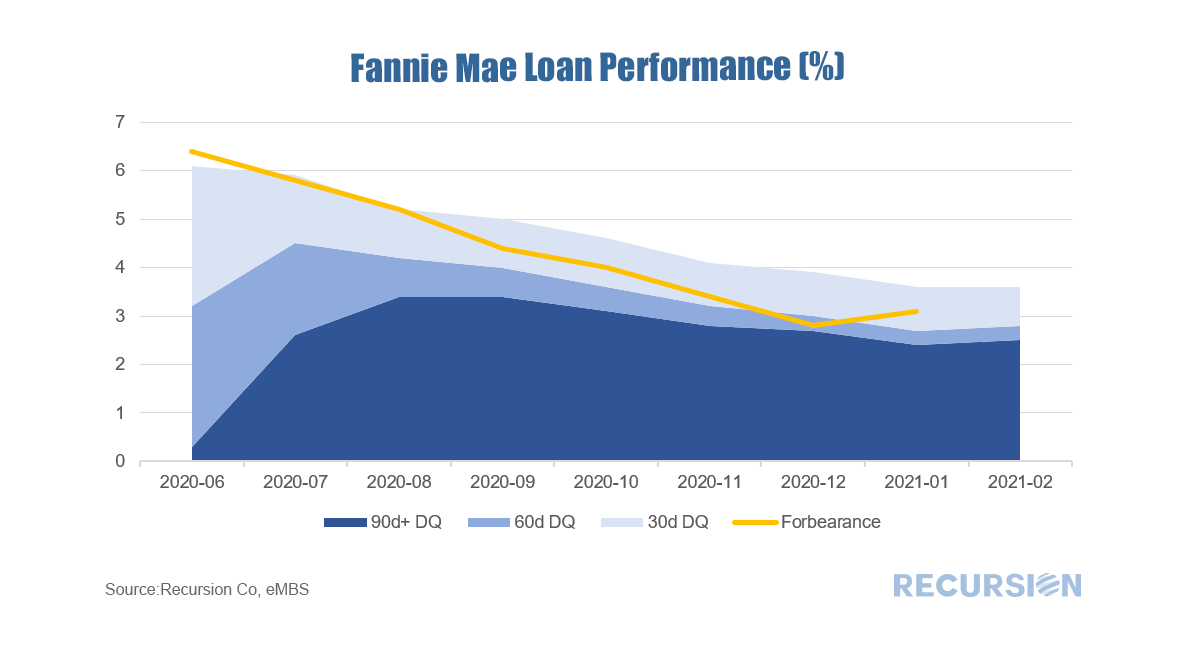 |
Archives
February 2024
Tags
All
|
 RSS Feed
RECURSION |
|

Copyright © 2022 Recursion, Co. All rights reserved.