|
Recursion analysis of trends in short-term delinquencies of Ginnie Mae programs was highlighted in a recent article in National Mortgage News entitled "High-risk defaults could be 'canary in the coal mine' for mortgage market". "The rate of early payment defaults — defined as at least two missed payments within the first six months of a mortgage — has doubled during the past year for borrowers of Federal Housing Administration-backed loans, according to data from the mortgage-analytics firm Recursion." The article goes on to quote our analysis that this trend is notable for lower credit score articles in the FHA program. This has occurred in a period of robust job market, raising the issue that delinquencies may rise further if the recent hike in interest rates by the Federal Reserve results in stalled growth or a recession. Again, more market participants are turning to Recursion to obtain the most up-to-date insights into mortgage market trends.  The article can be found here. (Subscription may be required)
For more information, please reach out to inquiry@recursionco.com. In a recent post, we discussed the utility of the FHA Performance dataset in tracking borrower stress in the housing market[1]. Here we look at other interesting market perspectives that can be obtained from this release. First, we look at property type. This breakdown is not available in the GNM loan-level disclosures, so this is a new view. Here we have 30-day DQ rates broken down over five categories: 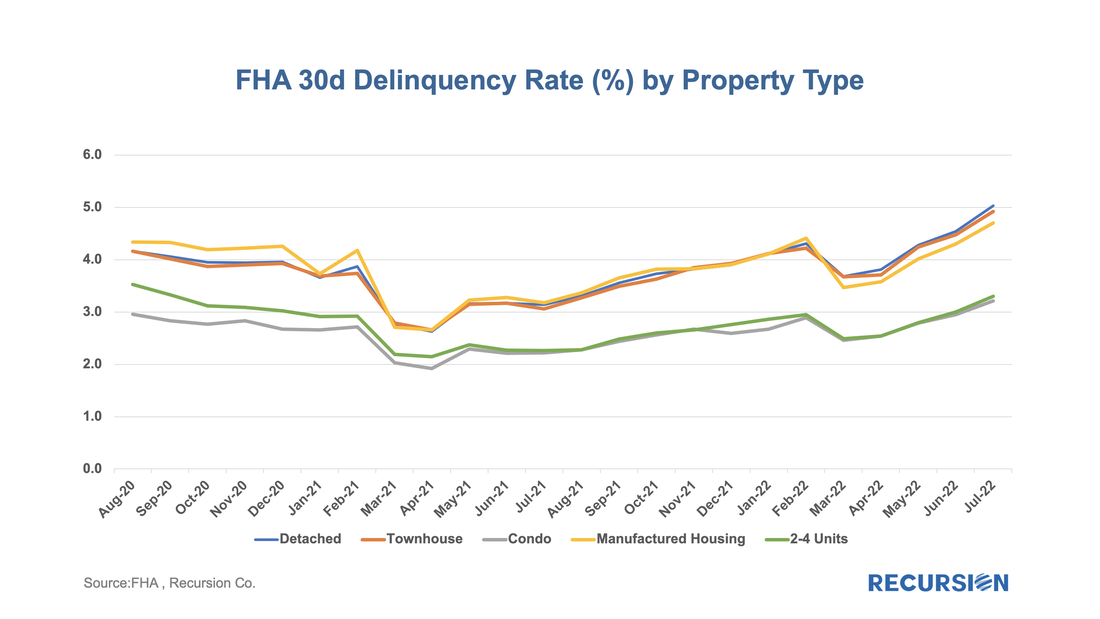 We recently wrote about the increase in short-dated delinquencies in FHA pools relative to loans in conforming pools[1]. We took this as a sign of the disproportionate impact that inflation has on lower-income households. This is a useful observation, but it is limited by the lack of visibility on delinquencies of three-month duration or longer as these loans are often bought out of pools. To address this gap, we recently imported the FHA performance data. This data is not available at the loan level, but the aggregate characteristics are informative. 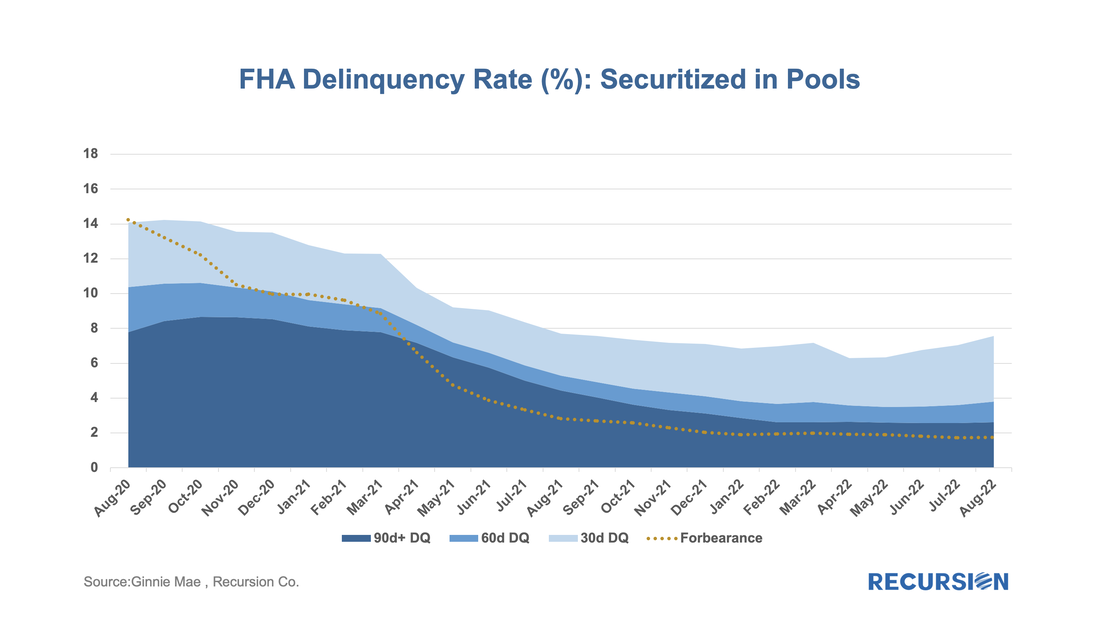 There has been a modest but persistent widening of the gap in 1-month DQ rates between the Ginnie Mae programs and the GSEs over the past couple of years. Previously, our experience was that these are mostly driven by developments in the labor market[1]. In fact, there has been a recent small but persistent rise in the number of initial jobless claims that correlates with this widening: 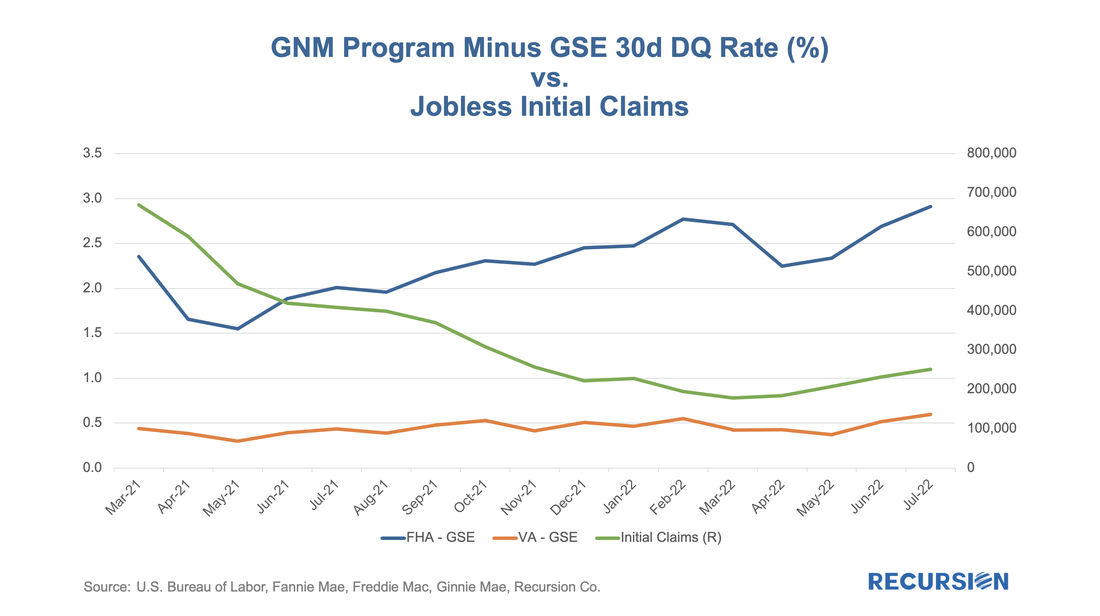 In an earlier post, we discussed the use of trial modifications as a leading indicator of buyouts, as loans in these programs must experience three months of successful payments prior to being eligible for a permanent mod[1]. On January 25, Fannie Mae announced that they had purchased certain loans out of pools prior to the completion of the necessary trial payments.[2] Then, on March 25, Fannie published a list of these securities, allowing us to quantify the impact of this event on the performance of their pools[3]. The spreadsheet attached to the March announcement contains over 17,800 entries dating back to February 2021 and states that the total unpaid balance bought out early amounted to over $4.5 billion. The point of this post is to assess the magnitude of this activity on Fannie Mae’s prepayment speeds. To address this question, we imported the data in the file released by Fannie Mae into our Recursion Pool Analyzer. As a first step, we look at the impact of these purchases on CDR’s as the activity was clearly involuntary. 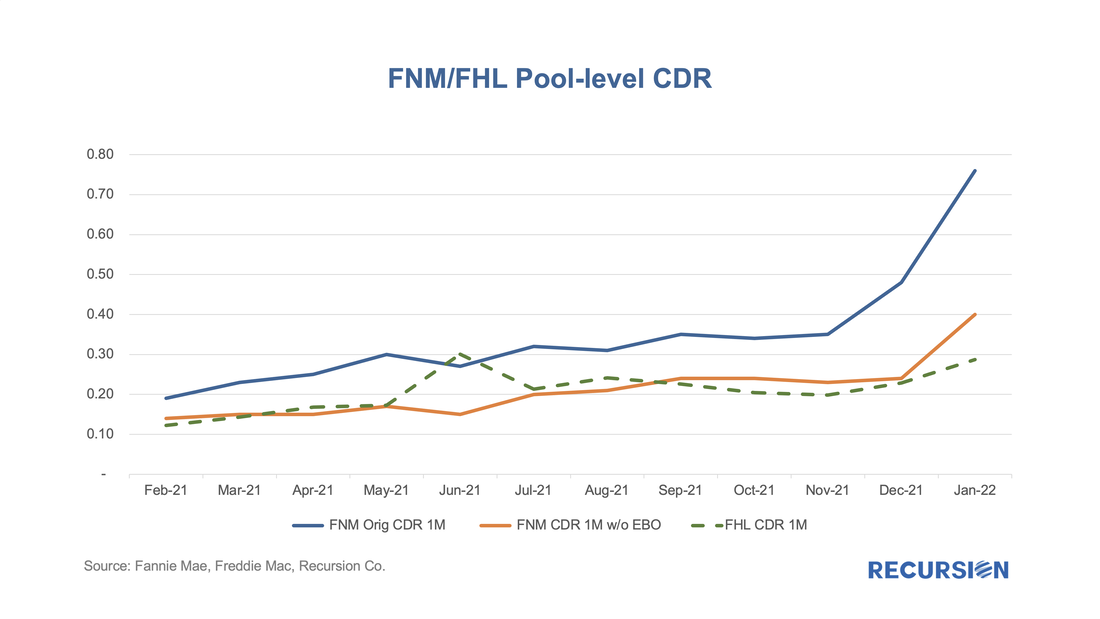 In a recent post, we discussed the utility of secondary market indicators to track the progression of loans that are coming out of forbearance in Government programs[1]. This short note looks at this progression in the conforming loan market. For the Ginnie Mae programs, issuers may buy loans out of pools after they are delinquent more than 90 days and begin a workout process that culminates in one of the options, including loan modification. The situation is quite a bit different for Fannie Mae and Freddie Mac. The main distinction is that on January 1, 2021, the GSEs extended their timeline for buying loans out of pools to 24 consecutive months of missed payments[2]. As the Covid-19 pandemic began in March 2020, we expect to see buyouts being extended as much as to April and May this year. However, we can obtain a view on future loan modifications through the trial mod flag in the borrower assistance plan field in the monthly disclosures the GSEs started to release in March, 2021. In order to obtain a permanent modification, borrowers must first successfully complete a three-month trial modification plan[3]. Below find the progression in the number of loans in such plans since March 2021: 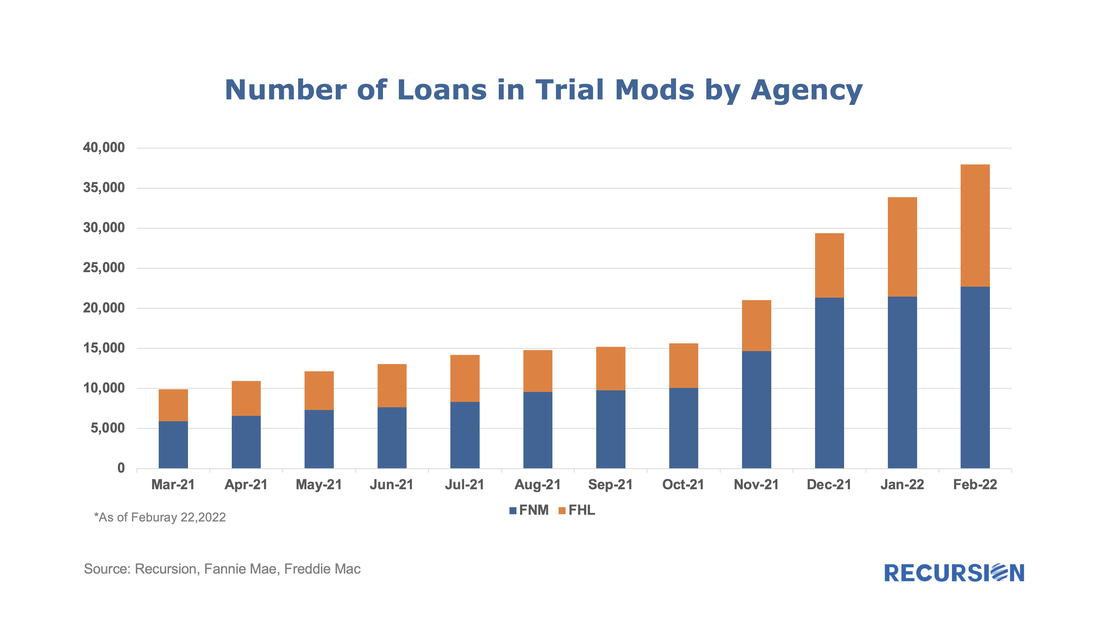 In a fine recent paper, the Federal Reserve Bank of Philadelphia “highlights the immediacy of the challenges facing mortgage servicers and policymakers” that arise from the resolution of mortgage forbearance and delinquencies[1]. As of the time of writing, the Philly Fed stated that “some 2.73 million mortgages are either in forbearance or past due; about 0.78 million of those are in Coronavirus Aid, Relief, and Economic Security (CARES) Act forbearance plans”. In addition, “about 47 percent of loans in forbearance will expire in the first quarter of 2022; another 42 percent will expire in the second quarter”. They go on to discuss recent trends and provide data on income and demographics of these borrowers.
The point of this brief article is to look at secondary market indicators to shed additional light on these issues. The note is broken into two parts, the first looks at Government programs, notably FHA and VA, while the second looks at the GSEs. On January 13, Housing Wire posted an article titled “Freedom Mortgage dominates the MSR market” in which they reported that, among other top servicers, Freedom is leading the MSR marketing. They cited Recursion data on the ranking of the Ginnie Mae top servicers/buyers as well as their loan delinquency rates to provide perspective on the MSR market. 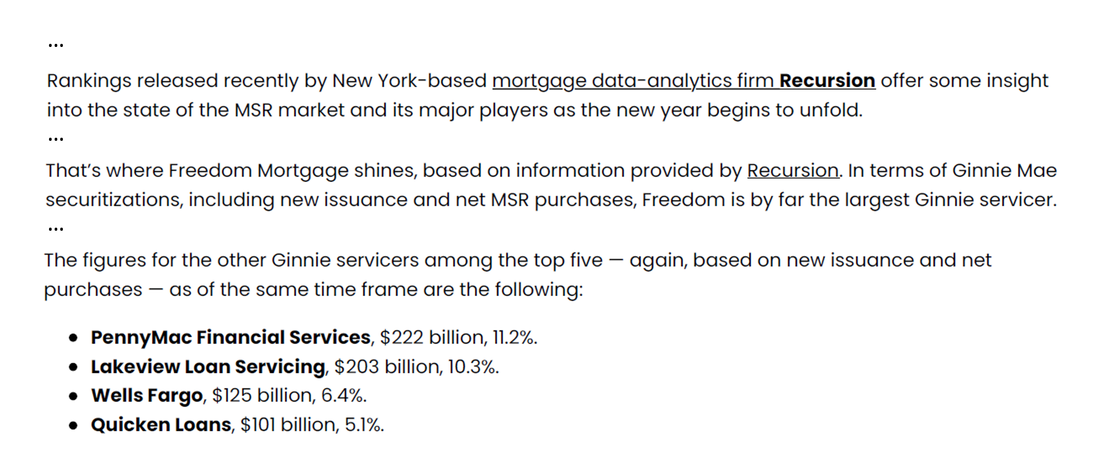 |
Archives
February 2024
Tags
All
|
 RSS Feed
RECURSION |
|

Copyright © 2022 Recursion, Co. All rights reserved.