|
The millennial generation has reached peak home buying age, covering a range of about 25-40 years old. Just this year this cohort at 72.1 million passed the baby boom generation in sheer size[1] although this is a bit less than the 78.8 million peak reached by boomers in the late 90’s[2]. Millennial presence or lack of it in the housing market has been the subject of voluminous commentary, ranging from extreme optimism derived from the magnitude of the population bulge to caution related to affordability and impediments to building savings stemming from student loan debt[3] and high rental and child care costs[4]. What can big data tell us about this? A 2018 study by the Federal Reserve showed that Millennials had lower incomes and assets and higher debt than previous cohorts at a similar age[5]. Our data sets can provide some useful, but far from conclusive, insights into these trends since the onset of the Covid-19 pandemic. Covid-19 is both a cyclical and structural shock. On the cyclical side mortgage rates have fallen to record lows as the Federal Reserve responded quickly and decisively to the health crisis. On the structural side, residents of urban areas have picked up and fled to less dense locations, resulting in a sharp increase in house prices nationally. According to Redfin these price gains have been led by those in rural and suburban areas, rendering these areas less affordable, while urban areas remain out of reach for most. 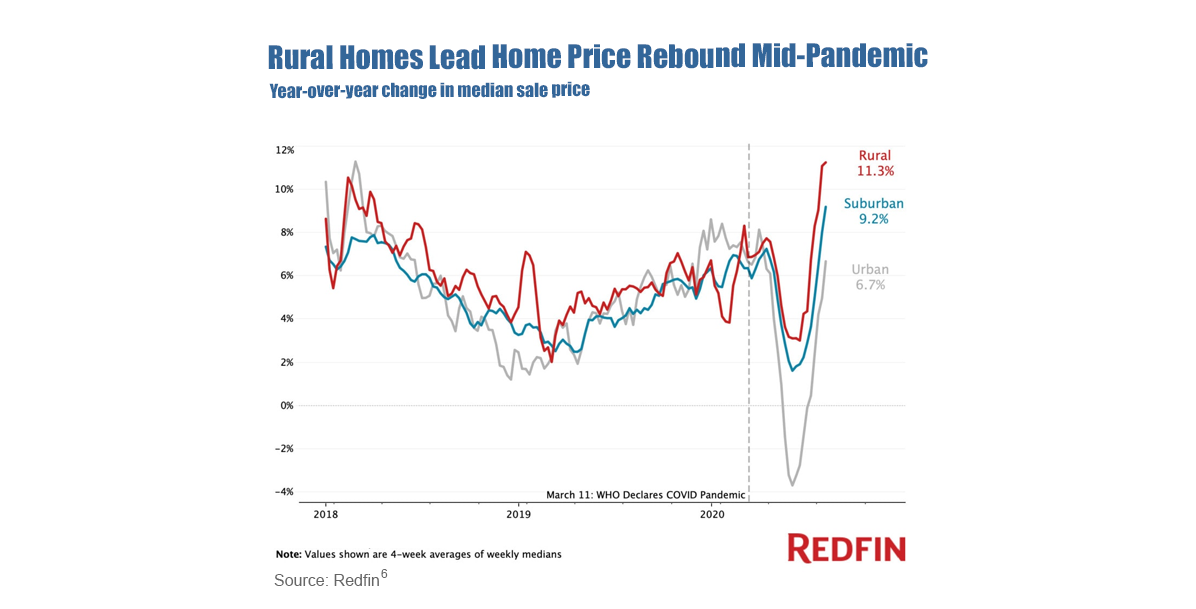 One of our ongoing themes in this blog is that we are entering a period of unremitting structural change. We’ve noted previously that the combination of Covid-19 and technological innovation is leading to a surge in the nonbank share of purchase mortgages to the GSE’s[1]. Of course, there are others, notably climate change. As the technology leader among states and also the one suffering severe damage from wildfires, California is at the nexus of these transformations. A survey conducted by the University of California at Berkeley in 2019 revealed that more than half of the residents of the state had given “some” or “serious” thought to leaving the state[2]. Has this in fact occurred? Such a desire may be offset by the traditional role of the state in attracting immigrants and young people looking for careers in technology and media. One way to look at this is to pull data for the count of new purchase mortgages sold to the GSEs in the state as a share of the US total: 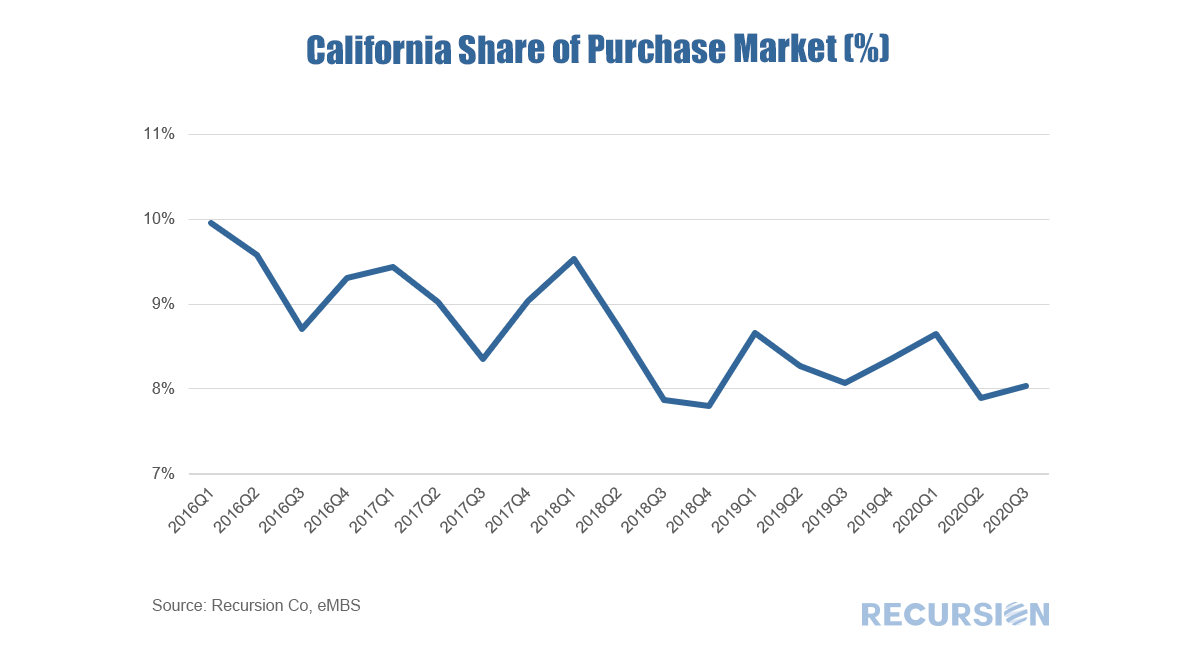 We have commented previously on the rising share of nonbank deliveries to the GSE’s in the wake of the Covid-19 crisis[1], but the data just released for the month of July shows this trend to be picking up at an astonishing pace. This time, let’s break the market up into two pieces: Purchase and Refi: 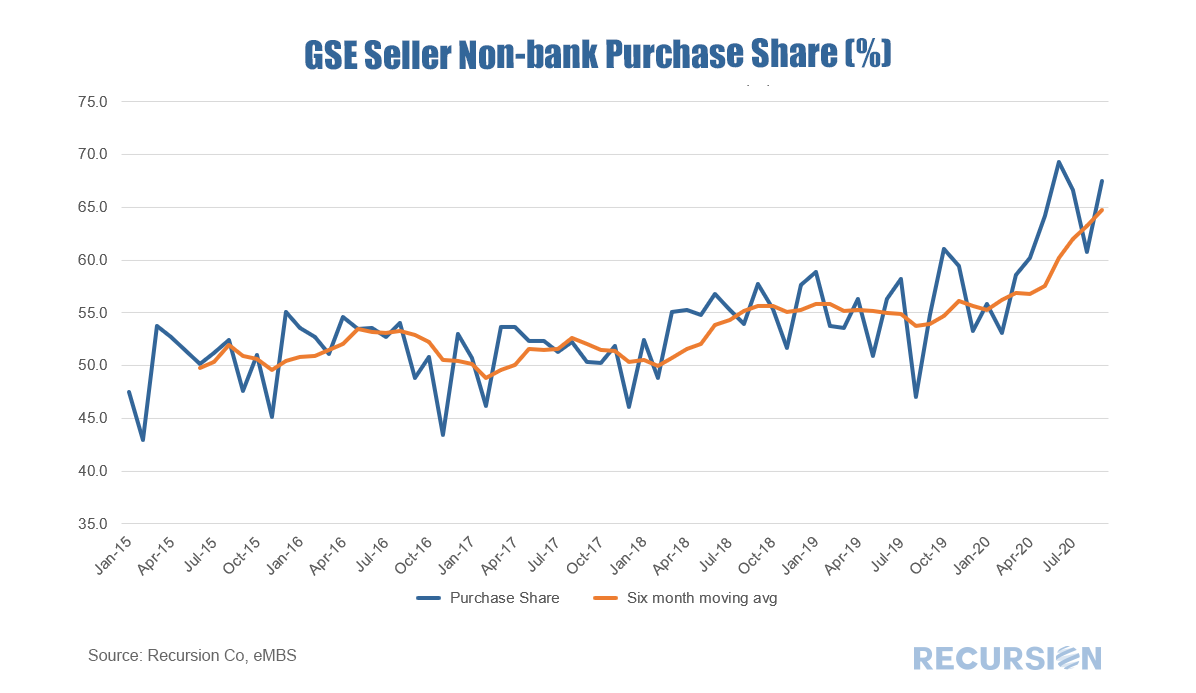 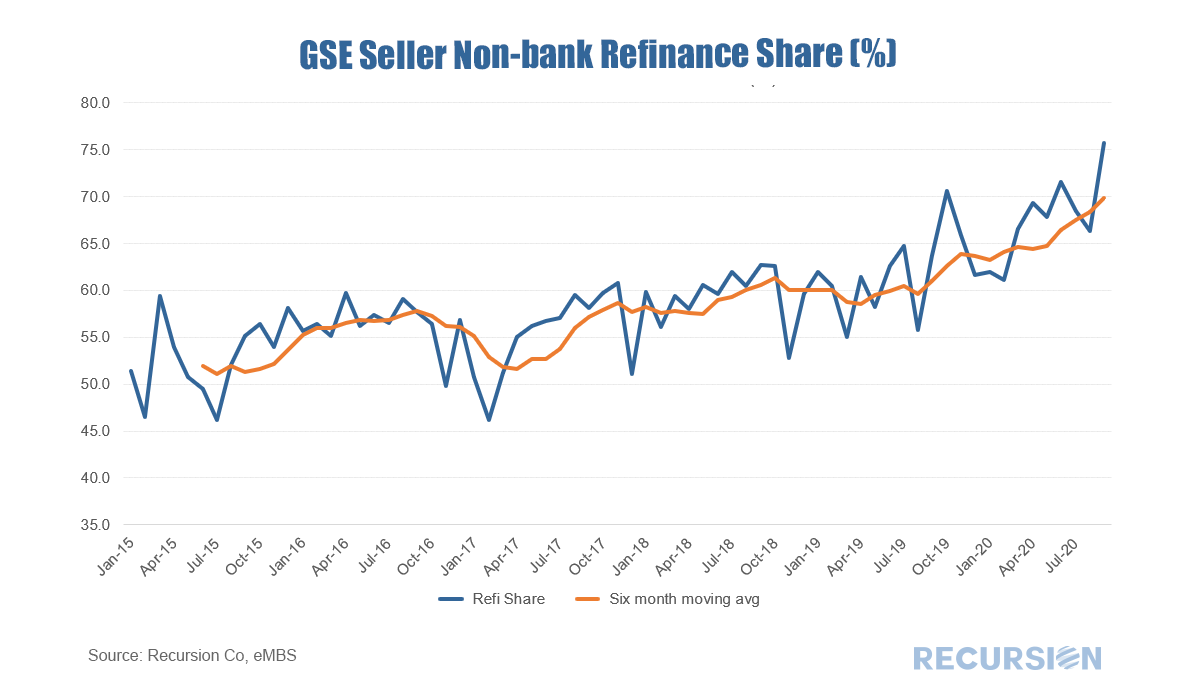 In a previous blog, we pointed out the importance of overseas investors to the mortgage market.[1] We looked at the share of holdings from this sector, as well as on the country breakdown within the sector. These shares tend to move somewhat smoothly over time as they represent very large portfolios of assets. There is, however, a second data set released in the TIC system every month, namely net capital flows. These data are purchases (or sales) and can be quite volatile in the short term. But they may provide a picture of emerging trends that will not show up in the holdings data for some time. The same important caveat that applies to the holdings data applies as well to the flow data: the data on purchases and sales of assets reported for a country may be on behalf of agents domiciled in a different location, even the US. We also noted in that post the many motivations behind foreign holdings of stocks of long-term agency assets and these apply to the flow data as well. There is another caveat for the flow data, however. A key characteristic of MBS is prepayment. That is, homeowners have the right at any time to prepay their mortgage if rates fall. Also, if a homeowner sells the home the mortgage is typically prepaid and a new mortgage obtained if a new home is purchased. So if an investor faces prepayments, but wants to hold their stock of MBS steady, they may purchase new securities. Such purchases are not based on any assessment of near-term returns in various asset classes, but is rather an automatic flow based on longer-term considerations. This phenomenon is particularly notable in an environment of falling interest rates, as prepayments would be expected to rise. An interesting group of countries to look at in this regard is Asia ex-Japan. The bulk of these holdings are maintained by official entities looking to maintain portfolio liquidity and generate favorable long-term returns. The issue of country of the beneficial owner is less important here. Yet, they are not immune to conditions in the current investment environment. The charts below show net purchases in total and for three Asian entities: China, Hong Kong and Taiwan. 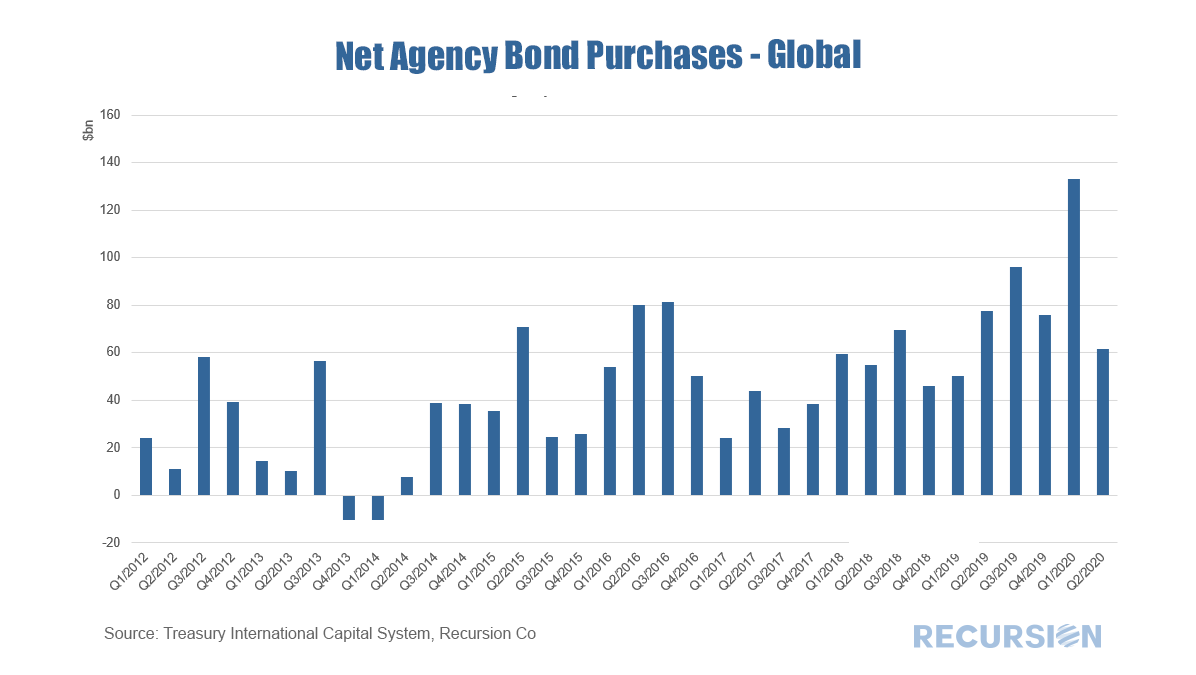 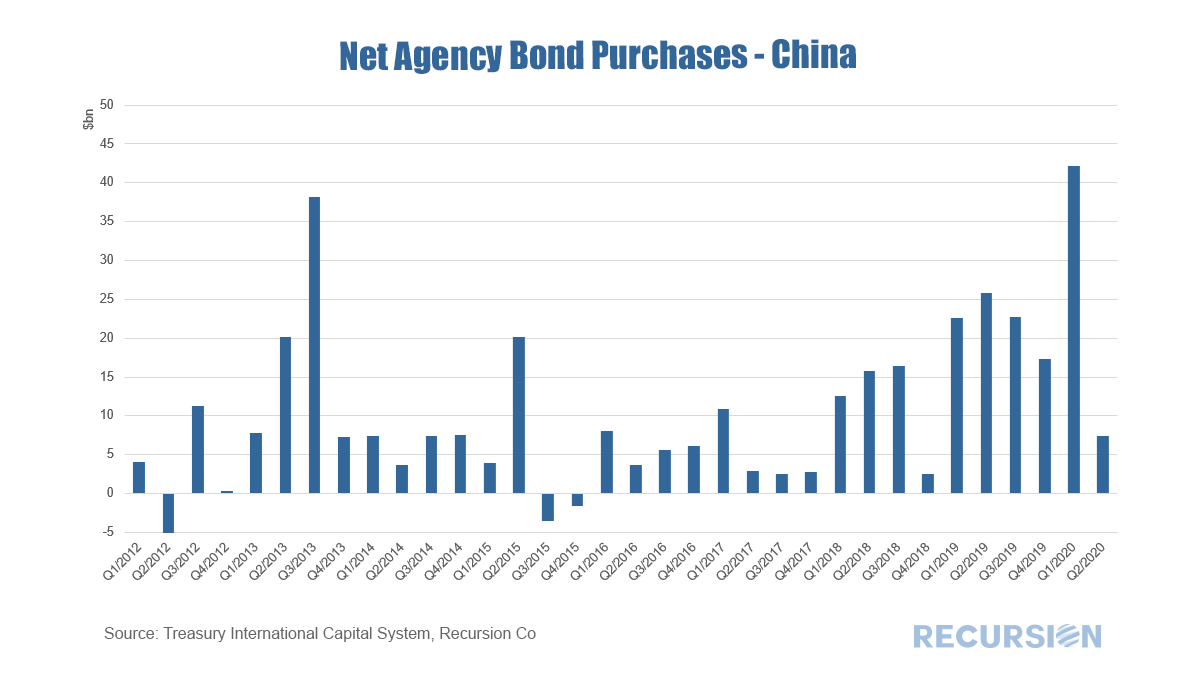 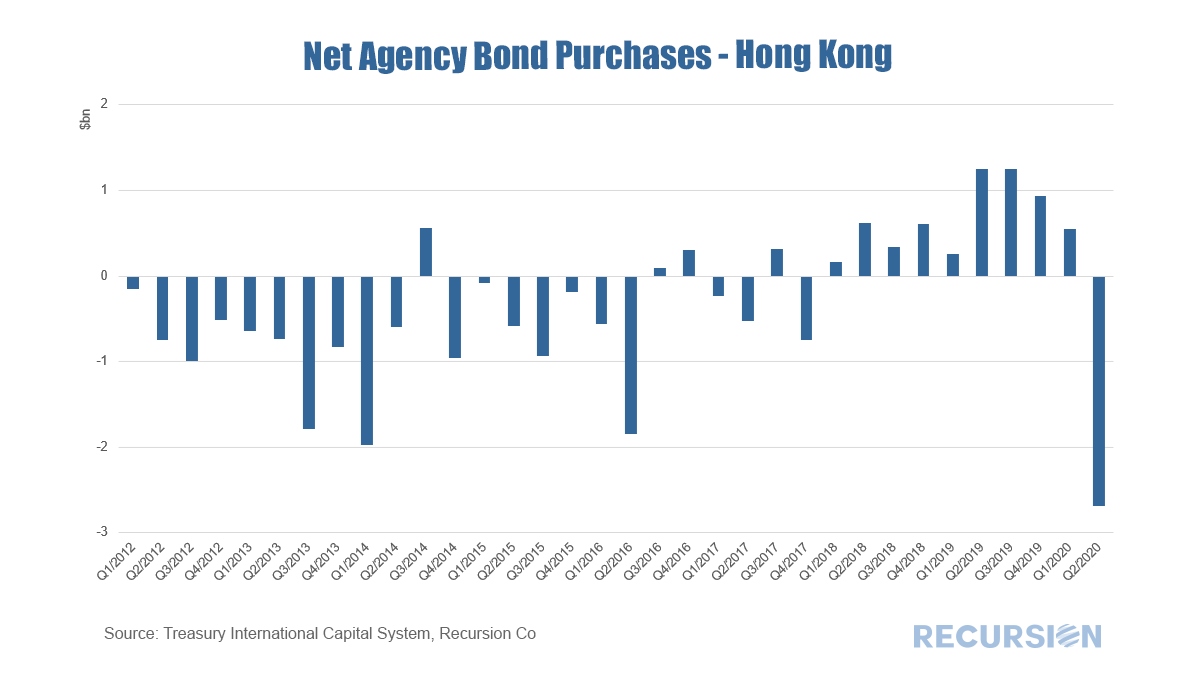 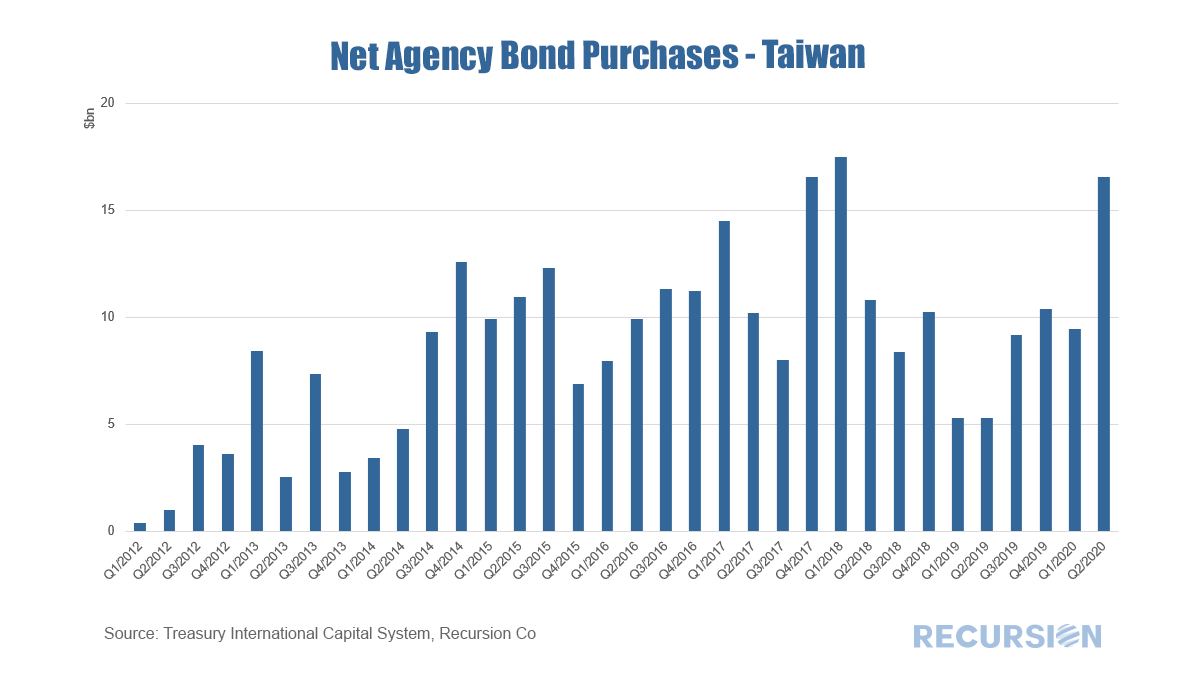 As we have been in a declining rate environment since the start of 2019, it is not surprising that purchases of long-term agency securities have been generally strong from the point of view of asset replacement over that time. But Q2 2020 marked a break in the pattern with the onset of the Covid-19 crisis. Flows were smaller than in Q1, notably so for China, but markedly so for Hong Kong which engaged in outright sales of assets. Interestingly, Taiwan bucked the trend and added substantially to its holdings in Q2 compared to the prior quarter. In the background, the economic and financial environment remains highly uncertain. Added to that is the increasing factor of rising geopolitical uncertainty as we head into the US election. Following these flows may provide useful insights into how different agents assess these considerations. In a recent post we looked at the agency composition of the recent surge in MBS production[1]. We observed that Ginnie Mae’s market share in the three months to July 2020 is significantly below that experienced in the same period a year ago. The bulk of the decline is due to a drop in the refi share, while the purchase market share experienced less than a 1% decline. There are several drivers of share for purchase market share, including program design, the coupon spread between the government and conforming sectors, and differences in the credit boxes between the two. This note looks at competitiveness through the lens of the latter factor, credit boxes. As noted in the prior post, Ginnie Mae is the securitizer for four different programs, with the two biggest being FHA and VA. VA has a fairly unique set of program requirements, so the main competition in the purchase mortgage space is between FHA and the GSEs. In the three months to July 2020 FHA lost about 2.5% of its share in the purchase mortgage space compared to the GSEs. Let’s dive into credit factors, starting with credit score: 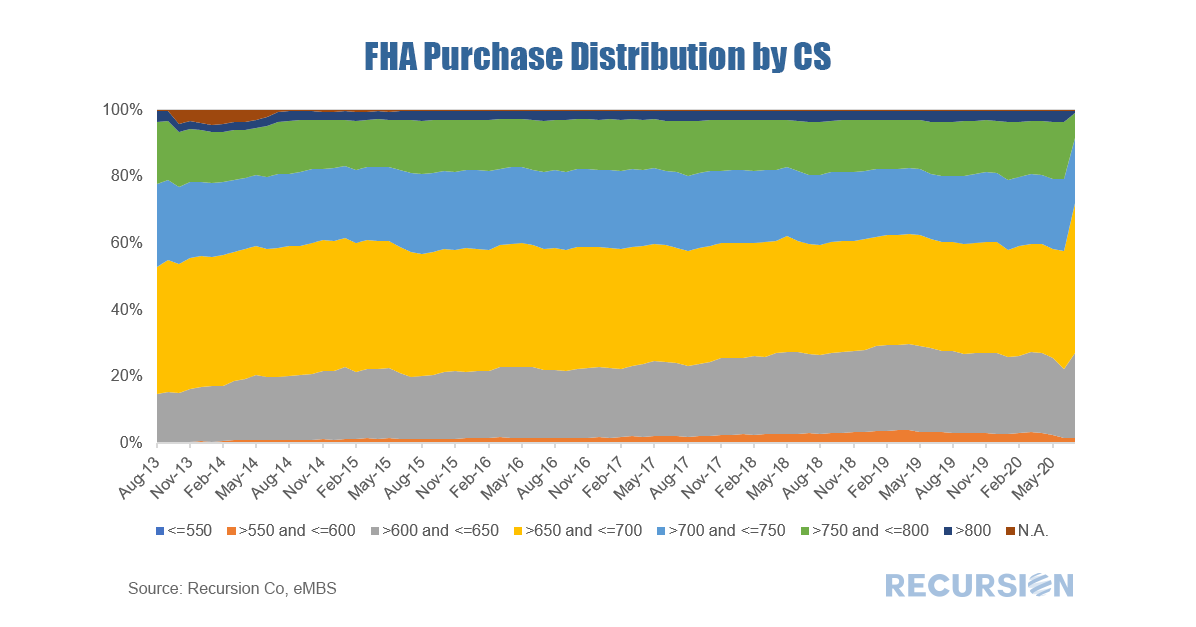 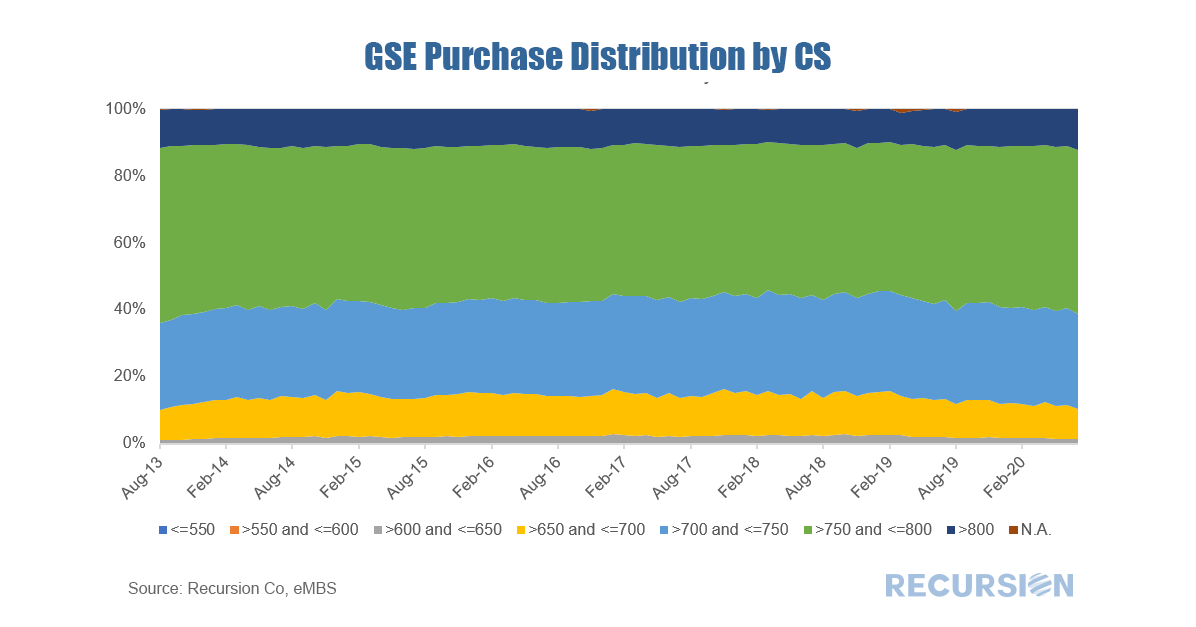 2019 HMDA data has been released and is loaded into Recursion’s HMDA Analyzer so clients can perform consistent queries back to 1990. As always, a vast wealth of information is available. Below are several high-level observations. First, total originations rose by over $700 billion compared to 2018[1], a 13-year high. The bank share fell for the eighth consecutive year, reaching a record low of 37%. This was down 1 percentage point from 2018, the smallest decline posted for 8 years. Nonetheless, banks have suffered a remarkable 30-point drop in market share since 2008. 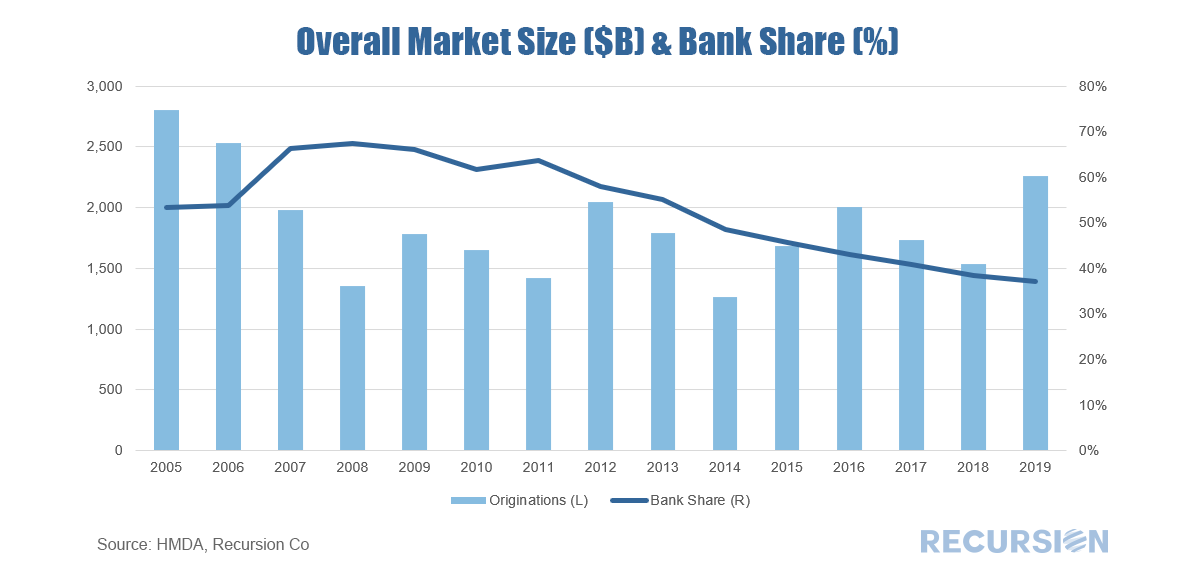 Late last month, FHFA released its purchase-only national house price index for May. This is an index of home prices associated with purchase mortgages that are delivered to the GSEs. The historical pattern is familiar. 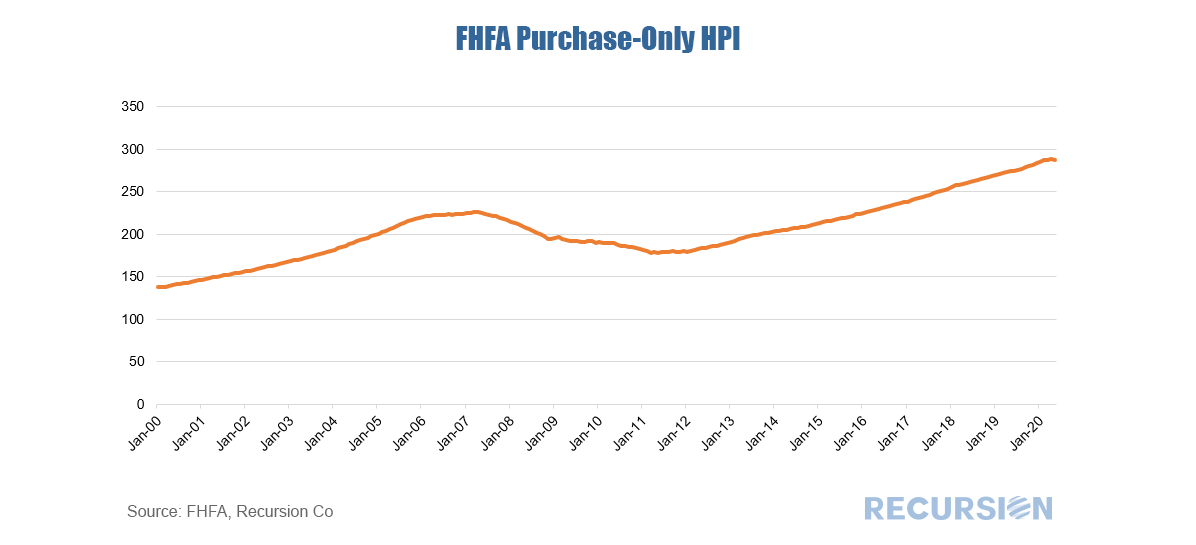 In a recent post, we noted the surge in new mortgage deliveries to a record level[1] in July. Besides this sharp increase, there is an interesting shift in the composition of these deliveries in the form of a striking decline in the government share. 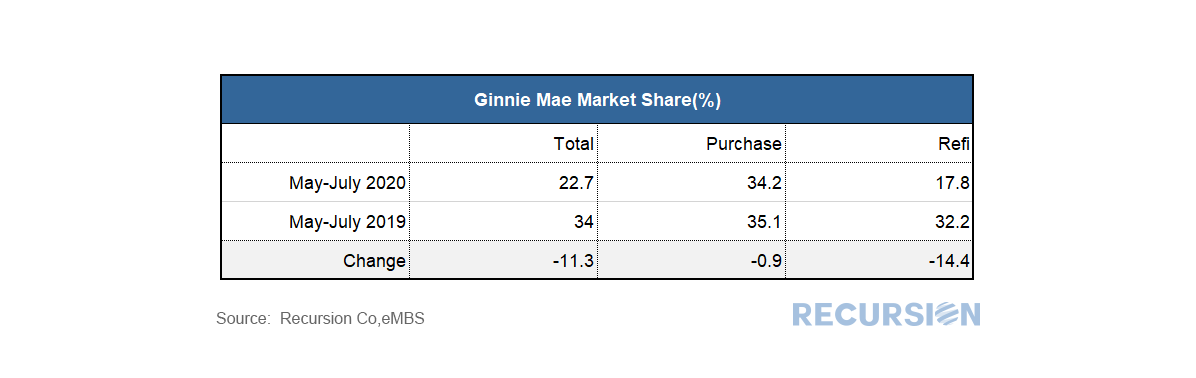 |
Archives
February 2024
Tags
All
|
 RSS Feed
RECURSION |
|

Copyright © 2022 Recursion, Co. All rights reserved.