|
The millennial generation has reached peak home buying age, covering a range of about 25-40 years old. Just this year this cohort at 72.1 million passed the baby boom generation in sheer size[1] although this is a bit less than the 78.8 million peak reached by boomers in the late 90’s[2]. Millennial presence or lack of it in the housing market has been the subject of voluminous commentary, ranging from extreme optimism derived from the magnitude of the population bulge to caution related to affordability and impediments to building savings stemming from student loan debt[3] and high rental and child care costs[4]. What can big data tell us about this? A 2018 study by the Federal Reserve showed that Millennials had lower incomes and assets and higher debt than previous cohorts at a similar age[5]. Our data sets can provide some useful, but far from conclusive, insights into these trends since the onset of the Covid-19 pandemic. Covid-19 is both a cyclical and structural shock. On the cyclical side mortgage rates have fallen to record lows as the Federal Reserve responded quickly and decisively to the health crisis. On the structural side, residents of urban areas have picked up and fled to less dense locations, resulting in a sharp increase in house prices nationally. According to Redfin these price gains have been led by those in rural and suburban areas, rendering these areas less affordable, while urban areas remain out of reach for most. 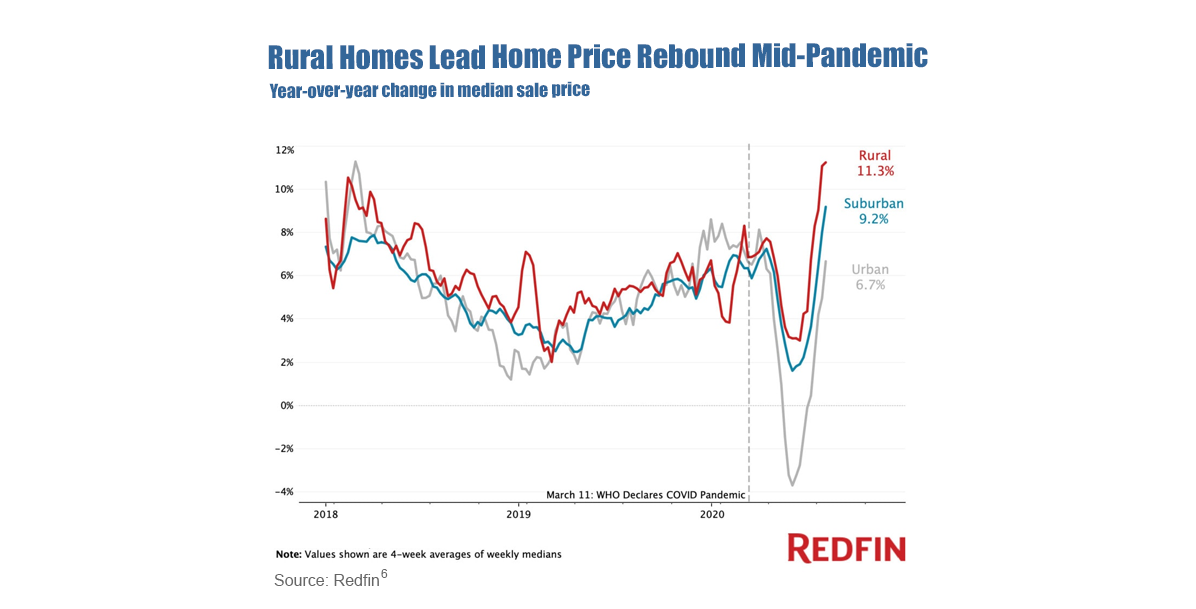 Another way to look at this is through the distribution of home prices for mortgages delivered to the agencies. 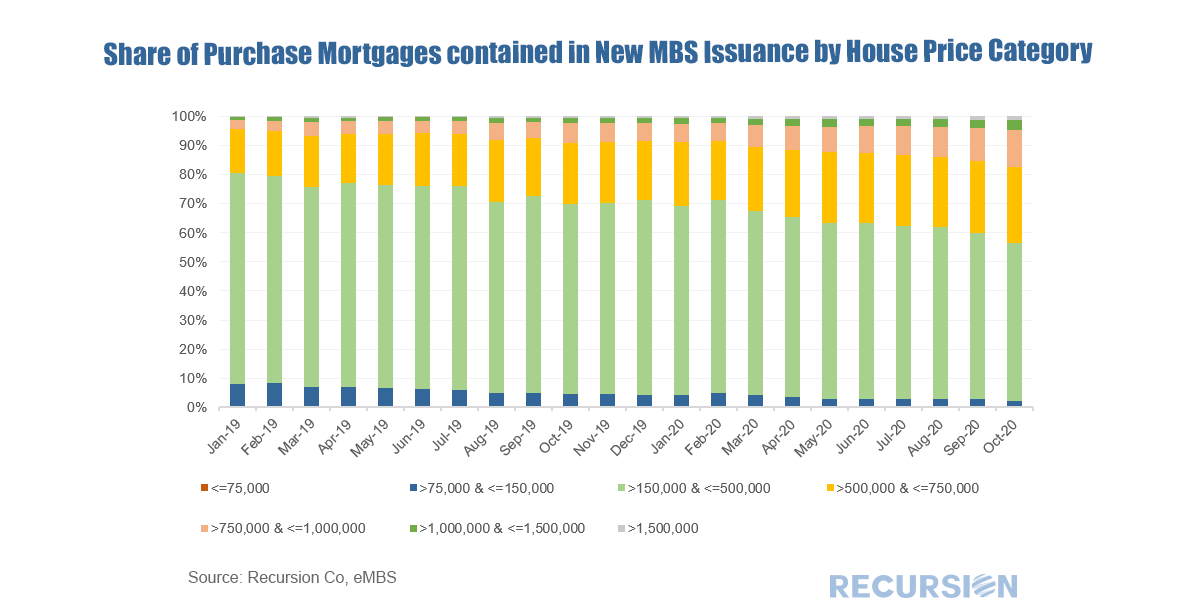 This is computed by taking the loan size and scaling it up by the original ltv. The share of deliveries of loans over $500,000 increased from 19.3% at the start of 2019 to 28.8% in February of this year. This pace accelerated sharply to over 40% of the market so far in October 2020. Covid-19 has been a net positive for home prices, but affordability is a question. Unfortunately, we do not have data on age of borrower since the onset of the pandemic and will not until the release of HMDA data for 2020 sometime next summer. What we do have is the share of first-time homebuyers. 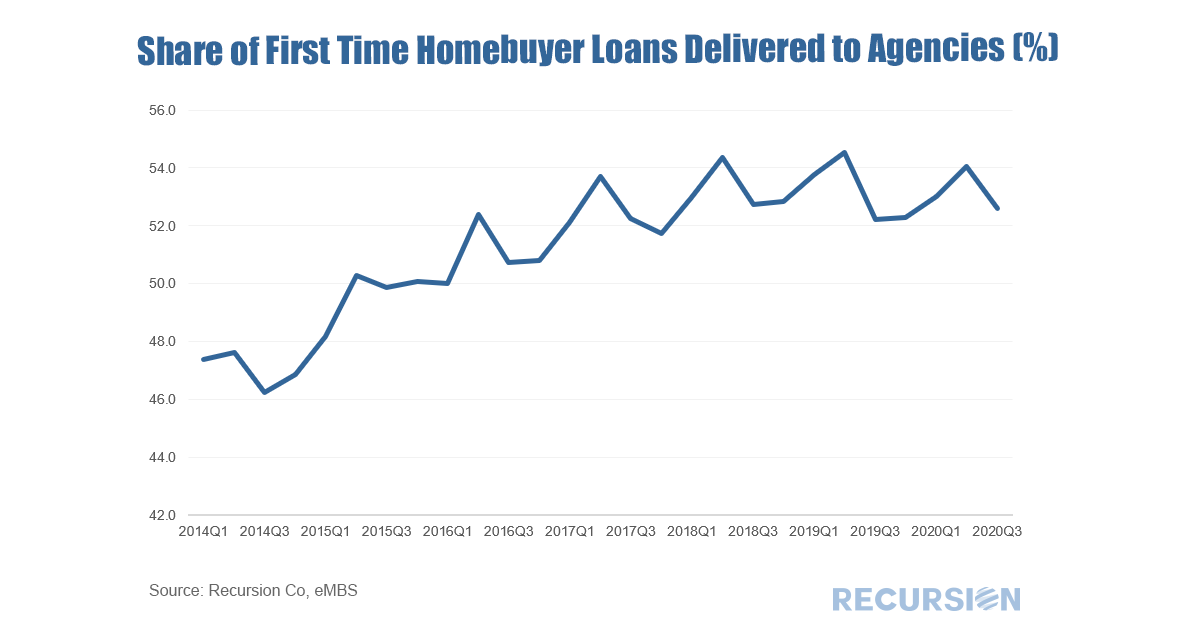 This share picked up considerably over the period 2014-2019, but at a steadily decelerating pace. Normally, Q2 of each year sees the highest share of first time home buyers. The seasonality has been disrupted by the virus in 2020. In 2020 Q2, first time home buyers’ share is lower than that of 2019, while it posted a small increase in Q3 from a year ago. We are a long way from knowing how the impact of the Covid-19 pandemic will play out in the housing market, but so far it seems that pent-up demand from a large millennial population is largely offset by impediments to their ability to find affordable homes to buy. [1]https://www.pewresearch.org/fact-tank/2020/04/28/millennials-overtake-baby-boomers-as-americas-largest-generation/
[2] https://www.census.gov/prod/2014pubs/p25-1141.pdf [3] https://www.journals.uchicago.edu/doi/full/10.1086/704609?mobileUi=0 [4] http://www.freddiemac.com/research/insight/20200107_family_budget_burdens.page [5] https://www.federalreserve.gov/econres/feds/files/2018080pap.pdf [6] https://www.redfin.com/news/pandemic-causes-rural-suburbs-home-price-increase/ |
Archives
July 2024
Tags
All
|
 RSS Feed
RECURSION |
|

Copyright © 2022 Recursion, Co. All rights reserved.