|
In previous posts, we discussed the trends in Ginnie Mae MBS issuance by loan purpose.[1] Recall that the decision to buy a loan out of a Ginnie pool rests with the servicer. As such, this decision is dependent in part on environmental factors that impact the profitability of this action, notably the interest rate. As loans get bought out at par, there is a greater incentive to purchase loans out of pools and get them into reperforming status when rates are low than when they are high. This relationship can be clearly seen in the following graphs: 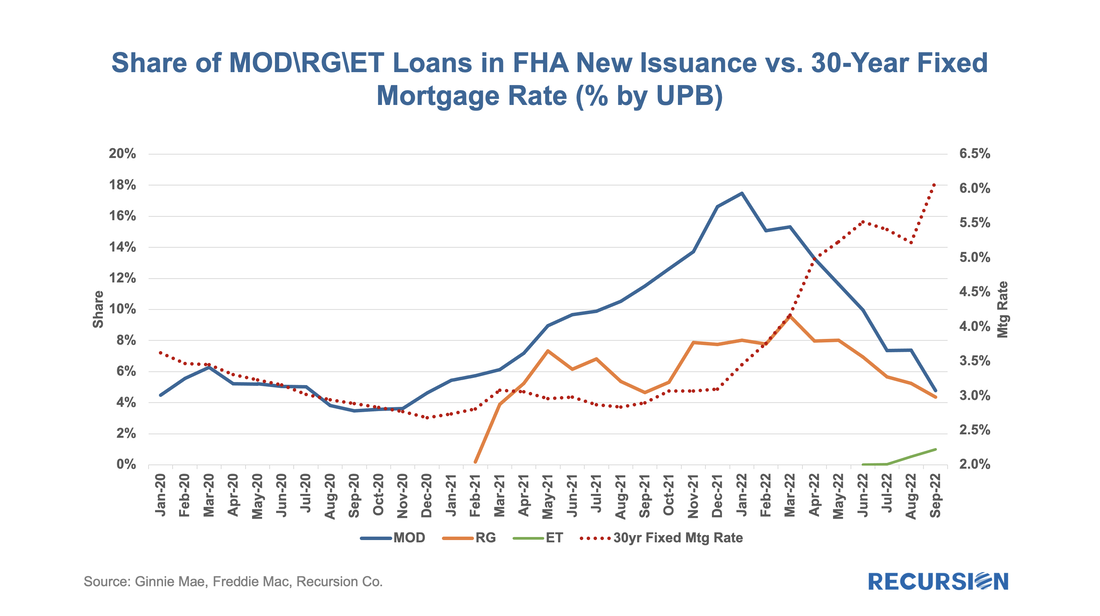 As pool issuance reached historical high amid record low mortgage rate with the onset of Covid-19 in 2020, Agency CMO took off correspondingly. Investors apparently looked favorably on the diversification opportunities in structured products, given the heightened uncertainty during that time. In 2021 total issuance dipped, and so far through the first eight months of 2022 volumes are well behind last year’s pace. The GSE commingle fee set force in June slowed down Fannie and Freddie’s CMO issuance significantly. However, as a share of total issuance, CMOs are holding up quite well. 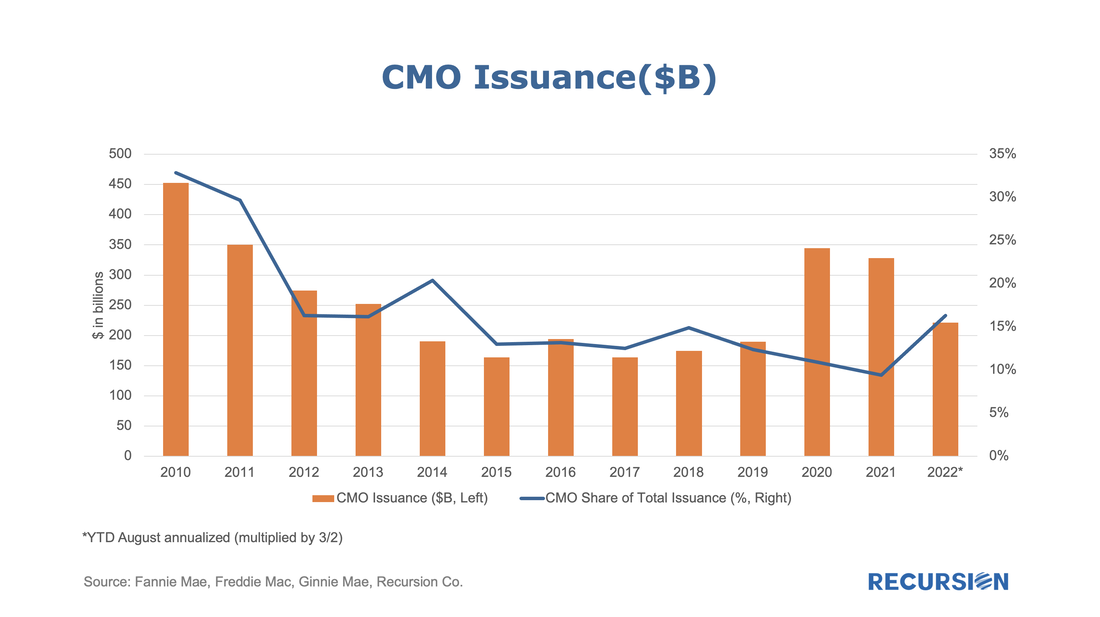 The rise in mortgage rates is having a profound impact on lender strategies in the mortgage market. These can be seen by looking at trends in the use of Third-Party Originators (TPOs). Some lenders, such as Quicken, traditionally work almost exclusively with loans originated in-house, while others, such as PennyMac, primarily accumulate and package loans produced by other lenders. Most larger institutions do some of both. The advantage of acquiring loans from a mortgage broker or correspondent in addition to origination is that the lender has flexibility regarding what method they use to turn volumes up and down to fit its strategy and market views. In both cases, there are costs to increasing and cutting capacity. As the market grows, bringing on new employees carries expenses such as training, while building trusted new external relationships can also be time-consuming. As markets contract, there are direct costs to layoffs, while unwinding networks can impact relationships that can be difficult to rebuild when the cycle turns. Of course, in a sufficiently bad market, the company may have no choice but to cut back. Recently there have been some high-profile announcements of layoffs across the mortgage lending space, but through the first half of 2022, the reported decline in employment has been modest. But employment tends to lag interest rates, so further declines cannot be ruled out. 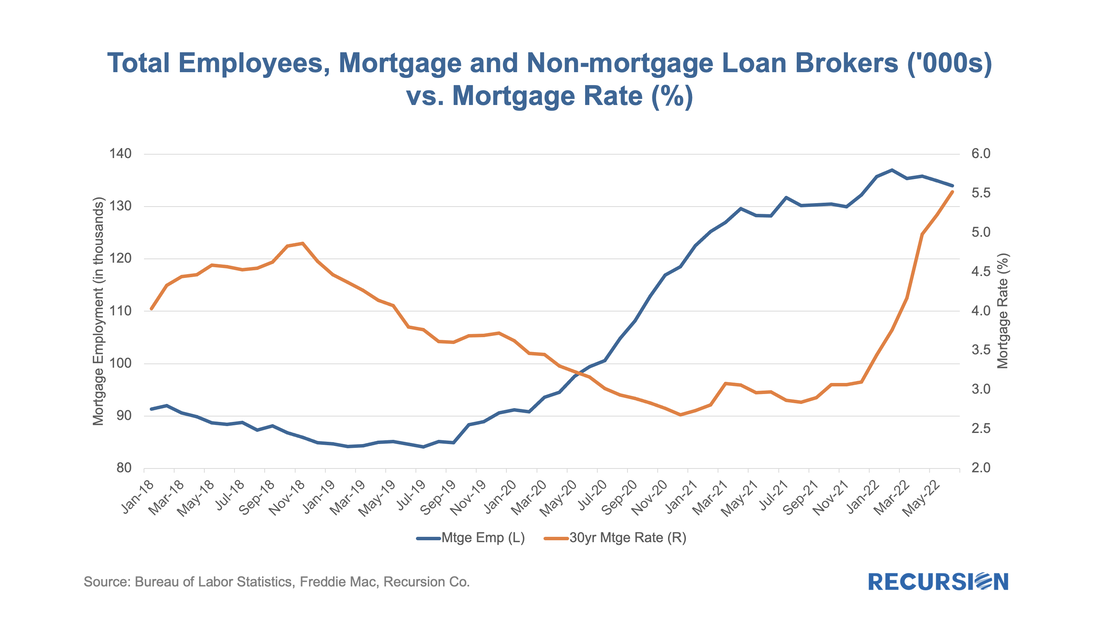 Analyzing trends in market performance requires two things, 1) a lot of data, and, 2) a deep understanding of the structure of markets. We recently came across a good example of this with relative delinquency rates between GNM and GSE pools[1]. In this post, we look at the dynamics of the two categories of reperforming mortgage loans. Investors have spent many years building models of prepayment speeds for mortgage pools based on a variety of characteristics such as loan size and underwriting characteristics. However, institutional factors can come into play as well. One that comes to mind is the difference in program structure between conventional and government loans. For the conforming market, the issuer is a GSE, while for government programs, it is the servicer. In both categories, when a loan becomes seriously delinquent, it can be bought out of the pool at par, amounting to a prepayment. The difference is that for the case of conforming loans, it is the quasi-public GSEs that perform this function, while for government programs, the decision is up to private sector entities. In the first case, there are overarching policy goals that weigh on decisions about the disposition of loans in delinquency, while in the second case, these decisions are based on financial considerations. One way to test this is to look at buyouts over the interest rate cycle. Below find a chart containing the shares of reperforming loans in new issuance for FHA, VA and the GSEs. These are loans that have been previously bought out of pools and then reissued into new pools. There can be a substantial lag between the buyout and re-issuance. 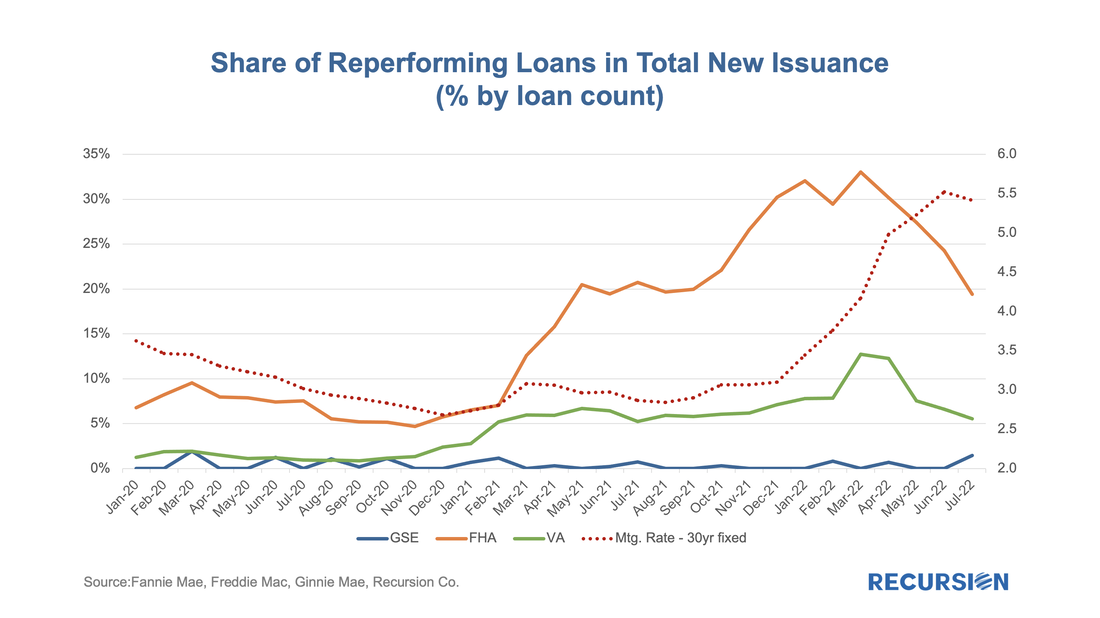 There has been a modest but persistent widening of the gap in 1-month DQ rates between the Ginnie Mae programs and the GSEs over the past couple of years. Previously, our experience was that these are mostly driven by developments in the labor market[1]. In fact, there has been a recent small but persistent rise in the number of initial jobless claims that correlates with this widening: 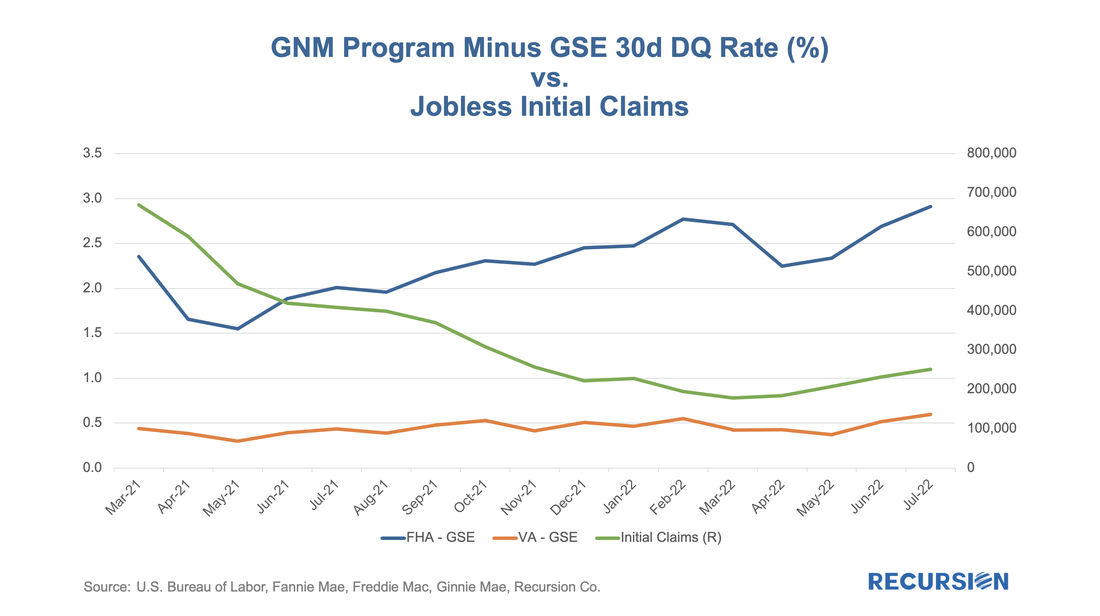 With interest rates significantly higher than those in place at the start of the year, it’s natural that potential homebuyers look for ways to reduce borrowing costs. One of these ways is through an adjustable-rate mortgage (ARM). Now that we have complete data for July, it is a timely moment to look at recent trends in ARM issuance. As we approach the topic, it’s important to note a few institutional points. First, the ARM programs available to conventional and Government borrowers are distinct, so we break the issuance down between GSE and Ginnie pools. Second, the market underwent a significant shift with the elimination of LIBOR as a benchmark[1]. Let’s start with the conforming market. There are several product types, but in July 2022, the largest is 7-year ARMs, followed by 5-year and 10-year ARMs: 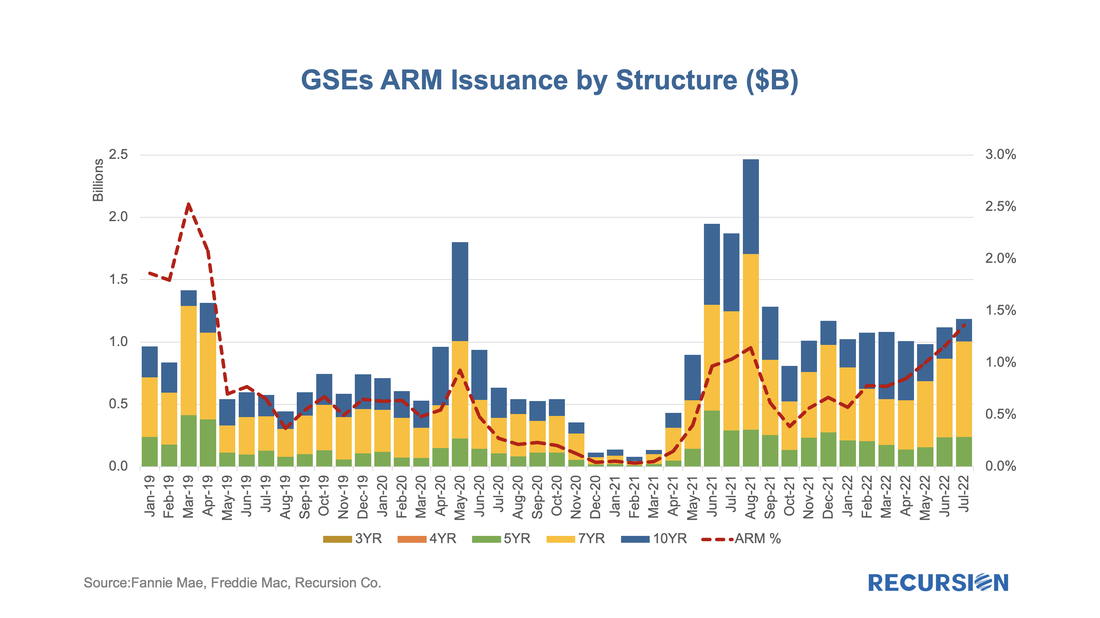 With mortgage rates near 40-year highs, there has been a pronounced collapse in refinance activity reflected in agency loan originations: 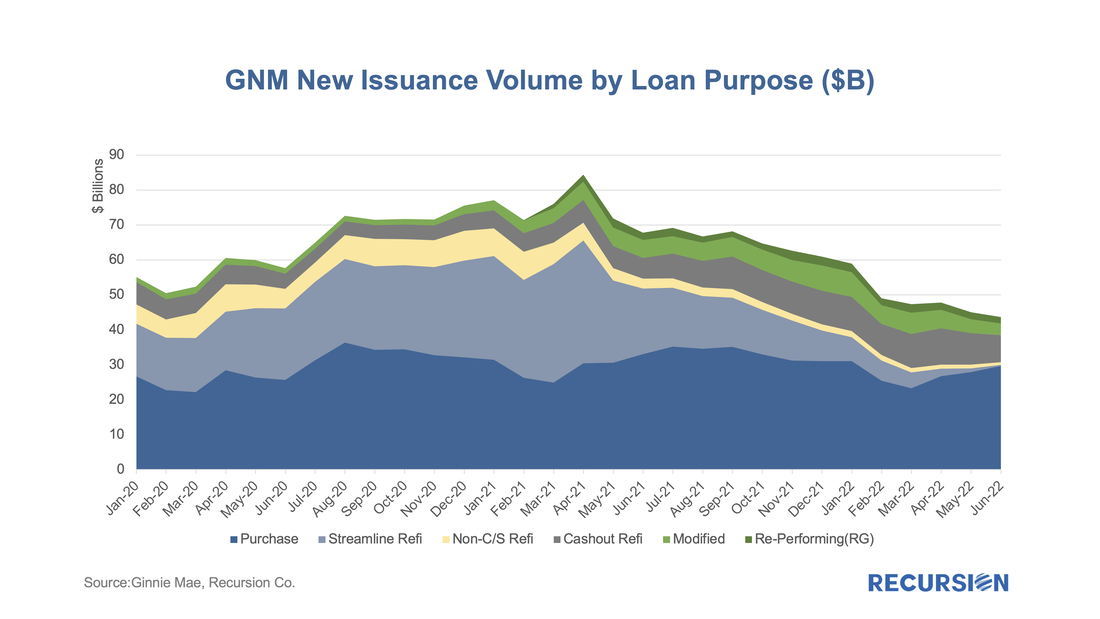 Usually, when we talk about financial institutions in our posts, we focus on sellers and/or servicers as we have a clear view from the Agency disclosures. An interesting distinction in this regard is to break down originations between those sourced through a retail channel within the lending institutions and those purchased from other lenders, known as third-party originations (TPOs). We are often asked the question in the case of TPO lending, where only sponsors of the mortgages are reported, who are the originators? This information is not reported in the agency loan-level disclosure. We can supplement this information by examining originators in the HMDA data by observing the fact a TPO (correspondent or broker) loan is often reported twice, one record reported by the originator and another reported by the sponsor. At Recursion, we conducted an exercise by matching the pairs together, and we were able to identify the counterparty pairs for about 50% of the mortgages marked as “purchased”, and also made this revealing data point to our HMDA Analyzer users. According to the 2021 HMDA preliminary release, about 2.65 million loans were purchased from other lenders that year, about 18% of all originations. Roughly half of these purchases were made by 10 institutions: 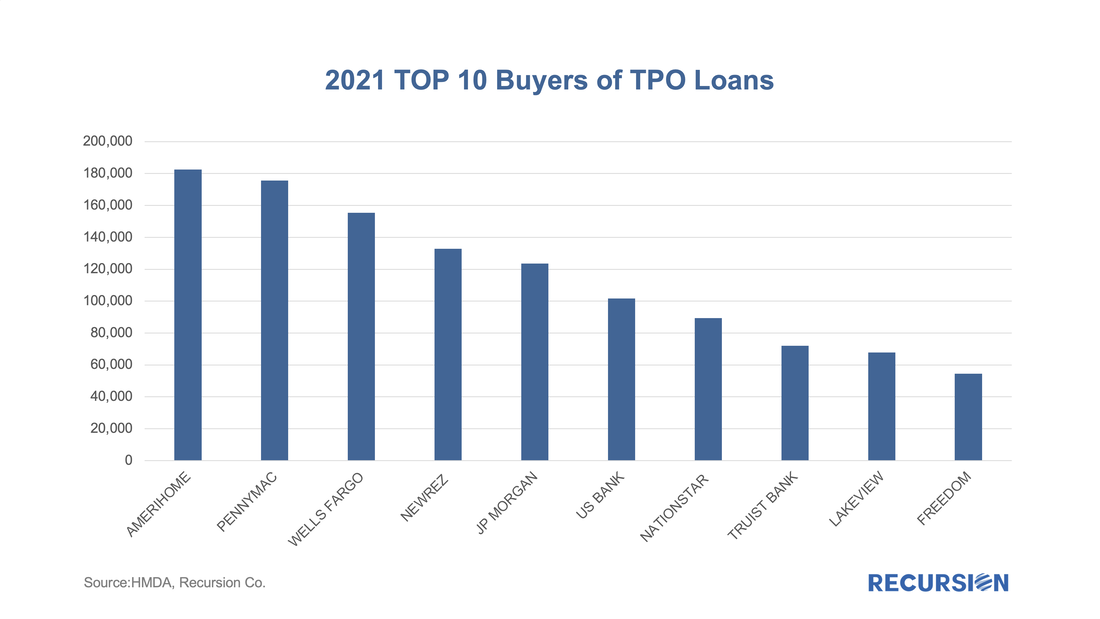 |
Archives
July 2024
Tags
All
|
 RSS Feed
RECURSION |
|

Copyright © 2022 Recursion, Co. All rights reserved.