|
On May 25, 2022, Ginnie Mae announced that starting on June 8 it would enhance its pool and loan-level multifamily disclosures through the addition of an Affordable Status Field[1]. This field marks every FHA loan in pools with a Ginnie Mae guarantee as:
We received this data on the 6th business evening, and below find some summary descriptions: 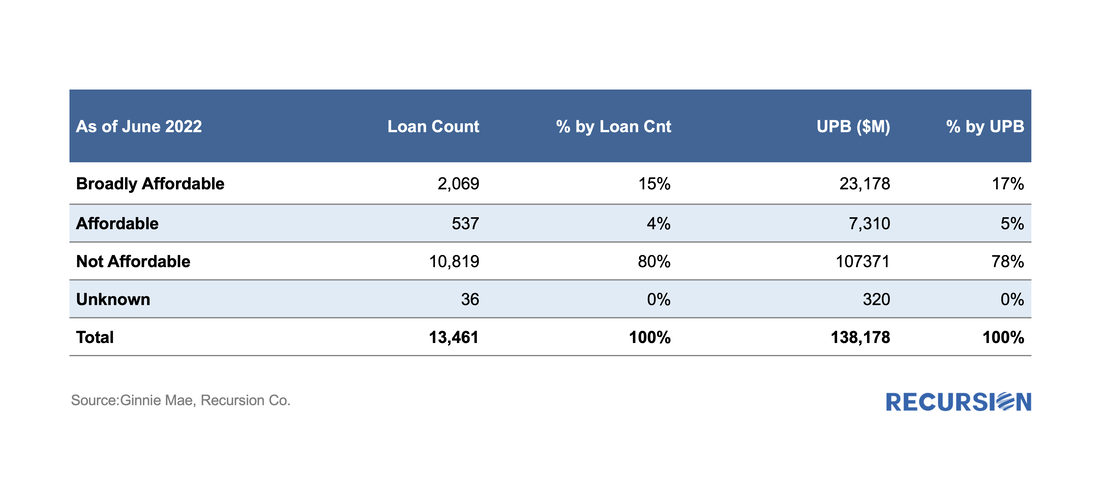 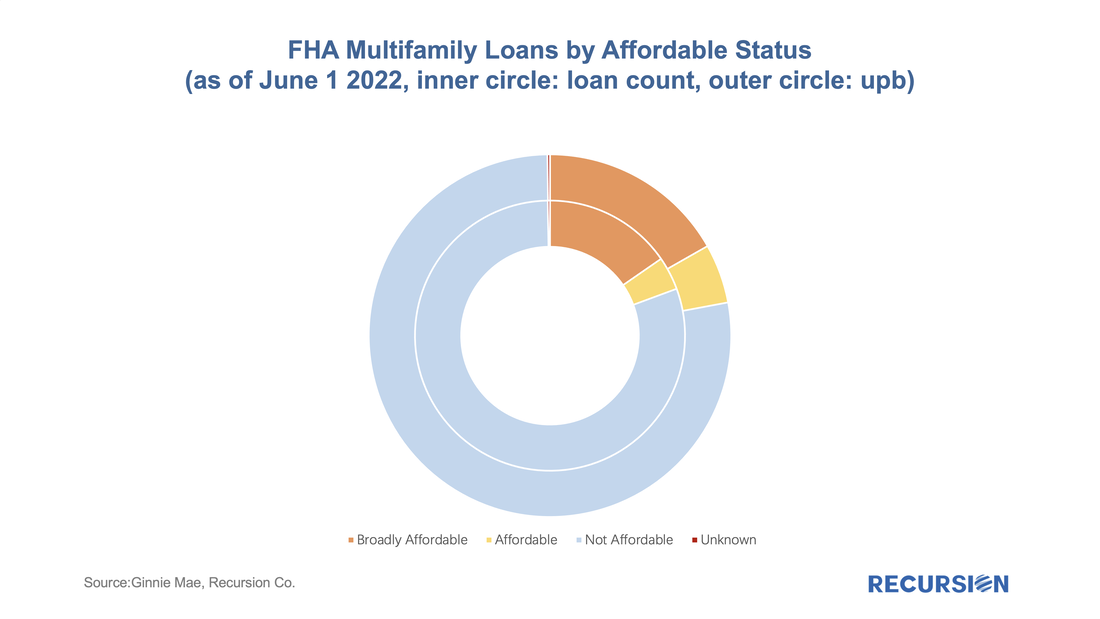 In recent posts, we’ve been tracking the progress of loans coming out of forbearance into various pool types such as Reperforming (RG), Extended Term (ET) and, even Private Label pools[1]. A different perspective can be obtained by looking at the disposition of loans with partial claims. Recall that a partial claim occurs when a borrower with missed payments can resume making payments but does not have the resources to increase payments to compensate for the balance missed. In general, the missed payments are placed into a subordinate lien that comes due when the mortgage is extinguished. It is important to note that a partial claim is not a modification, and a loan with a partial claim does not have to be in a forbearance program. Recently, Ginnie Mae announced that they would disclose the share of loans in pools with partial claims[2]. Below find a summary table of these results reported first ever as of April, 2022 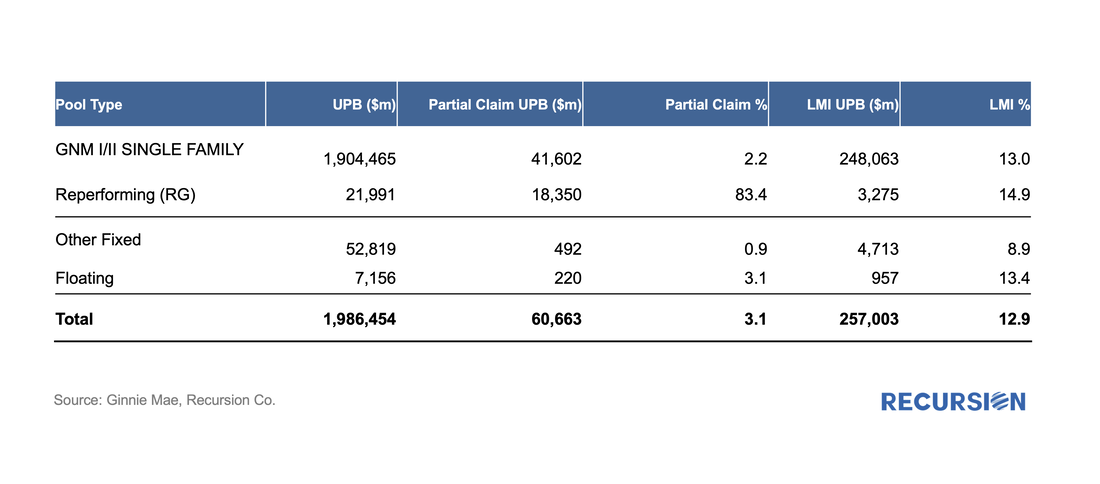 With the 30-year mortgage rate surging to a 13-year high near 5 ¼% and the FHFA purchase-only house price index at a record-high 19.42% in February (edging out the prior record of 19.39% in July 2021), we are in an unprecedented environment in the mortgage market. As such, it makes sense to update our analysis of the trend in issuance updated through April. Of particular interest in this regard are the FHA and VA programs. Let’s start by looking at FHA. By loan count, there were 107,500 FHA loans issued in GNM pools in April, with a decline of over 1/3 from the same month a year earlier. One special interest is the evolution of the share of issuance by loan purpose: 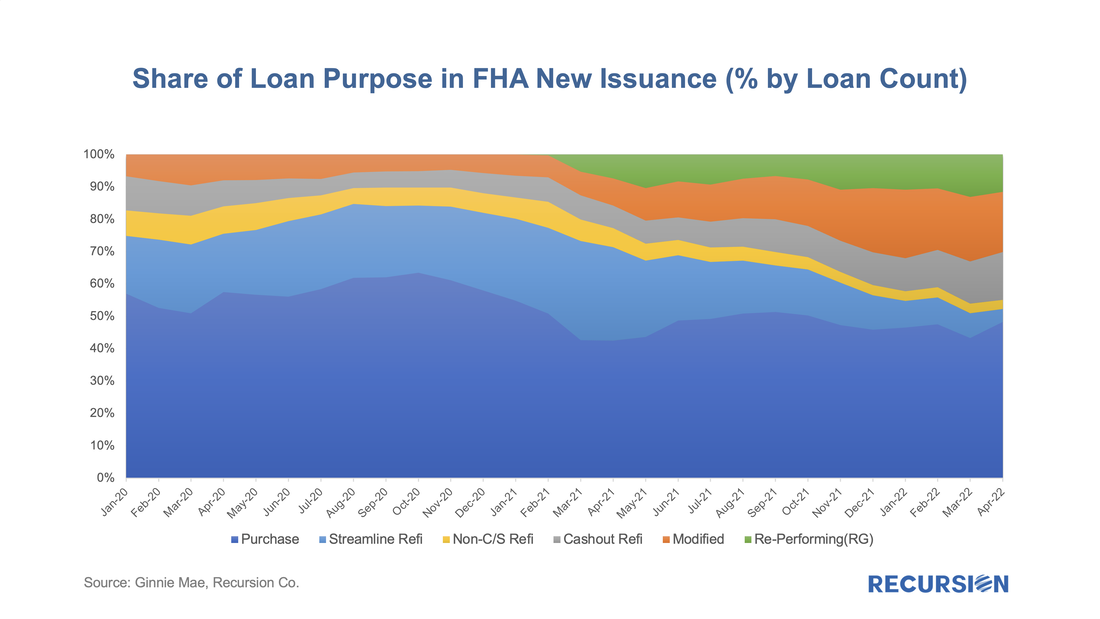 In a recent post[1], we discussed findings obtained with the recent release of 2021 HMDA data. Among other things, we looked at the share of mortgage originations by income group and product type. In this note, we look at the difference in lending patterns between the banks and nonbanks. The incentive behind this approach is policy driven. There is a long history of measures taken to encourage lenders and builders to foster economic development in low-income areas via the housing market. For example, the Community Reinvestment Act (CRA) stipulates that a bank’s performance with regards to compliance of their regulatory requirements depends in part on: “the geographic distribution of loans—that is, the proportion of the bank's total loans made within its assessment area; how these loans are distributed among low-, moderate-, middle-, and upper income locations[2]” To assess this issue, we assign a flag to each of the census tracts designated by HUD as having a greater than 51% share of households with incomes in the Low-to-Moderate (LMI) range in the larger MSA the tract is part of[3], which are called LMI area by HUD, or “low income” tracts by FHFA. Below find a chart of the 10-year trend in the share of loans originated in this category by institution type for conventional and FHA loans: 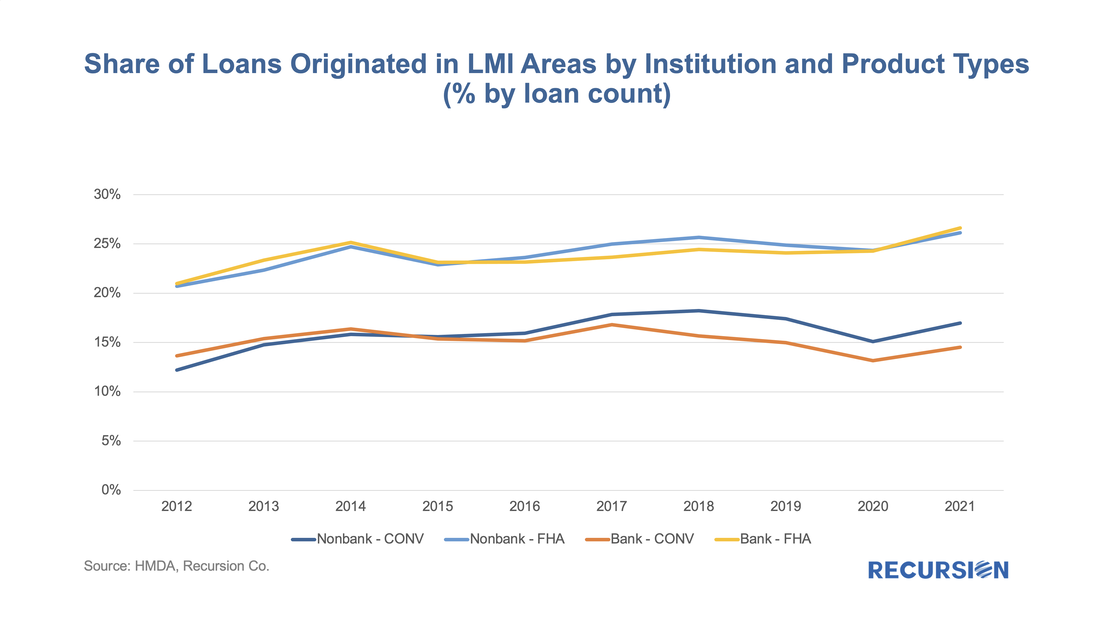 In a recent post[1], we discussed the disposition of loans that are exiting forbearance programs. In the Ginnie Mae programs, many loans bought out of pools have received modifications or other workouts, and then redelivered to Ginnie Mae pools. However, we have historically observed that there are more loans bought out than re-delivered, even considering the time needed for the workout. As it turns out, there are other market-based outlets for these loans, which is more evident at the issuer level than in aggregate. Below find a chart of buyout and securitization activities within Ginnie Mae program for Lakeview, the third-largest Ginnie Mae servicer as of April 2022. 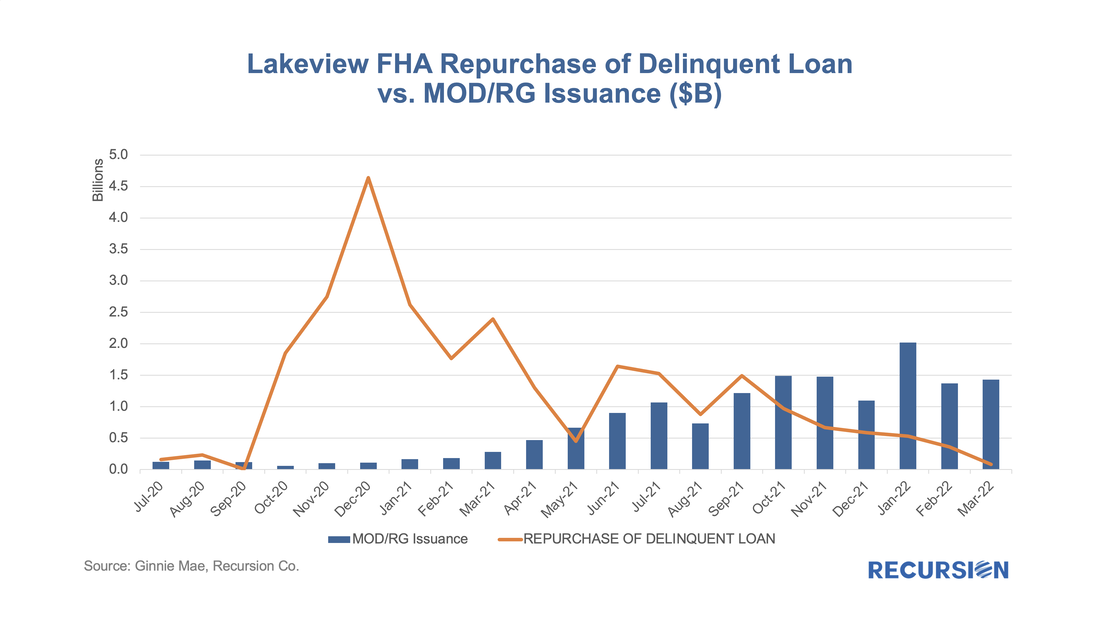 While surging house prices continue to be the focus of market participants, the rental market is increasingly attracting the attention of policymakers, both because of the impact on inflation[1] and the importance of this market for the economic wellbeing of lower-income households[2]. In both cases, there is a widespread consensus regarding the need for new supply to ameliorate these problems. There are many factors that come into play regarding the construction of new rental units, including the availability of private and public sources of credit. As part of its quarterly release of the "Financial Accounts of the United States"[3], the Federal Reserve publishes data that allows us to break down the trend in total multifamily lending into major categories of credit risk holders: 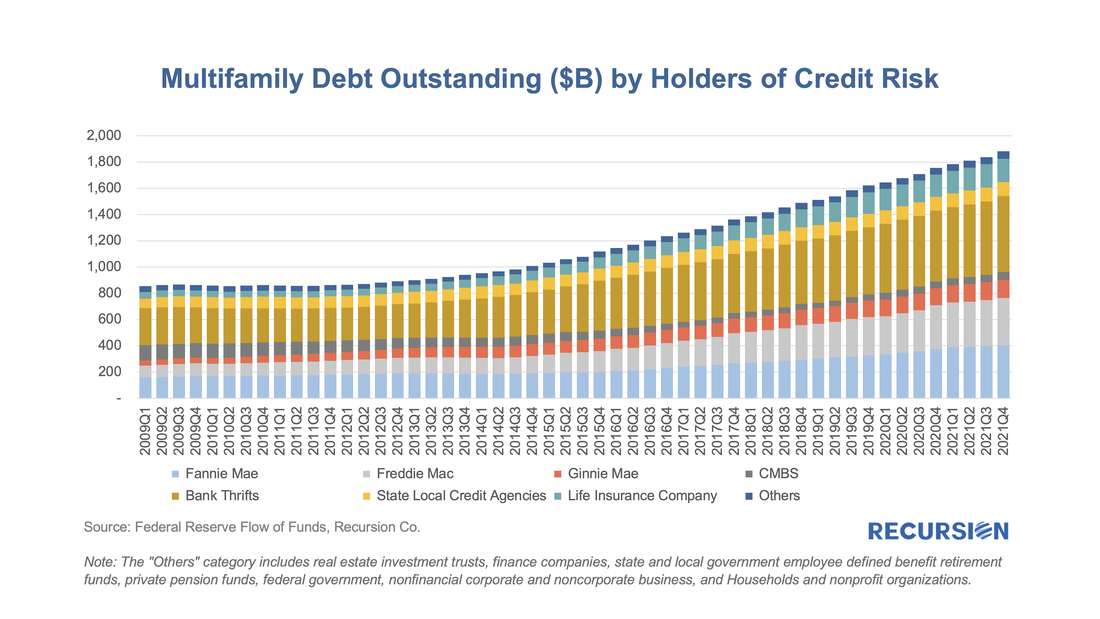 Recursion released the roaster of TOP 10 GNM issuers and GSE lenders of March 2022. Mortgage issuers delivered 183K loans for a combined $47B to Ginnie Mae program. Issuance volume dropped $2B from February 2022. Here’s a list of top 10 GNM mortgage issuers. 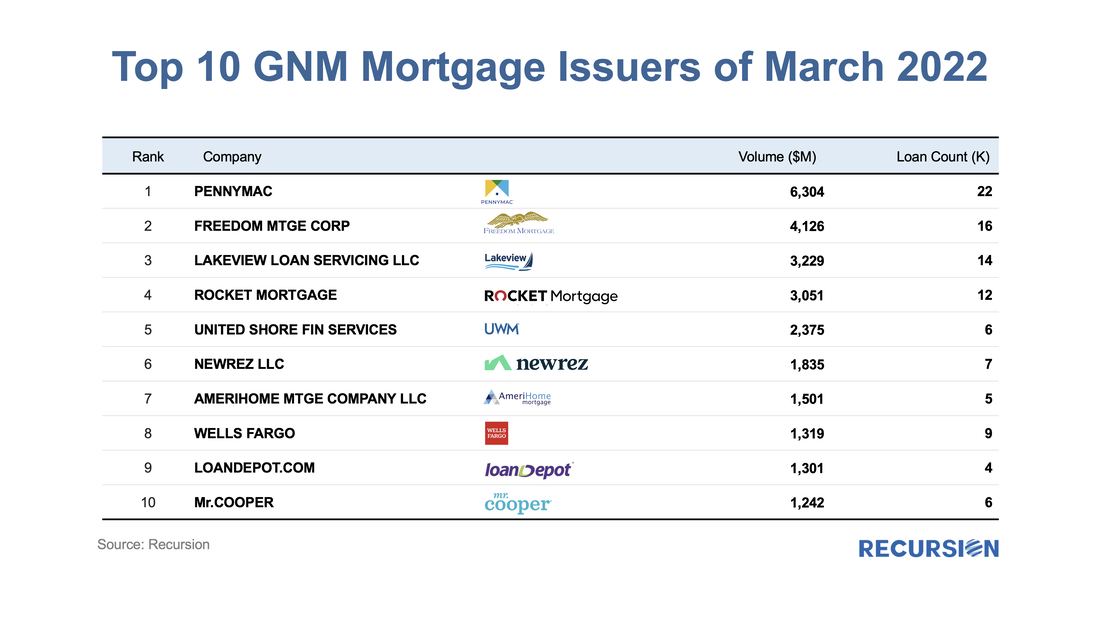 With the expiration of forbearance programs underway, there is an interesting question about how loans exiting these programs will perform once they are resecuritized. For Ginnie Mae programs, these are either loans that exit forbearance with a partial claim or receive a permanent mod under the various waterfall options in the FHA or VA programs. In our previous blogs[1], we have noted MOD and RG loans are becoming a significant portion of loans delivered to newly issued Ginnie Mae pools. 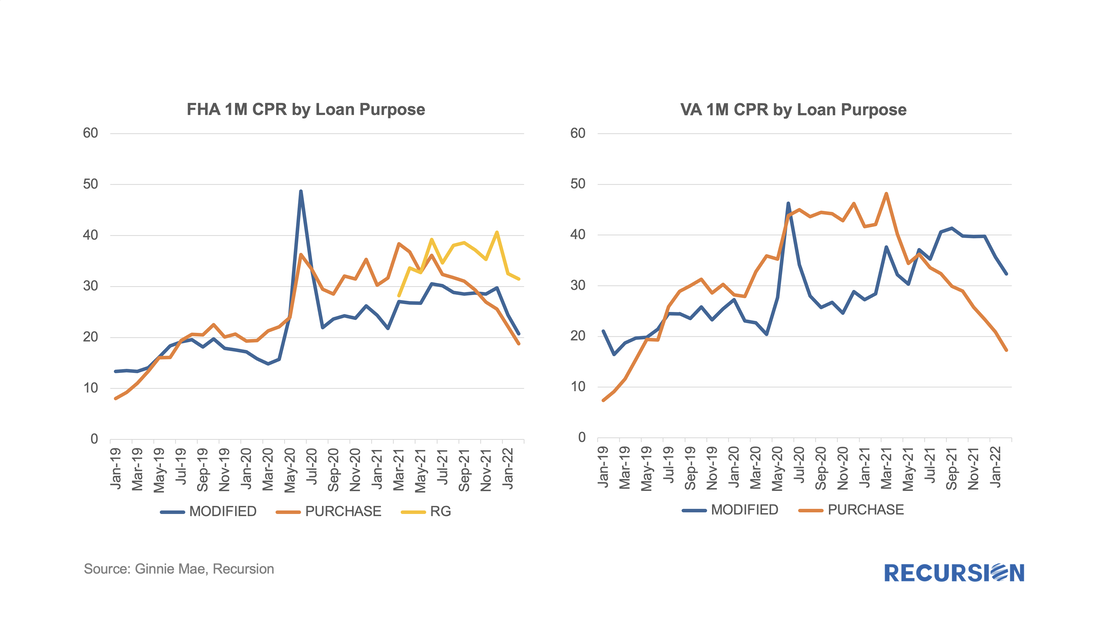 |
Archives
February 2024
Tags
All
|
 RSS Feed
RECURSION |
|

Copyright © 2022 Recursion, Co. All rights reserved.