|
The economic news in March got off on a strong note with the release of payroll employment data showing a hike of 916,000, a seven-month high. This coincided with the first anniversary of the onset of the Covid-19 Pandemic. The Cares Act forbearance program was launched at the end of March 2020 and was originally designed to last for one year. More recently, the program was extended for six months, but borrowers need to recertify their status as economically impacted by Covid every three months from the 1-year anniversary data[1]. So naturally the end of March was a time in which many borrowers had to recertify. This was a natural time for households to reassess their financial positions, setting the stage for the possibility that they could begin repaying their mortgage obligations. In fact, they did, and we saw a sizable drop in the number of loans in Covid-related forbearance[2] in April, particularly for Ginnie Mae programs: 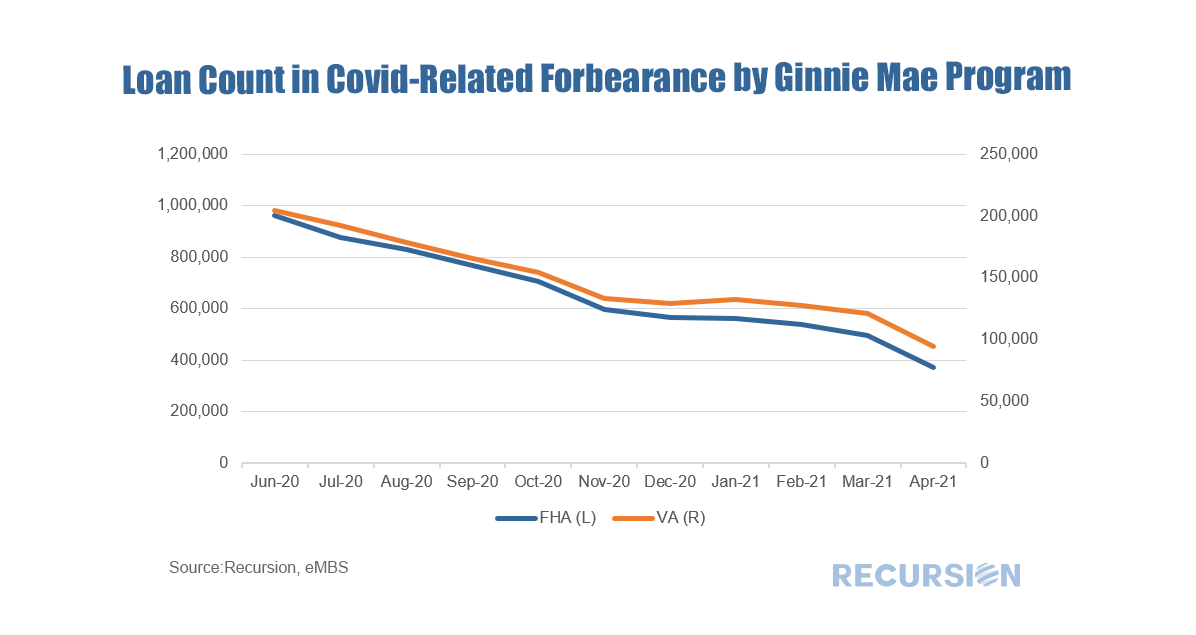 The economic fundamental driving this decline is the improvement in the labor market, and a distinct correlation can be seen between declining forbearances and unemployment: 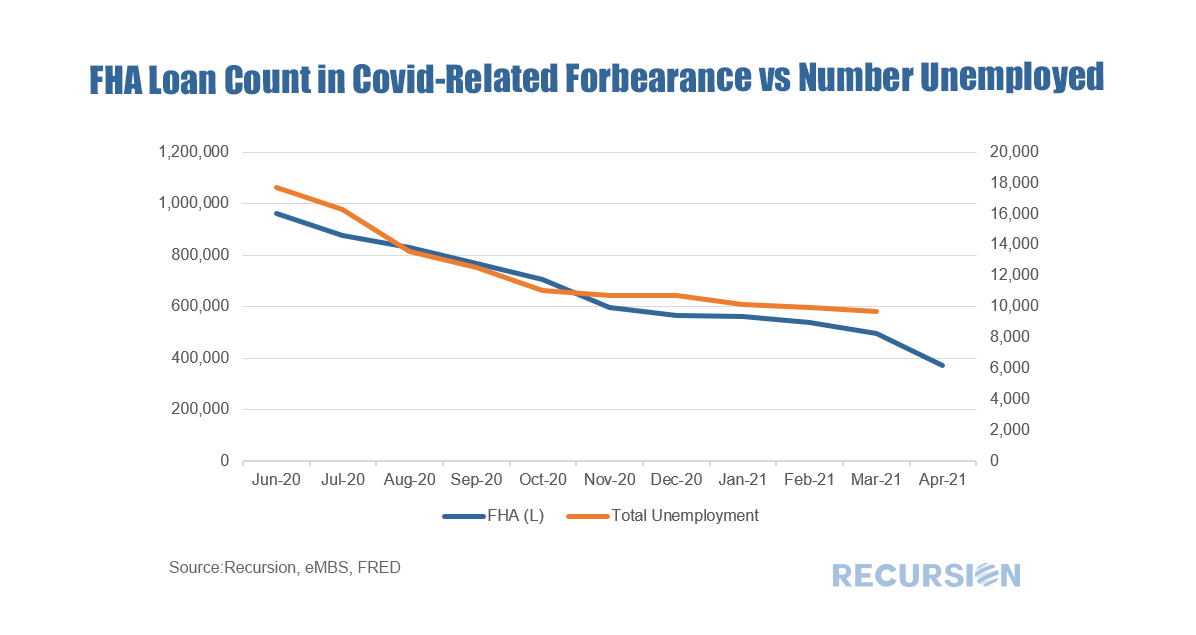 A bit more analysis is in order here. The forbearance data come from loans in agency pools, so there is always the possibility that the number of loans in forbearance decreases because some of those loans were bought out of pools by servicers. To check this, we looked at the disposition of loans in forbearance at the beginning of March that remained in pools at the beginning of April but were not in forbearance. For FHA programs the number was 111,153 loans compared to the one-month decline in the number of loans in forbearance of 125,202. For VA the similar statistic is 27,247 compared with a 26,810 decline in the number of loans in forbearance. It seems clear that improving labor market fundamentals are the primary driver of the decline in the number of loans in forbearance in these programs. To test the idea that the 12-month renewal period played an important role in this process, below we look at the loan age of those mortgages that left forbearance but stayed in pools in April. For FHA programs, the number with loan age of one month was 79,212 or 71% of the total, while for VA it was 17,863 or 66%. The next important date will be June before the program is scheduled to end at the end of September. 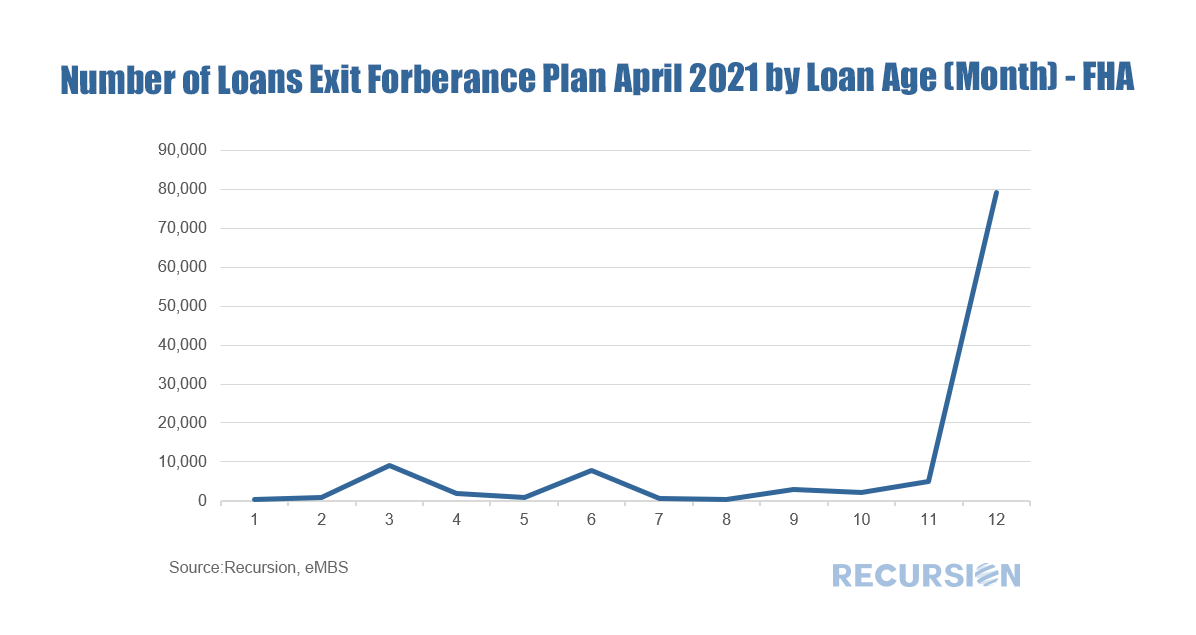 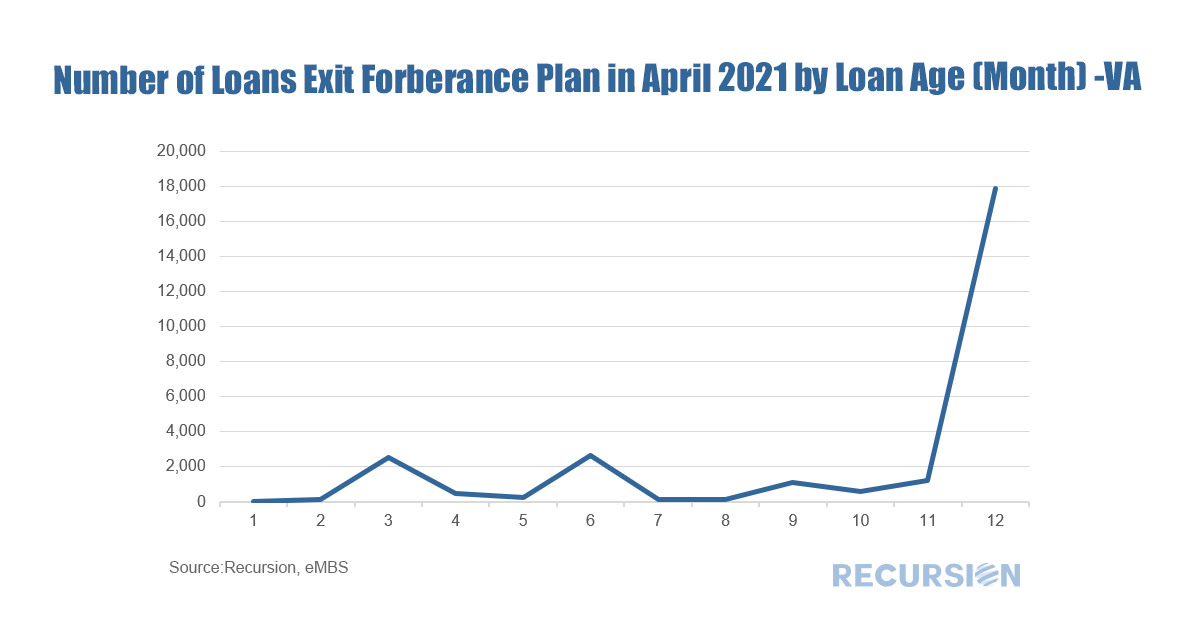 As can be seen from the above table, the vast majority of the number of loans that were recorded as in forbearance in March but not in April did not exit due to buyouts. The data do not precisely add up because other outcomes are possible, including FHA – conventional refis or sales of homes, for which we have no tracking mechanism. But the close match between cures and the declines in forbearance across programs is evidence that the main impetus is improving fundamentals. [1] https://www.consumerfinance.gov/coronavirus/mortgage-and-housing-assistance/help-for-homeowners/extend-forbearance/
[2] In this blog, we only analyze Covid-related forbearance Sometimes, future trends can be seen in the weeds. In this case it’s the 12 FHA and 1 VA mortgages (out of tens of millions) that were securitized this month in Ginnie Mae pool G2 CA8080, the very first RG pool, issued by PNC Bank, delivered to the GNMII20C program. This pool type was first announced by Ginnie Mae last December 4[1], and consists entirely of loans that were bought out of pools and cured with partial claims. These are eligible for resecuritization after 6 months without a missed payment. A previous announcement was made by Ginnie Mae last June that prohibited loans in forbearance from being bought out of pools and resecuritized into any existing pool type[2]. This rule was enacted after large banks purchased a massive number of loans in forbearance and resecuritized them immediately, leading to concerns on the part of investors[3]. Is there anything interesting about these loans? 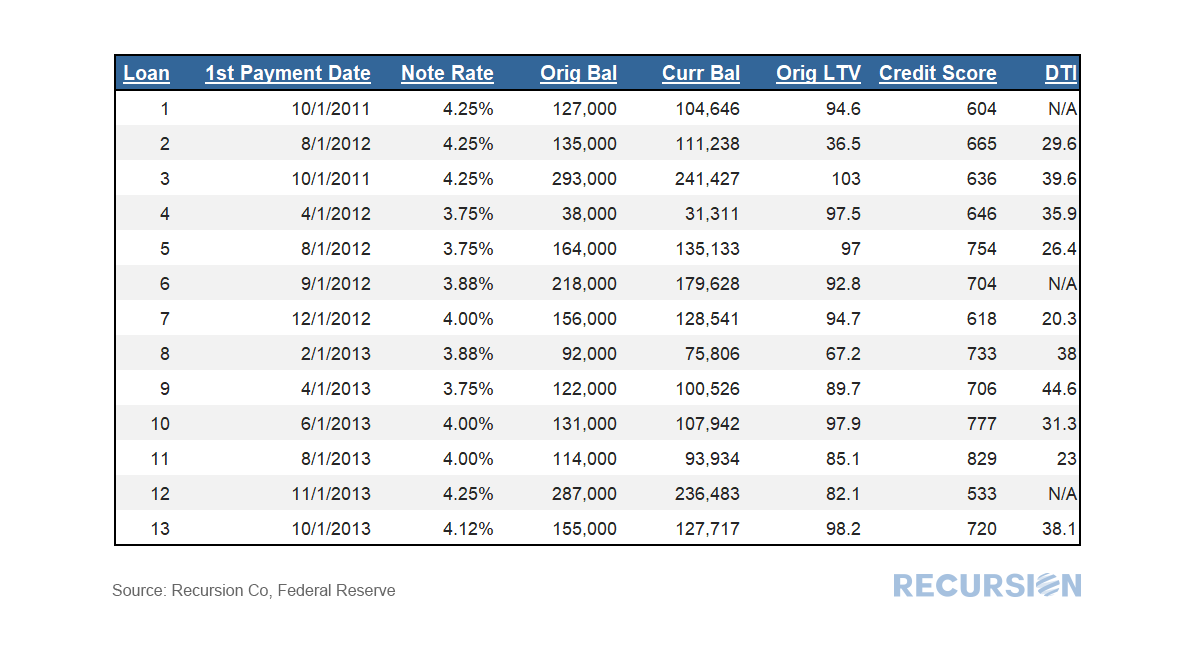 The loans were all originated in 2011-2013, so they are pretty seasoned. Note rates range from 3.75% - 4.25%. Underwriting characteristics vary considerably, with credit scores ranging from 533 to 829, for example. While original LTV’s are generally high (8/13 greater than 90) home price appreciation over the last 8-10 years likely implies that borrowers have considerable equity. More of this to come as forbearance programs begin to run out later this year. In a recent post we looked at the agency composition of the recent surge in MBS production[1]. We observed that Ginnie Mae’s market share in the three months to July 2020 is significantly below that experienced in the same period a year ago. The bulk of the decline is due to a drop in the refi share, while the purchase market share experienced less than a 1% decline. There are several drivers of share for purchase market share, including program design, the coupon spread between the government and conforming sectors, and differences in the credit boxes between the two. This note looks at competitiveness through the lens of the latter factor, credit boxes. As noted in the prior post, Ginnie Mae is the securitizer for four different programs, with the two biggest being FHA and VA. VA has a fairly unique set of program requirements, so the main competition in the purchase mortgage space is between FHA and the GSEs. In the three months to July 2020 FHA lost about 2.5% of its share in the purchase mortgage space compared to the GSEs. Let’s dive into credit factors, starting with credit score: 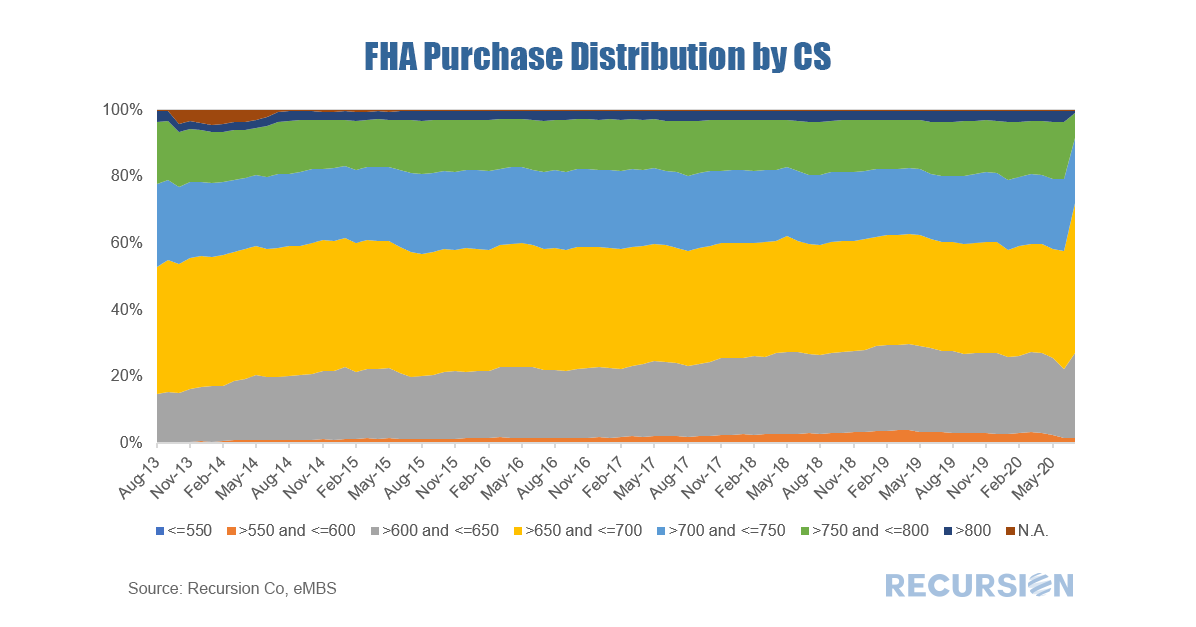 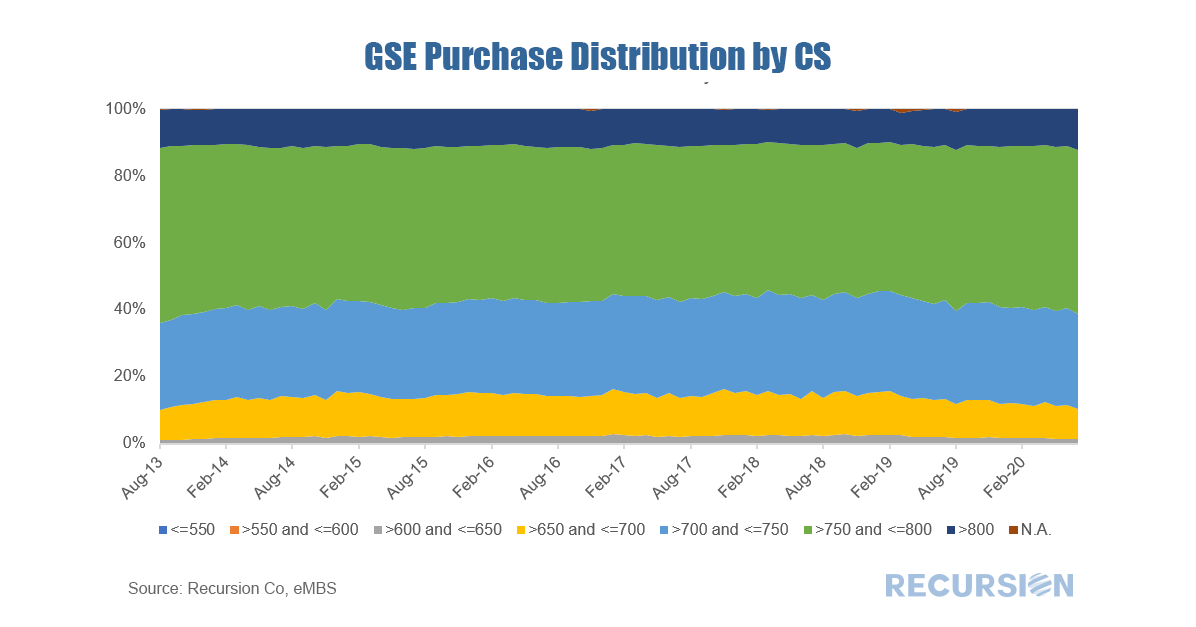 Late last month, FHFA released its purchase-only national house price index for May. This is an index of home prices associated with purchase mortgages that are delivered to the GSEs. The historical pattern is familiar. 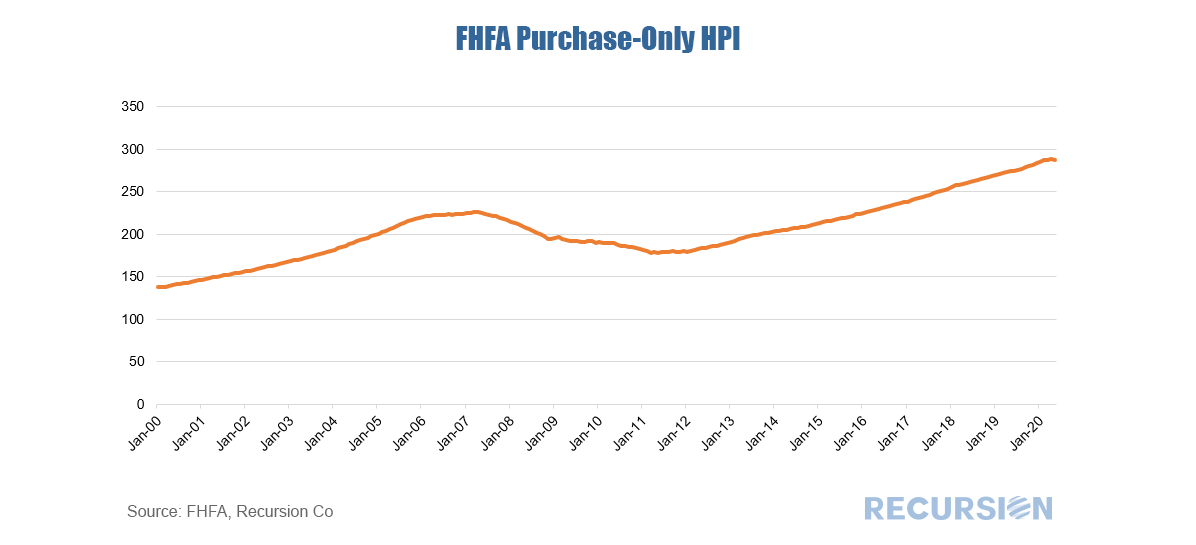 In a recent post, we noted the surge in new mortgage deliveries to a record level[1] in July. Besides this sharp increase, there is an interesting shift in the composition of these deliveries in the form of a striking decline in the government share. 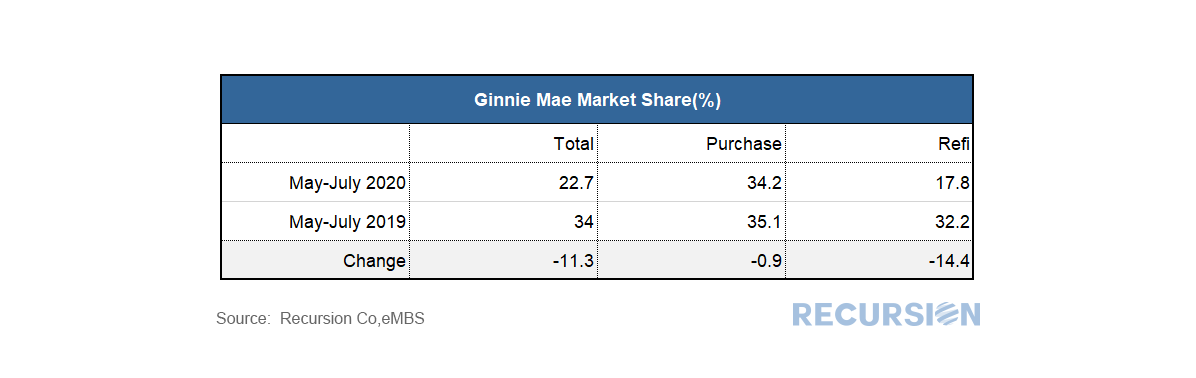 We received loan-level forbearance data from Ginnie Mae for May earlier today. The data are of high quality and appear to be broadly in line with the data reported by the Mortgage Bankers Association for the month of a little over 11% (no breakdown by program is given). The data appear to be a much better representation of market conditions than the pool-level data released by the GSE’s earlier in the month[1]. As this data is on the loan level, we can look at the relationship between this and delinquency data by state level geography and other characteristics such as bank/nonbank and underwriting characteristics and we will provide some analysis of this sort in upcoming posts. 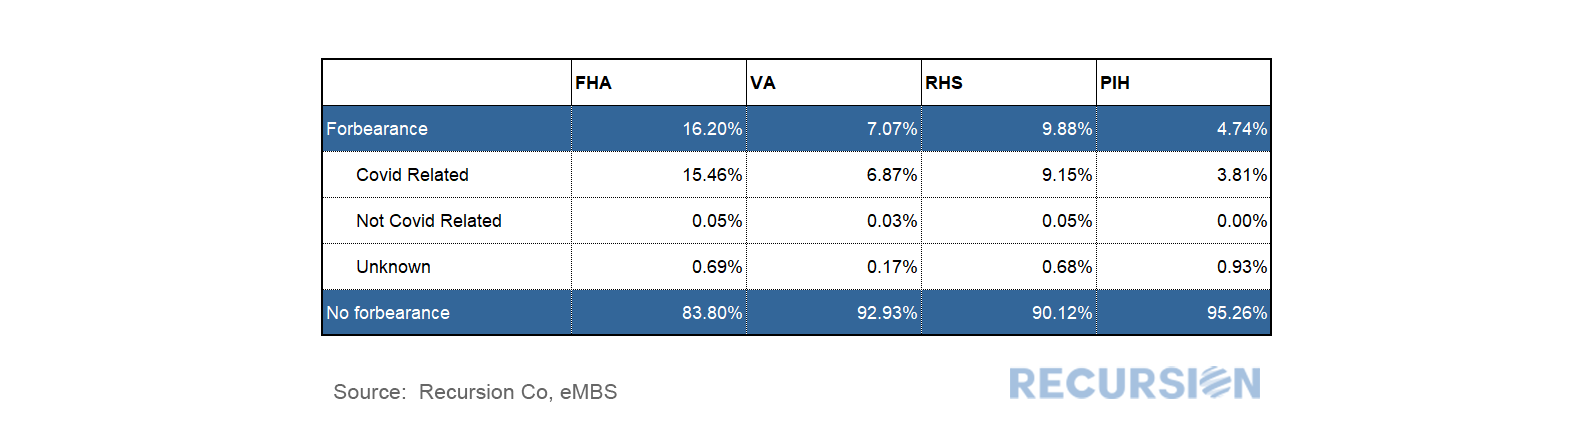 The loan-level data releases we receive early each month contain delinquency data for Government programs such as FHA and VA, but no such information is provided by the GSE’s. However, late in the month data is provided for the reference loans in the Credit Risk Sharing (CRT) programs. However, data for the most recent month is only provided by the Freddie Mac Structured Agency Credit Risk (STACR) program as the comparable Fannie Mae data is released with a 1-month lag. The latest STACR data shows the 30day delinquency rate for Freddie CRT pools went up from 0.76% in April to 4.20% this month. The states with the highest delinquency rates are: 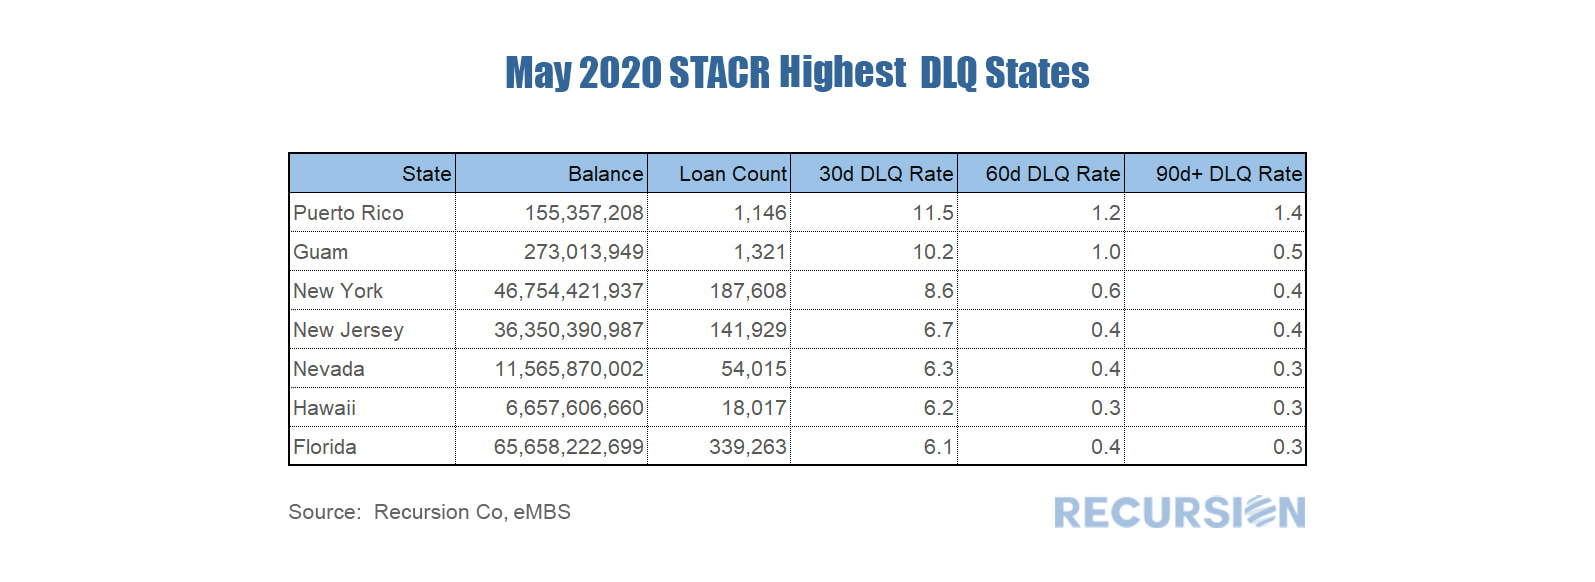 And the states with the lowest delinquency rates are: 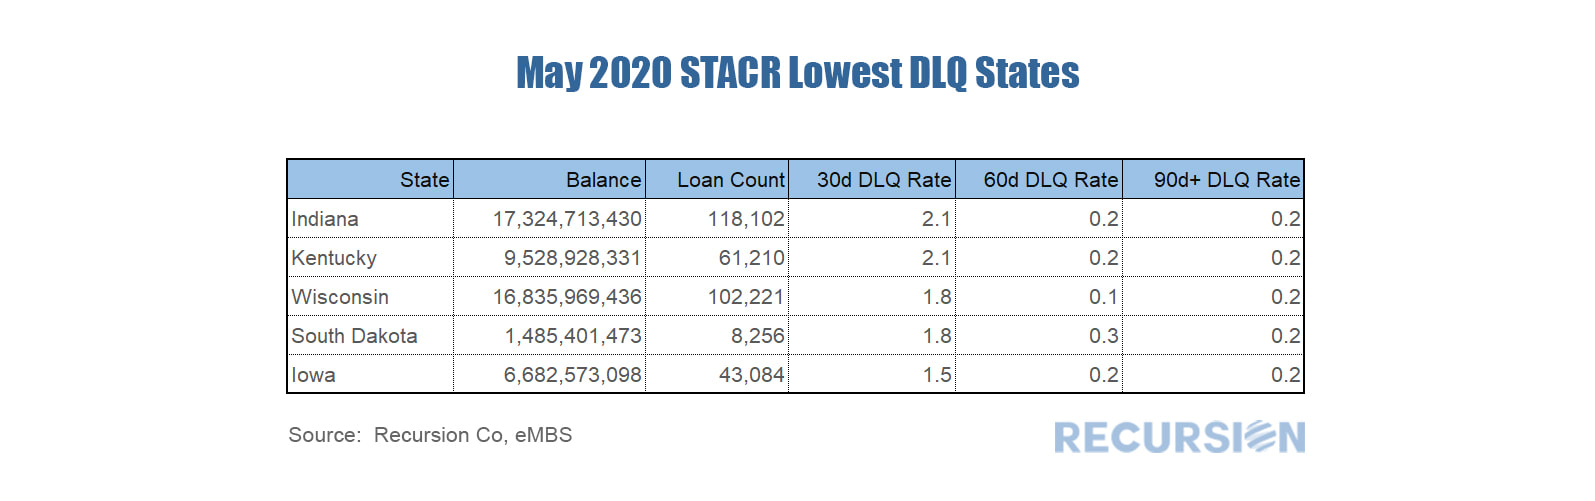 The state rankings are broadly in line with those observed in the Government data. For example, the top three states in terms of 30-day dq’s for the FHA program are New York (14.4%), NJ (13.9%) and Puerto Rico (13.2%). In general, DQ’s for FHA are higher than those for the GSE’s due to the broader credit criteria available in Government programs.
Delinquencies are important in the CRT program because they have the potential to turn into losses shared with private investors. The forbearance programs will delay but not completely prevent this transmission. The ultimate extent of investor losses depends on the duration of the Covid-19 crisis, and ensuing policy actions. With the CARES (Coronavirus Aid Relief and Economic Security) Act offering forbearance to households with mortgages for up to a year, the onus of payments to mortgage investors falls on the mortgage servicers. Much concern has arisen about the ability of these institutions, particularly thinly capitalized nonbank servicers, to meet these obligations[1]. In the case of Ginnie Mae servicers, the PTAP (Pass-Through Assistance Program) was rolled out to provide a line of credit to servicers in Government programs, notably FHA (Federal Housing Administration) and Veterans Administration (VA). In the case of the GSE’s, no such program has been forthcoming and instead, FHFA (Federal Housing Finance Agency) the regulator of the Government Sponsored Enterprises, Fannie Mae and Freddie Mac, announced that servicers of loans insured by these enterprises is only required to pay investors for the first four months if a loan is in forbearance[2].
|
Archives
February 2024
Tags
All
|
 RSS Feed
RECURSION |
|

Copyright © 2022 Recursion, Co. All rights reserved.