|
As pool issuance reached historical high amid record low mortgage rate with the onset of Covid-19 in 2020, Agency CMO took off correspondingly. Investors apparently looked favorably on the diversification opportunities in structured products, given the heightened uncertainty during that time. In 2021 total issuance dipped, and so far through the first eight months of 2022 volumes are well behind last year’s pace. The GSE commingle fee set force in June slowed down Fannie and Freddie’s CMO issuance significantly. However, as a share of total issuance, CMOs are holding up quite well. 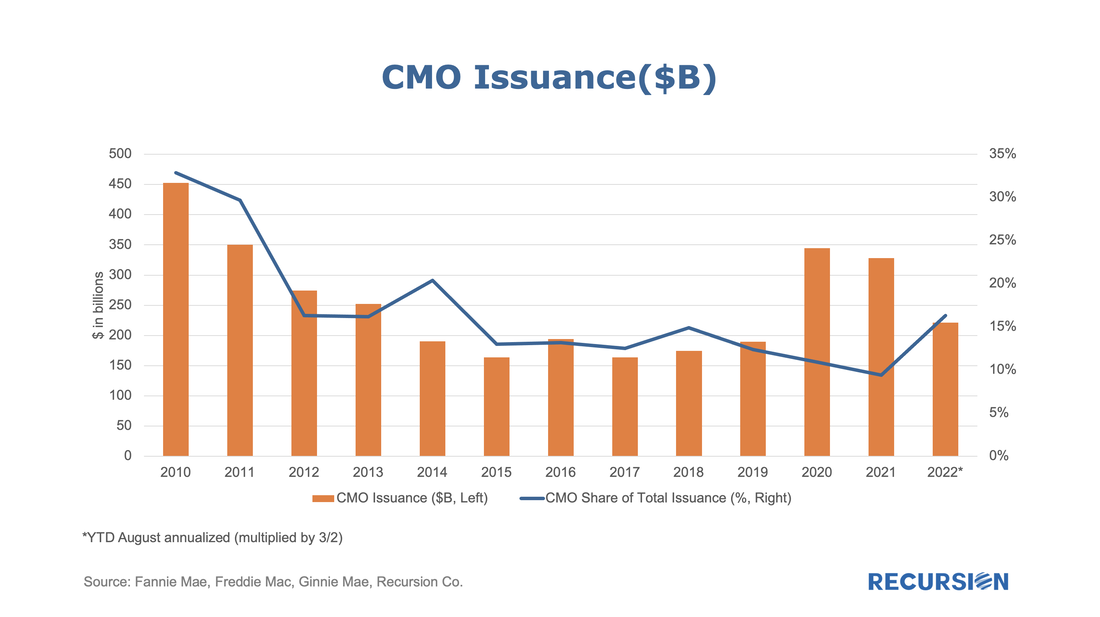 There has been a modest but persistent widening of the gap in 1-month DQ rates between the Ginnie Mae programs and the GSEs over the past couple of years. Previously, our experience was that these are mostly driven by developments in the labor market[1]. In fact, there has been a recent small but persistent rise in the number of initial jobless claims that correlates with this widening: 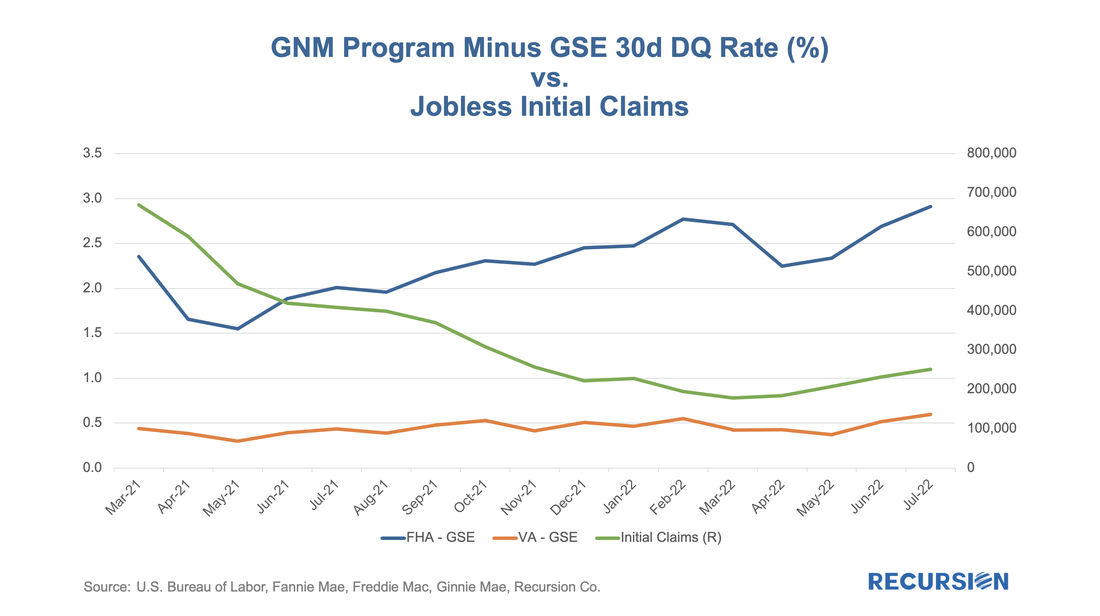 With interest rates significantly higher than those in place at the start of the year, it’s natural that potential homebuyers look for ways to reduce borrowing costs. One of these ways is through an adjustable-rate mortgage (ARM). Now that we have complete data for July, it is a timely moment to look at recent trends in ARM issuance. As we approach the topic, it’s important to note a few institutional points. First, the ARM programs available to conventional and Government borrowers are distinct, so we break the issuance down between GSE and Ginnie pools. Second, the market underwent a significant shift with the elimination of LIBOR as a benchmark[1]. Let’s start with the conforming market. There are several product types, but in July 2022, the largest is 7-year ARMs, followed by 5-year and 10-year ARMs: 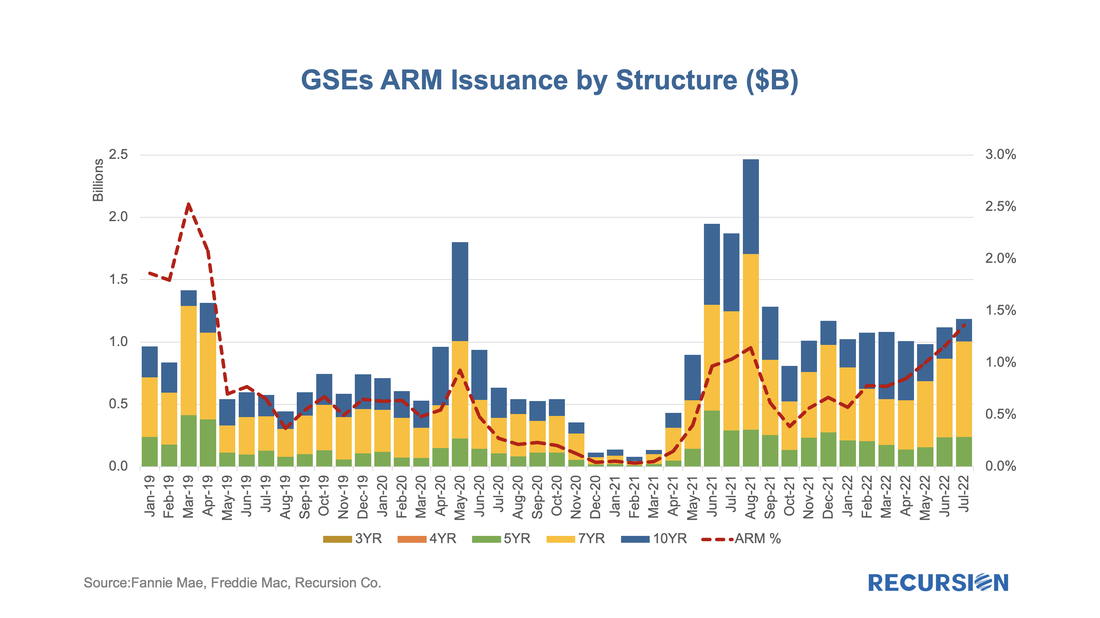 In recent posts, we’ve been tracking the progress of loans coming out of forbearance into various pool types such as Reperforming (RG), Extended Term (ET) and, even Private Label pools[1]. A different perspective can be obtained by looking at the disposition of loans with partial claims. Recall that a partial claim occurs when a borrower with missed payments can resume making payments but does not have the resources to increase payments to compensate for the balance missed. In general, the missed payments are placed into a subordinate lien that comes due when the mortgage is extinguished. It is important to note that a partial claim is not a modification, and a loan with a partial claim does not have to be in a forbearance program. Recently, Ginnie Mae announced that they would disclose the share of loans in pools with partial claims[2]. Below find a summary table of these results reported first ever as of April, 2022 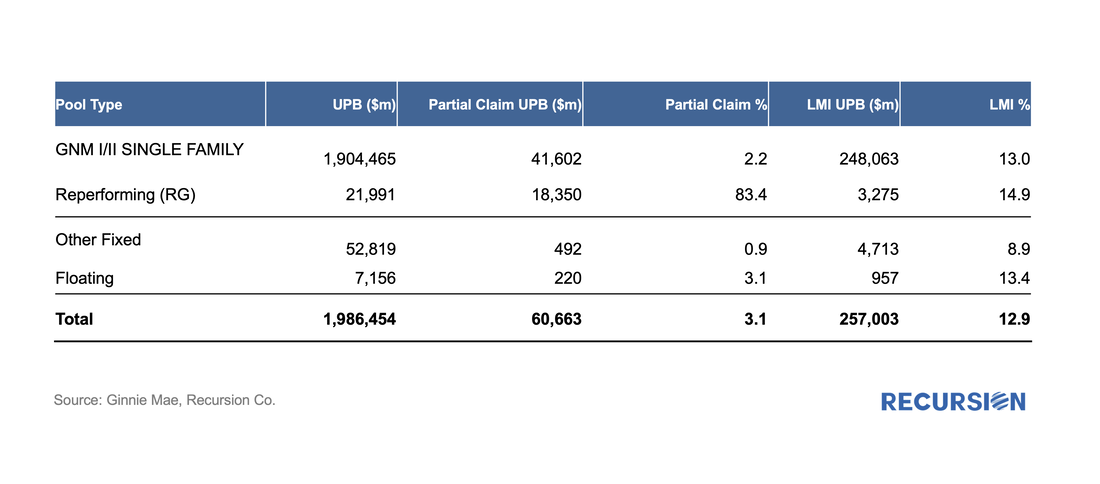 On March 24, the CFPB released HMDA data for 2021[1], with results obtained from 4,316 reporters, little changed from 4,472 reporters in 2020, but well below the 5,505 respondents reached in 2019[2]. There are yet more companies are expected to report to 2021 HMDA. However, our experience from previous year indicates little change in big picture when reporting is finalized. The drop reported in the number of reporters in 2020 vs 2019 is largely due to a reduction in the number of loans that a bank needed to underwrite, requiring a report to be filed starting in 2020. This data is used for market sizing by regulators and market participants, but it also represents a treasure trove of information regarding lender and consumer behavior across a wide variety of economic and market regimes. 2021 was notable for being the second year of the Covid-19 pandemic, which is associated with expansive monetary and fiscal policies and surging house prices. This report will briefly assess trends across a variety of topics. Market Activity After surging by 47% in 2020 to 24.8 million from 2019, the number of loan activities reported in 2021 HMDA ticked up by just 2% to 25.2 million, almost 40% below the record high 41.5 million attained in 2003. Similarly, the number of loans originated reported in 2020 jumped by 57% from the prior year to 14.2 million, while in 2021 the figure rose by only 3% to 14.6 million, down by about one-third from the 2003 peak of 21.4 million. 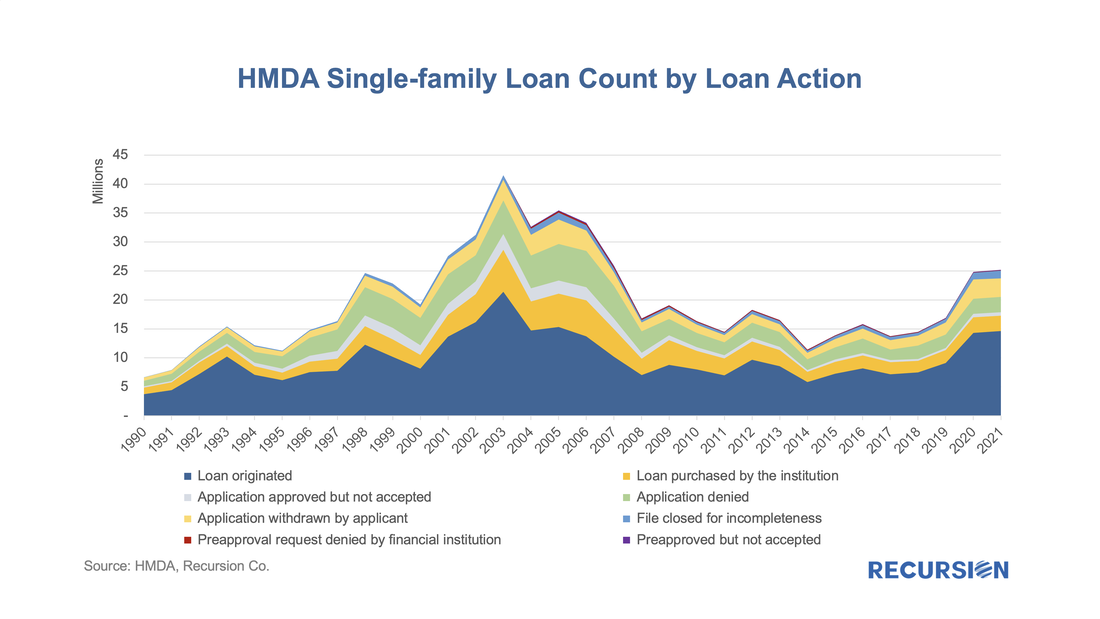 A curious policy development this year has been the stop-start approach towards the imposition of caps on the GSE’s regarding their purchases of loans backed by non-owner occupied (NOO) residences. In January the Treasury and FHFA amended the Enterprise’s Preferred Stock Purchase Agreements (PSPAs) to limit their acquisitions of single-family mortgage loans secured by second homes and investment properties to 7% of single-family acquisitions over the preceding 52-week period[1]. In September these caps were suspended[2]. Below find charts of the shares of second homes and investment properties out of all purchase mortgage deliveries to Fannie Mae and Freddie Mac, along with supporting fundamental factors. 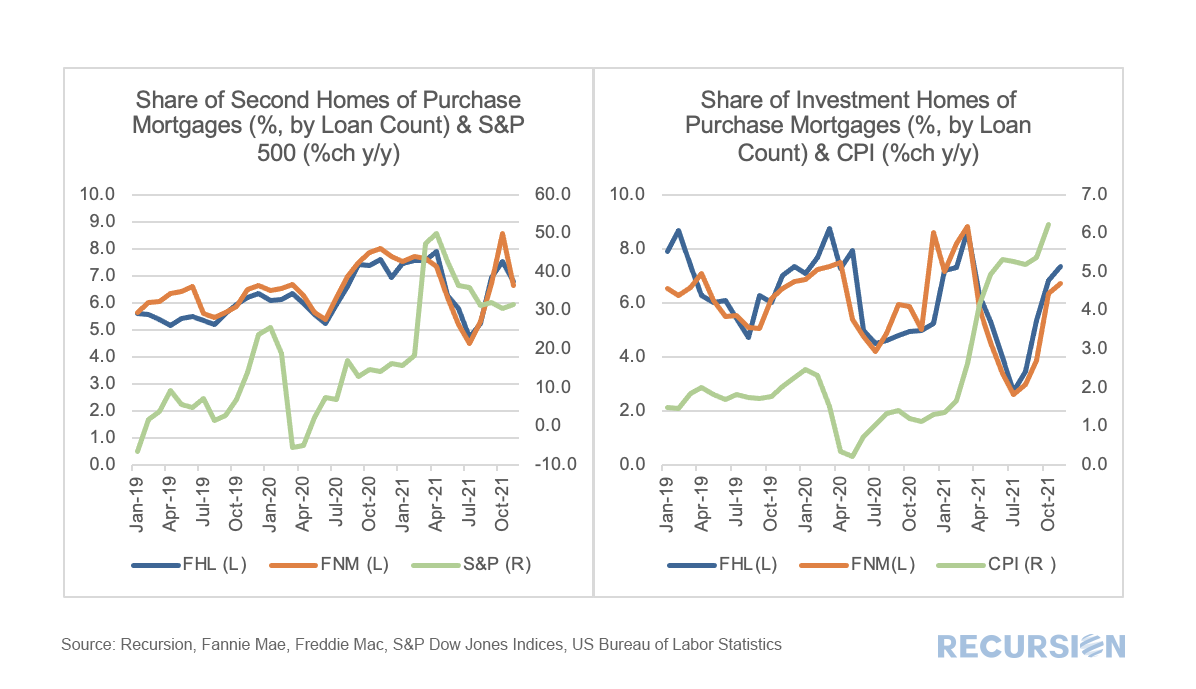 In both cases, there was a drop in the shares in the NOO categories after the initial policy announcement this year followed by a rebound in recent months. With regards to the fundamental factors, in the case of second homes, the share of purchase mortgages rose from about 6% to 8% following the onset of the pandemic as households sought refuge from densely populated areas. According to the National Association of Realtors, more than 50% of second homes are all-cash transactions, suggesting that the equity market is more important than earned income in driving these buying decisions[3]. Of course, the data used here come from loans in Agency pools, but the performance of the equity market likely has a significant influence on buyer sentiment in this market segment. The recent acceleration of consumer prices is likely supporting the sales of homes purchased for investment purposes, as real estate is widely seen as a hedge against inflation, in part because mortgage payments will not rise if the purchase is financed with a fixed-rate mortgage. Once again, we have a case where optimal investment decisions are driven by detailed knowledge of a combination of policy and fundamental factors. Loan-level digital tools are essential in drilling down to the level needed to formulate successful strategies. Financial support for rural communities has been a feature of US economic policy since the Farm Credit System was established as the first GSE in 1916[1], sixteen years before the Federal Home Loan Banks were established in 1932[2]. This support continues to this day and has expanded to encompass additional programs. Ginnie Mae Program While the best-known collateral for Ginnie Mae securities is loans underwritten through the FHA and VA programs, another form is loans underwritten by the US Department of Agriculture Rural Development (RD) Program, launched in 1990 as part of the Farm Bill passed that year[3]. The Single-Family Direct Home Loan Program[4] in particular is designed to provide payment assistance to low- and very-low-income households in rural communities. Of course, FHA and VA provide loans in rural areas under the terms of their programs as well. GSE Rural Lending Single-family lending at Fannie Mae and Freddie Mac was handed a mandate to provide liquidity to rural communities through the adoption of the Duty-to-Serve provision of the HERA Act enacted in 2008[5]. This program requires the GSE’s to engage in activities to facilitate liquidity in three underserved markets:
A key feature of this regulation is that FHFA has provided new datasets and tools to enhance the analysis of these markets[6]. In particular, Rural Areas FHFA's Duty to Serve regulation defines "rural area" as: (1) a census tract outside of a metropolitan statistical area, as designated by the Office of Management and Budget; or (2) a census tract in a metropolitan statistical area, as designated by the Office of Management and Budget, that is outside of the metropolitan statistical area's Urbanized Areas as designated by the U.S. Department of Agriculture's Rural-Urban Commuting Area Code #1, and outside of tracts with a housing density of over 64 housing units per square mile for USDA's RUCA Code #2. Below is a link to the specific geographies which meet the Rural Areas definition. Using this segmentation, we are now in a position to load their definition into our databases and look at trends in this market segment. Using HMDA data as a base, we produce the following chart[7]: 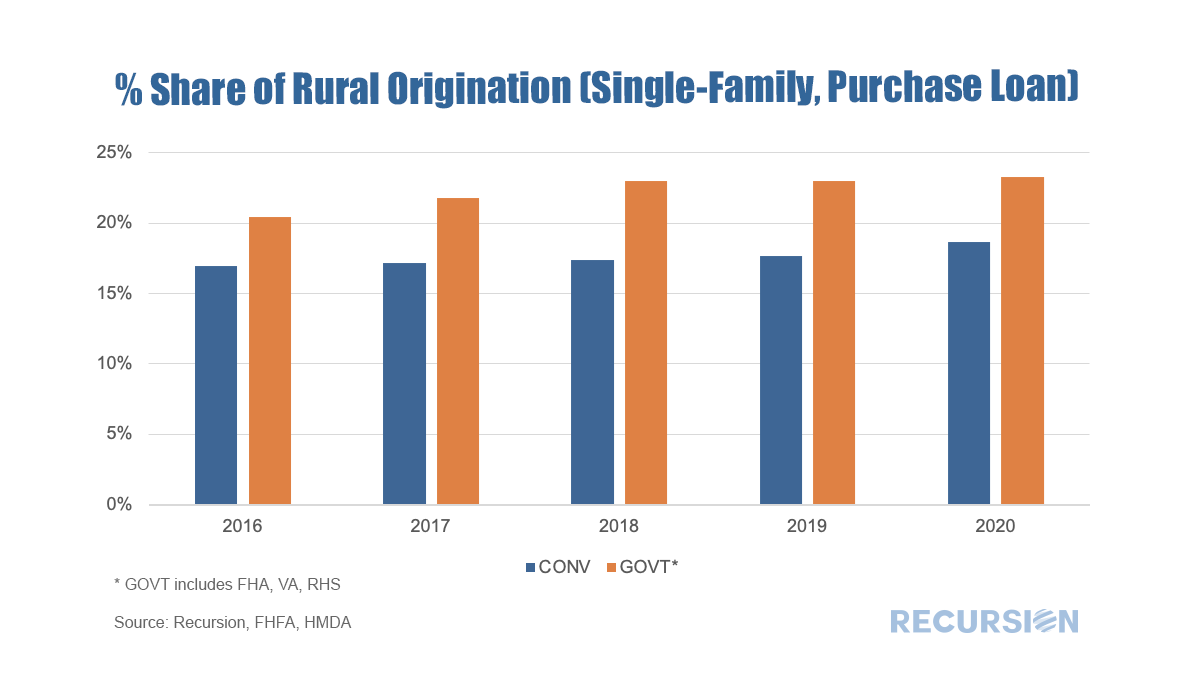 As we have commented several times, the Federal Reserve Z.1 data is a fine source of information on long-term financial market trends. This post looks at trends in ownership of single-family mortgage risk. The chart below shows this distribution from Q1 2007 to Q3 2020: 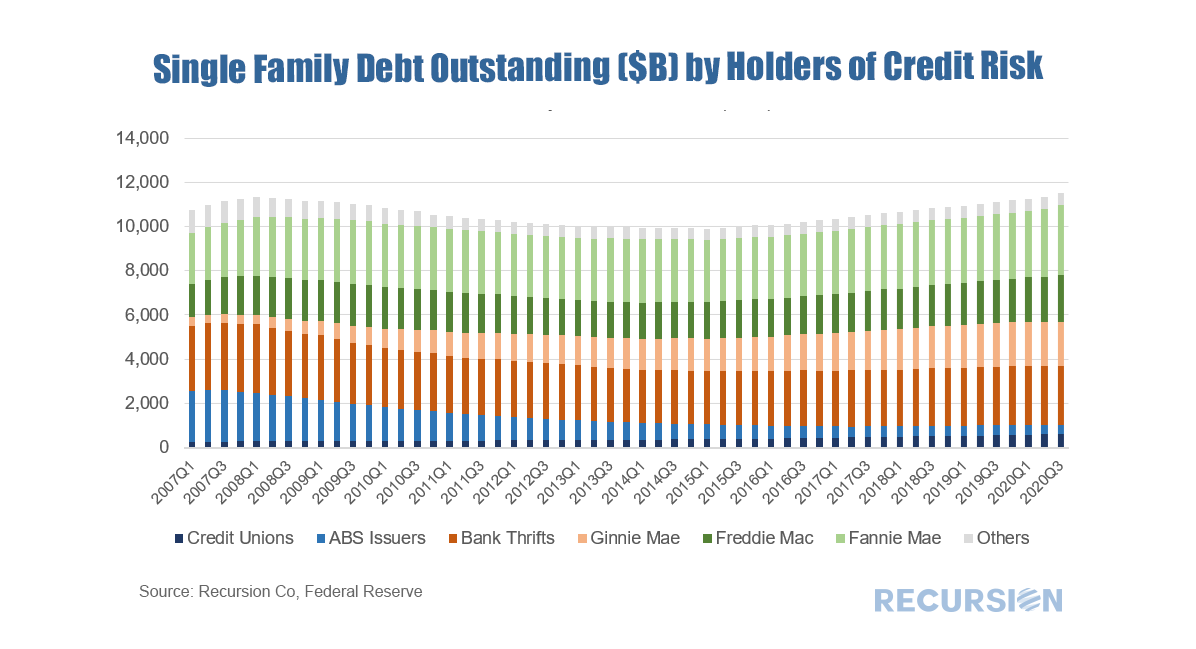 |
Archives
February 2024
Tags
All
|
 RSS Feed
RECURSION |
|

Copyright © 2022 Recursion, Co. All rights reserved.