|
Updates of the Federal Reserve Financial Accounts (Z.1) data[1] always provide food for big-picture thoughts and the recent release of Q32020 data is no exception. Here is a look at the recent trend in holdings of MBS by sector: 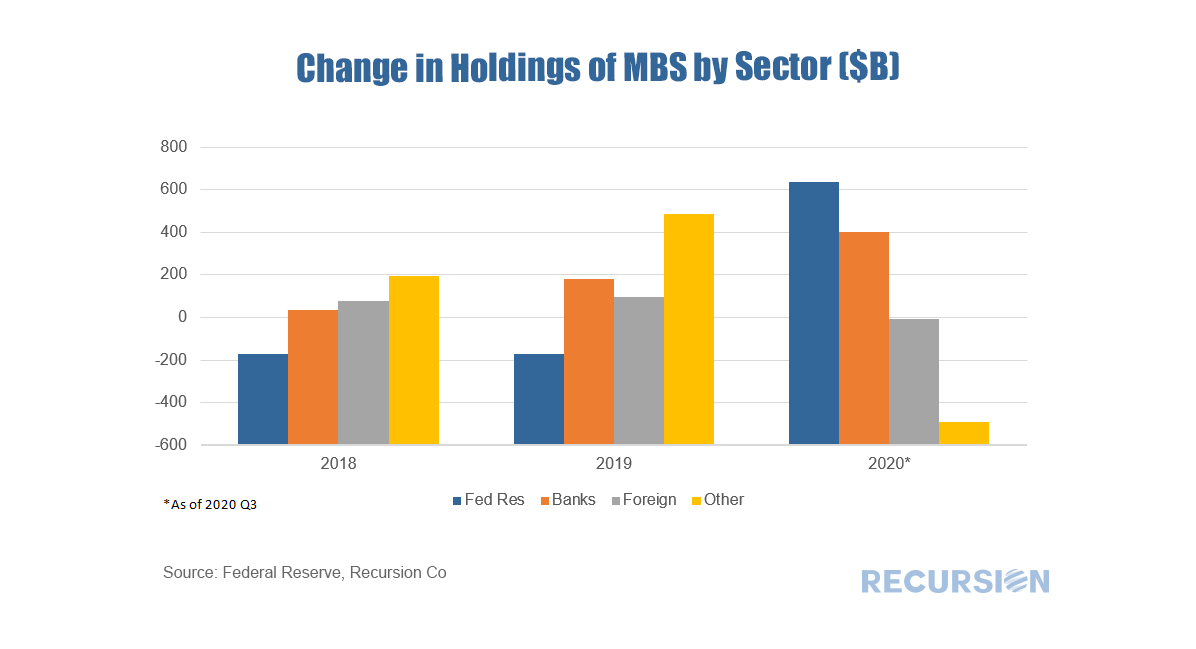 While the single-family housing market is booming, the trend in the multifamily market is much more nuanced. Over the 3 ½ year period from July 2017 to December 2020, new supply as measured by housing starts was in a steady-to-modestly rising trend. This changed with the onset of the Covid-19 pandemic: 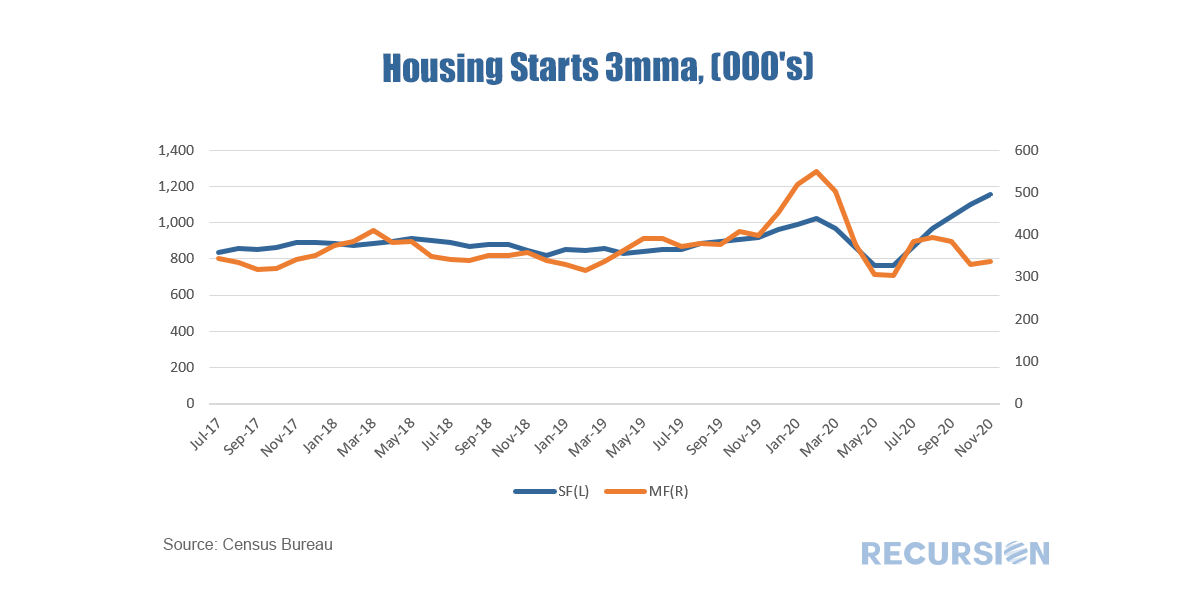 Unlike the situation during the Global Financial Crisis, imbalances in the housing market are not the root cause of the Covid-19 economic downturn. Instead, housing is helping to pull the economy out of its pandemic-induced swoon. House price rises have accelerated, due both to low interest rates, as well as to household relocations away from high-density areas. This is leading to increased construction, and improved household balance sheets. Moreover, a surge in refinances improves household cash flow. How long can this trend continue? The answer to this question depends crucially on many varied policy settings that influence lender and borrower behavior. The chart below shows 1-month CPR for 30-yr MBS securities broken down between the 30-Year GSEs and 30-Year FHA for the 2017cohort. A number of fundamental and policy factors come into play. 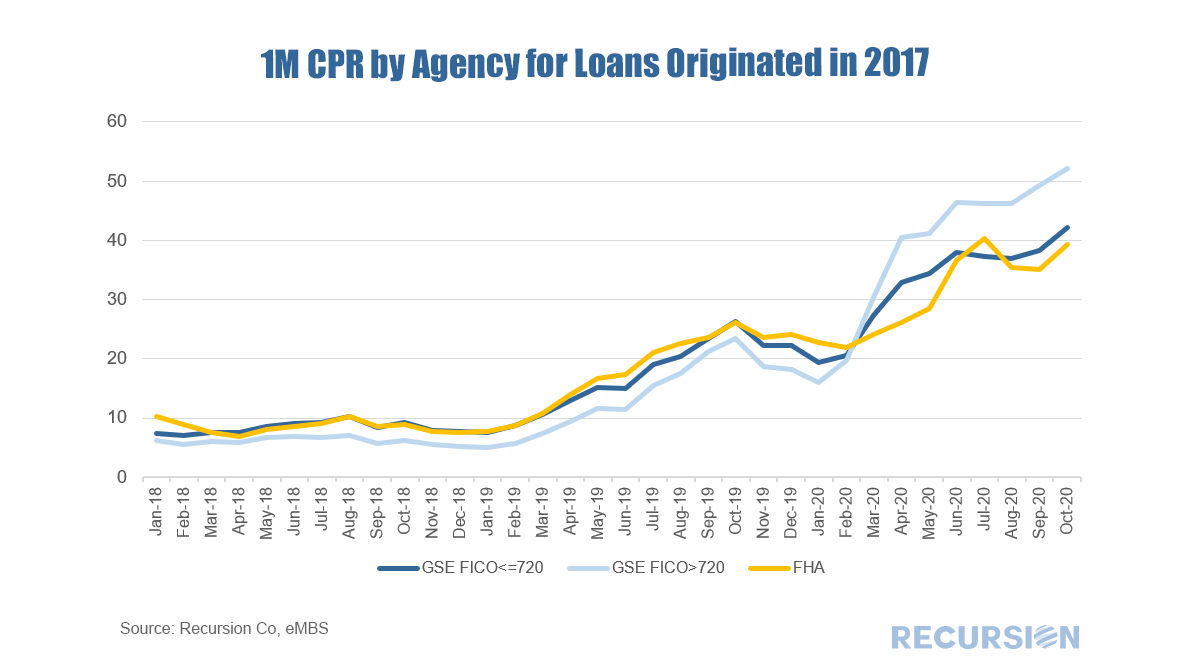 Our monitoring of the US housing and mortgage markets tends to focus on details obtained from a micro view of the market. This post takes a quite different perspective of treating the US as a single point across an international perspective. This is part of a long tradition in economics, including at the Federal Reserve[1], but is used infrequently as the market focus is generally directed more narrowly. But interesting patterns do emerge by stepping back and taking a big picture view. For example, here is a scatter diagram of cumulative real house prices vs GDP from 2010-2019 for 45 countries using data from the OECD. 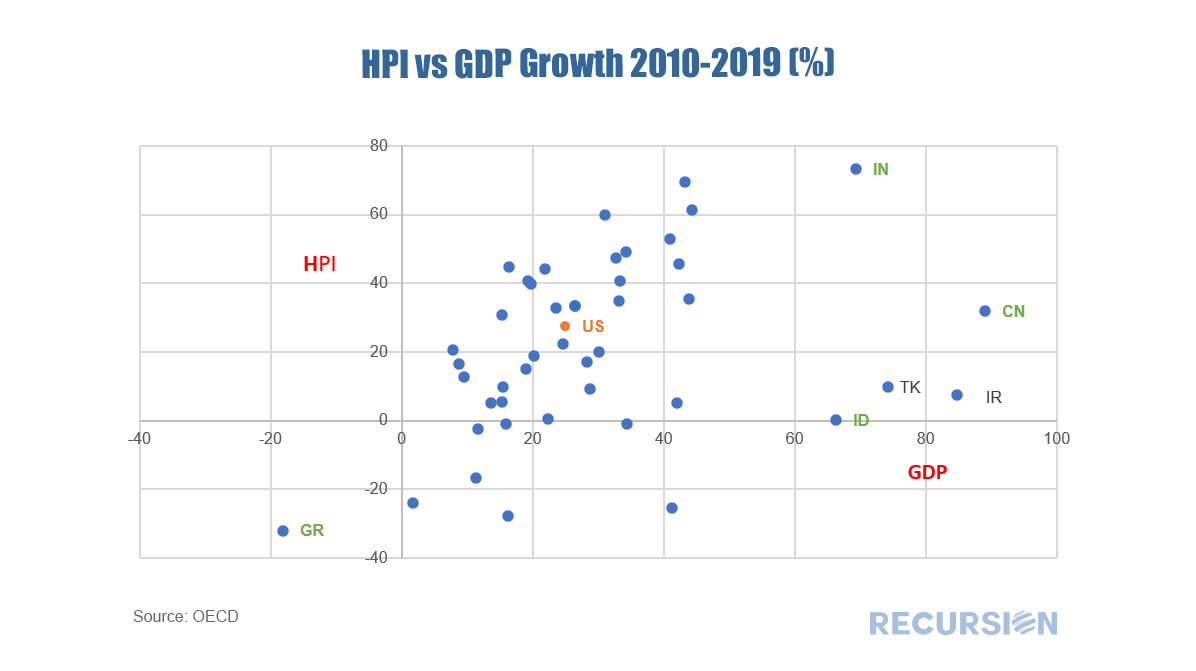 In a previous post[1], we noted that a key component of the implementation of unconventional monetary policy is the selection of coupons in its MBS purchase programs. As coupons in these securities occur only in steps of 0.5%, obtaining liquidity in new lower coupons is important in establishing a basis for mortgage rates to move lower. For example, 2.5% 30-year coupons were issued in 2013 and 2016, but never to the extent that liquidity was firmly established, limiting declines in the rate that borrowers paid at those times. This changed dramatically with the onset of the Covid-19 crisis. In March 2020[2] the Fed restarted its MBS purchase program after six years, including the 2.5% coupon, and this soon became the dominant coupon. 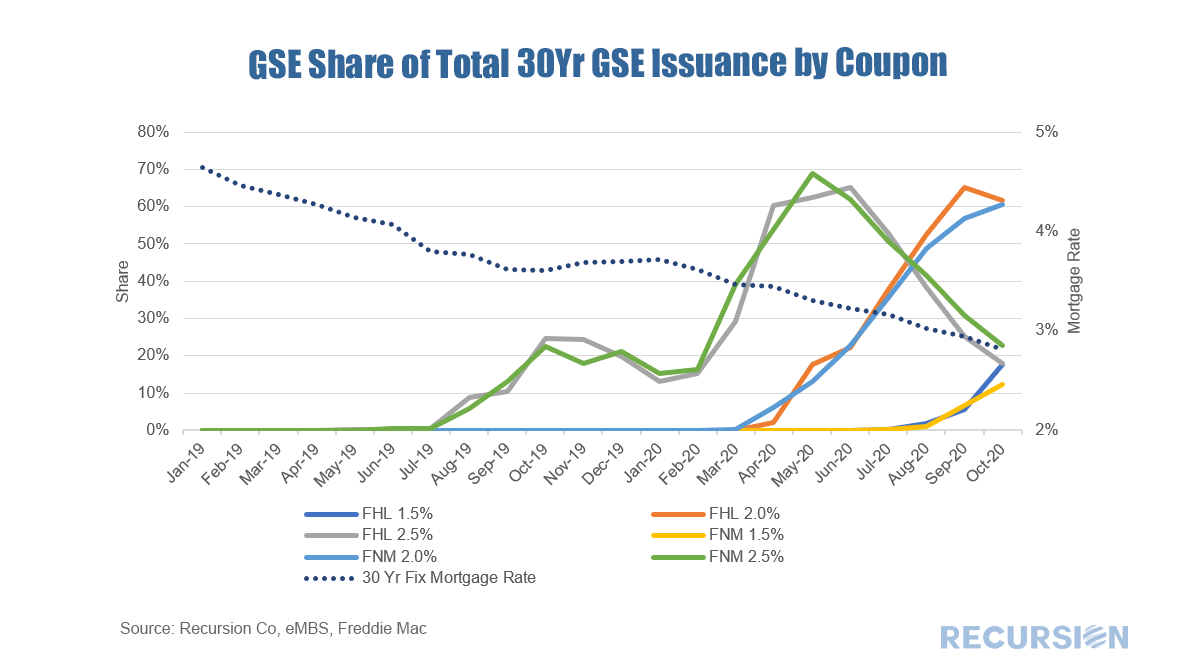 Since that time, the Fed has picked up its activity on this front. The GSE’s started issuing 2.0’s shortly after the crisis hit, and the Fed began buying them in May. Then 1.5% came on the scene this summer and this week sure enough the central bank validated this activity by adding them to their portfolios[3]. Can 1.0’s be far behind? The millennial generation has reached peak home buying age, covering a range of about 25-40 years old. Just this year this cohort at 72.1 million passed the baby boom generation in sheer size[1] although this is a bit less than the 78.8 million peak reached by boomers in the late 90’s[2]. Millennial presence or lack of it in the housing market has been the subject of voluminous commentary, ranging from extreme optimism derived from the magnitude of the population bulge to caution related to affordability and impediments to building savings stemming from student loan debt[3] and high rental and child care costs[4]. What can big data tell us about this? A 2018 study by the Federal Reserve showed that Millennials had lower incomes and assets and higher debt than previous cohorts at a similar age[5]. Our data sets can provide some useful, but far from conclusive, insights into these trends since the onset of the Covid-19 pandemic. Covid-19 is both a cyclical and structural shock. On the cyclical side mortgage rates have fallen to record lows as the Federal Reserve responded quickly and decisively to the health crisis. On the structural side, residents of urban areas have picked up and fled to less dense locations, resulting in a sharp increase in house prices nationally. According to Redfin these price gains have been led by those in rural and suburban areas, rendering these areas less affordable, while urban areas remain out of reach for most. 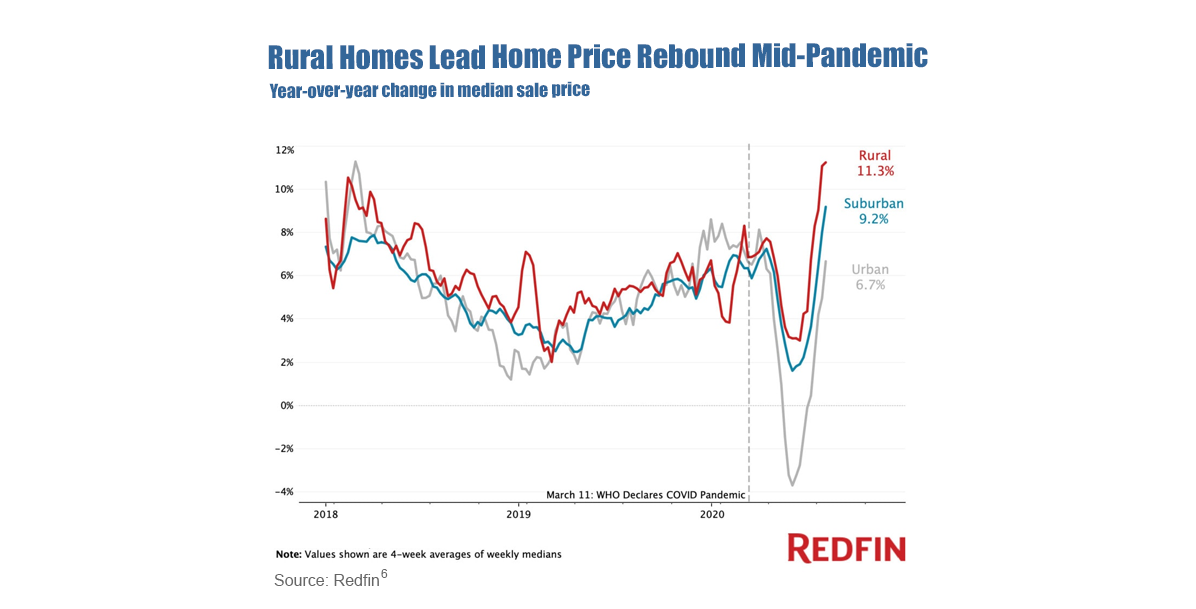 New research by Yihai Yu at MSCI shows that historically high mortgage paydowns and price premia related to the Covid-19 crisis creates a situation where MBS securities could exhibit negative durations.
https://www.msci.com/www/blog-posts/can-mbs-duration-turn-negative/02108224451 This unusual situation arises because the extremely fast prepayment speeds can exceed the price impact of lower yields. This nuanced observation relies on careful calculations of the dollar amount of paydowns derived from Recursion data. The Federal Reserve recently released its quarterly Z.1 report: The Financial Accounts of the US (formerly known as the Flow of Funds) for Q2 2020. This voluminous dataset contains very detailed information describing financial flows and stocks across all major segments of the economy. For our purposes the key chart is the distribution of holdings of Total Long-Term Agency Debt (Agency MBS + Agency notes and bonds): 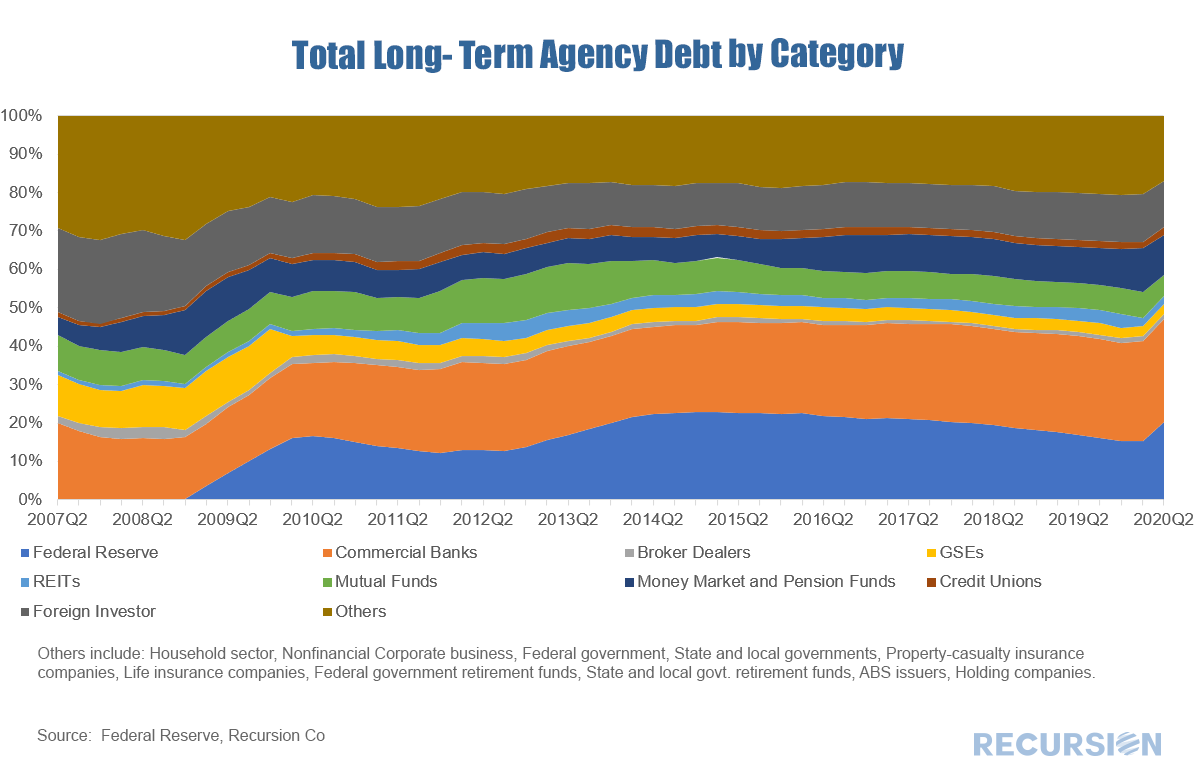 The clear takeaway for Q2 is the central bank gained share as it took unprecedented actions to stabilize the financial system in the wake of the Covid-19 crisis. The Fed’s share of the stock of Long-Term Agency Debt jumped by about 4.9% from Q1 to Q2, a record high increase. The biggest losing category was “Others” which fell by 3.6%. This loss came largely from the household subsector within this category. The “Commercial Banks” share rose by 0.9%, but this does not necessarily imply greater appetite for mortgage risk as depositories are increasing their securitization rate by swapping whole loans for securities[1]. Finally, the “Foreign Investor” category lost 0.5% to a 7-quarter low. |
Archives
July 2024
Tags
All
|
 RSS Feed
RECURSION |
|

Copyright © 2022 Recursion, Co. All rights reserved.