|
The Covid-19 pandemic has resulted in a great economic shock that has been met with a tremendous policy reaction in the form of interest rate cuts and MBS purchases by the central bank. Prepayments have picked up substantially during the year. The question arises as to whether the magnitude of the response is unusual compared to previous episodes of rate declines, and whether they can rise further should borrowing costs fall further. The magnitude of the relationship between rates and refis is complex and depends crucially on a number of factors. First, the relationship is path-dependent. That is, it doesn’t just matter if rates fall 1.0%, but whether this decline takes rates to new lows so that the biggest possible set of borrowers can profitably refinance. Great gobs of sophisticated statistics and modeling go into forecasting prepays on the part of lenders and investors. But a look at prepays over time shows three main waves of refis over the past 20 years. The first (A) is 2000-2003, (B) 2008-2013, and (C) 2019-2020. In all three instances, rates reached new lows. The dates correspond roughly to the times when the mortgage rate broke to a new low until a new trough was formed (or the present in the case of “C”) 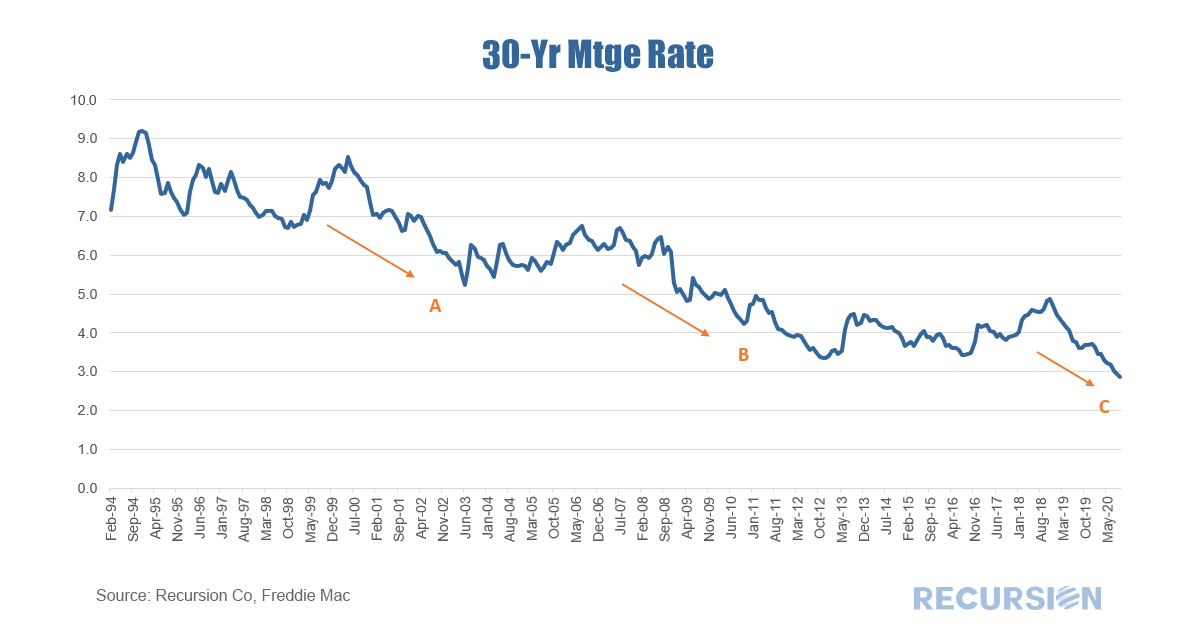 Here are the corresponding periods for prepays: 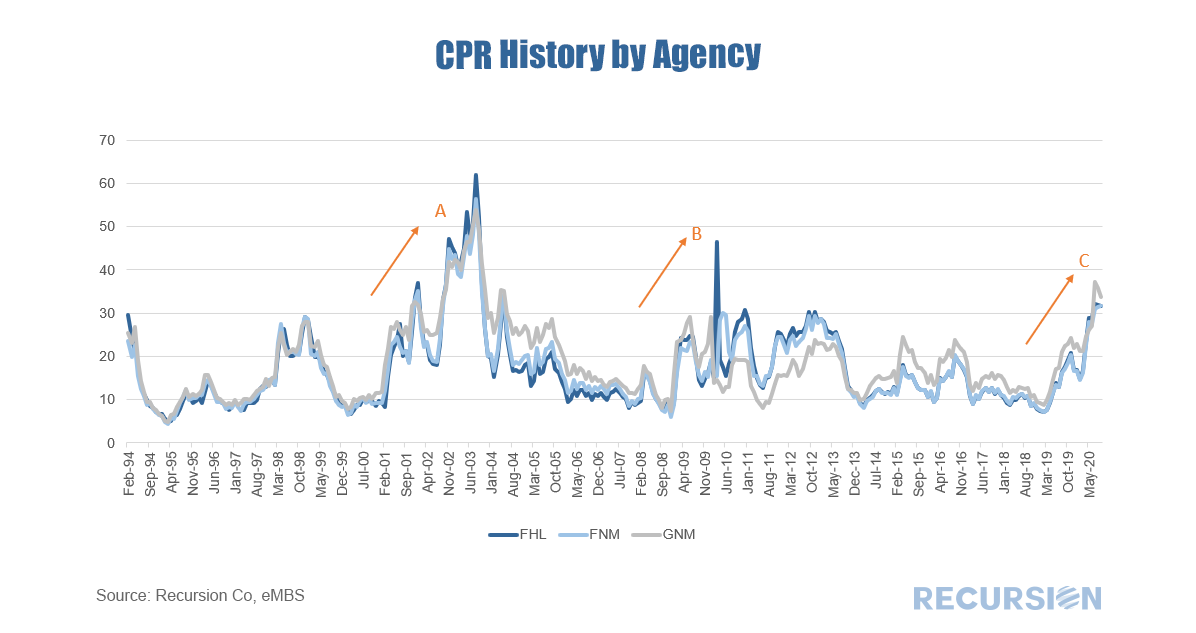 Here are the corresponding periods for originations: 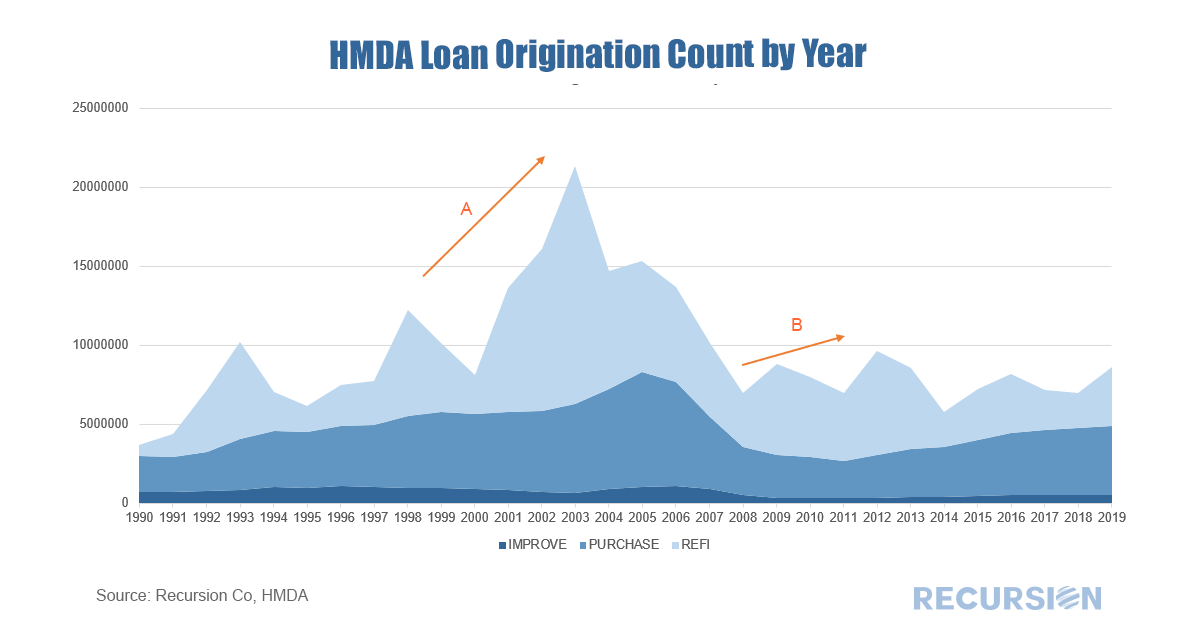 Here is a summary of the three periods: 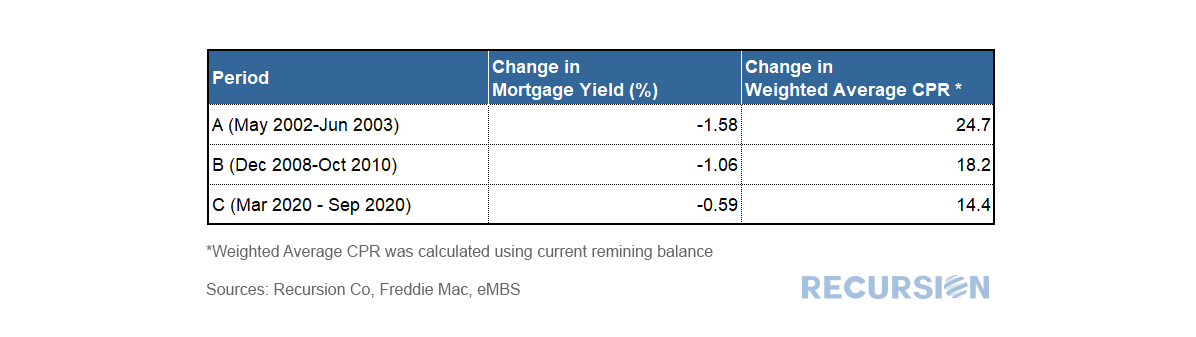 Notably, the biggest jump in prepays occurred in the early 2000s, reaching a record high of 60 CPR. Rates had fallen substantially based on aggressive Fed ease in the wake of the bursting of the tech stock bubble. This passed right through to refis. There was also a substantial decline in rates with the Global Financial Crisis(GFC), but the refi response was more muted due to declining house price, but perhaps also more stretched out in time (off and on through 2013). The current episode with Covid-19 has resulted in record-low mortgage rates, and a substantial spike in refis, but still well below the experience of 2002-04. What might explain the differences? A clear place to look is at credit conditions. If rates drop the same amounts in time periods X and Y, but credit conditions are tighter in Y than X, we can reasonably expect a bigger refi impact in X than Y. Below shows the Urban Institute’s Housing GSE Credit Availability Index, which is used to evaluate lender’s risk tolerance: 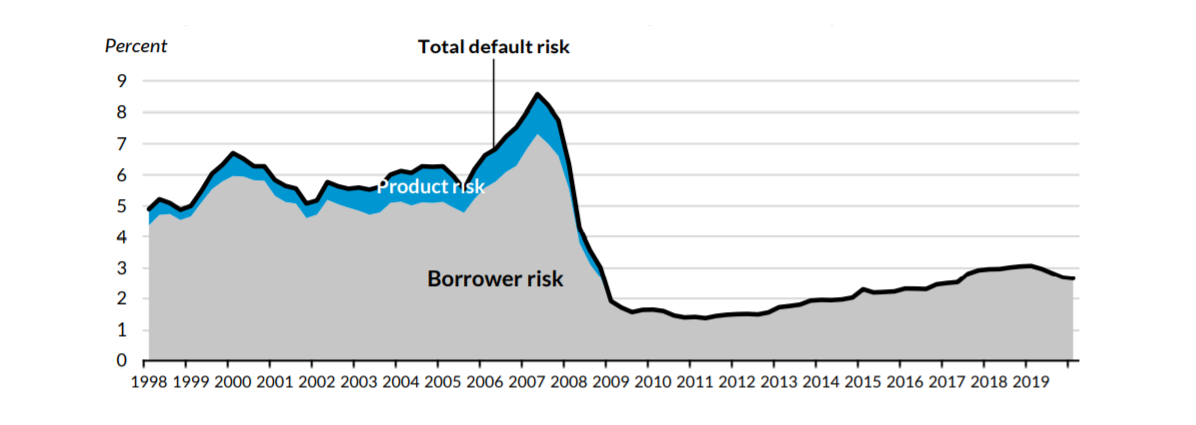 Note: Urban Institute’s Housing Credit Availability Index for GSE Chanel. Adapted from Urban Institute Housing Finance at a Glance (August 2020). (https://www.urban.org/research/publication/housing-finance-glance-monthly-chartbook-august-2020)
As can be seen, credit was extremely loose before the GFC, very tight thereafter, followed by a period of modest loosening until 2019. This correlates well with the magnitude of the response of prepays to interest charges in the three regimes. Too hot, too cold and just right? Maybe. All of this is important not just for investors but for the central bank as the Fed attempts to steer the economy through this uniquely uncertain period. Recently, credit conditions appear to have started tightening. It’s unclear whether this is a “normal” market reaction as volumes rise and capacity is constrained (good credits are easier to process) or whether lenders are becoming more cautious based on a more pessimistic view of the economic outlook. There is a big difference between the two in terms of choosing a successful investment strategy or an optimal monetary policy. The answer is unlikely to come from attempts to model borrower and lender behavior in a nuanced way and more likely to be discerned by careful observation of emerging trends in big data sets. The MBS market is the second-most liquid market in the US after the Treasury market. The collateral for these securities is completely domestic but a significant share of the ownership is held by offshore entities. As such, investors need to be cognizant of the attitudes of overseas investors towards this market, particularly in the current highly charged geopolitical climate. The following chart shows total holdings of Agency and GSE-backed securities over time broken down by a broad category of investors. The most recent figure is as of Q1 2020; Q2 data will be released later in September. 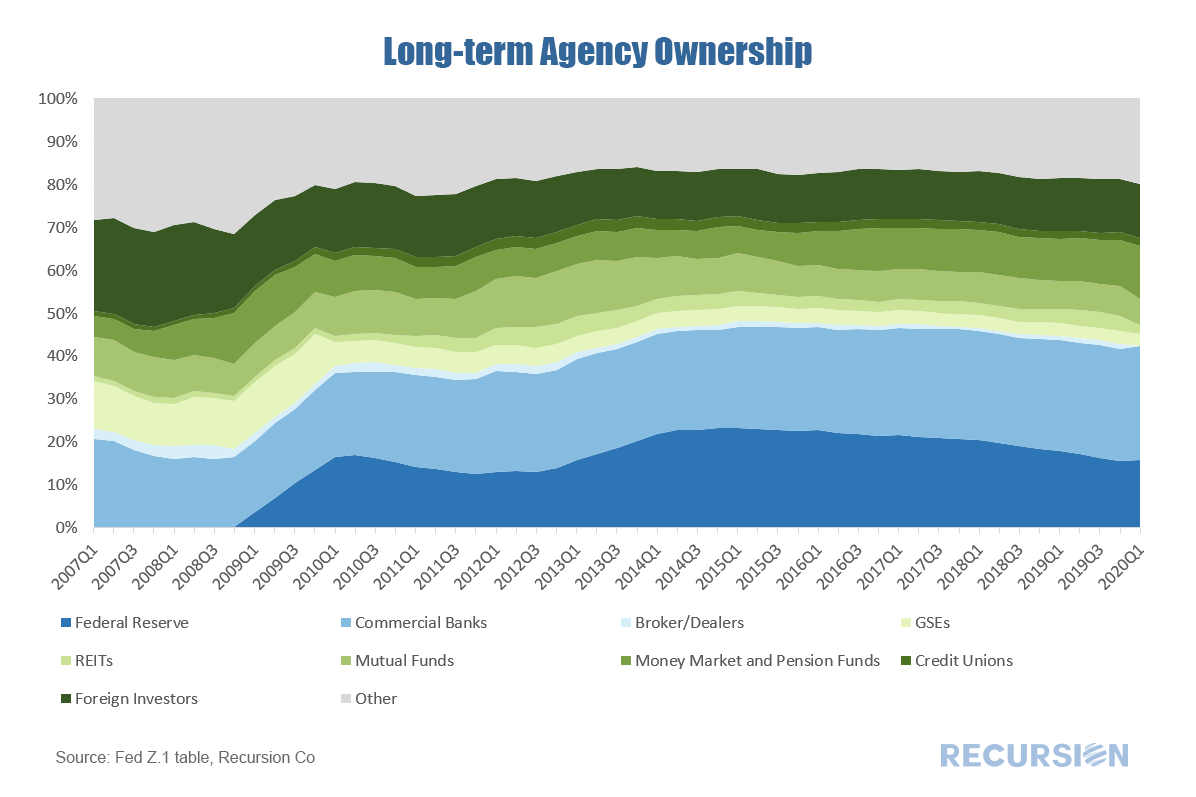 One of our major rules at Recursion is that we are a fintech data and analytics company and that we don’t give investment advice. So spoiler alert: the answer to the question is that anything is possible. But we noticed in the most recent weekly Freddie Mac survey that the 30-year mortgage rate edged up to 3.01% from a record-low 2.98% the prior week, the first sub-3.0% level ever recorded. Market lore says that at a certain level, rates give lenders sticker shock and mark a point below which they are reluctant to venture. In an early blog post we noted that mortgage rates were at record lows, but that Treasury yields were deeper into record-low territory, so mortgage spreads were actually quite wide[1]. Mortgage rates are set in the market reflecting offsetting pressures including: downward pressure from Federal Reserve purchases, upward pressure from record demand, and the costs of forbearance borne by servicers that they seek to recoup with higher margins on new business. Below is an update to the March chart with a new variable added: the inelegantly named OPUC: 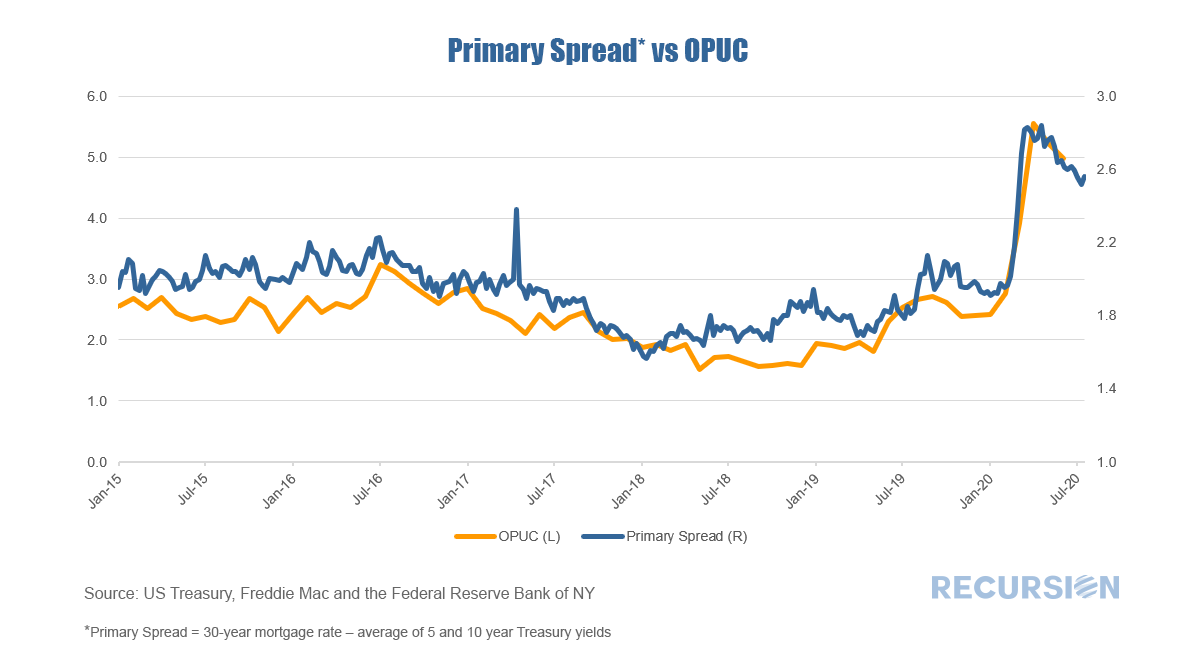 We previously noted that the recent surge in bank deposits, that is related to rising risk aversion associated with the onset of the Covid-19 crisis, serves to support bank investment in agency Mortgage Backed Securities (MBS)[1]. A look at recent Federal Reserve Board data reveals that growing MBS demand is not just the result of greater deposits, but also is due to a desire on the part of depository institutions to reduce risk in the mortgage space. 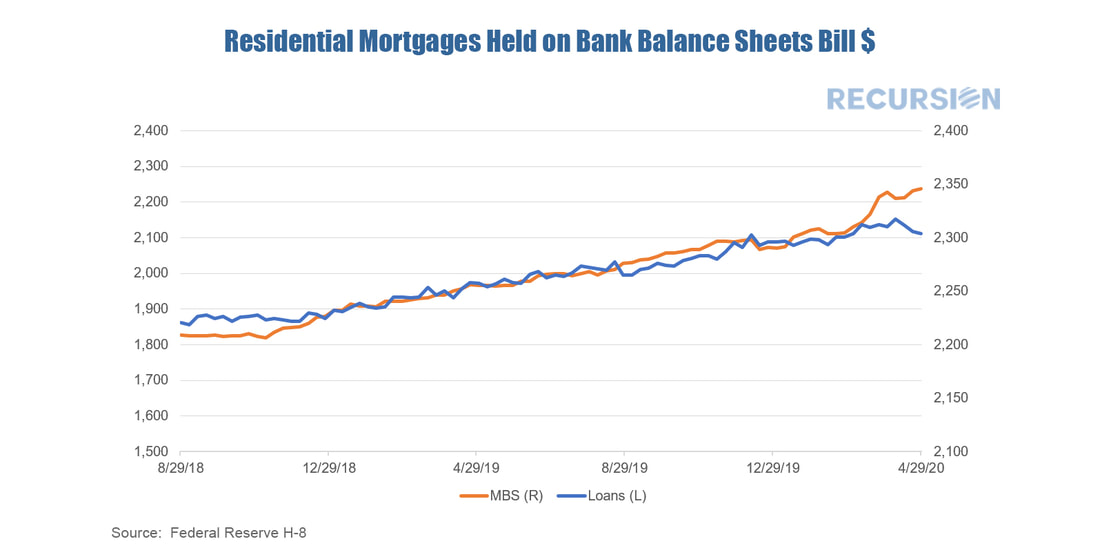 April mortgage deliveries by the agencies Fannie Mae, Freddie Mac and Ginnie Mae showed a rise in deliveries of mortgages to the two agencies for both home purchases and refinances. Purchase mortgage volumes reflect a normal seasonal pattern, while refinances experienced a sharp spike upwards in response to low levels of interest rates. Given normal (and possibly growing) lags related to closing times, many of these contracts were signed in March when rates had already dropped sharply but the full impact of the Covid-19 virus on stay-at-home policies was not yet fully felt. 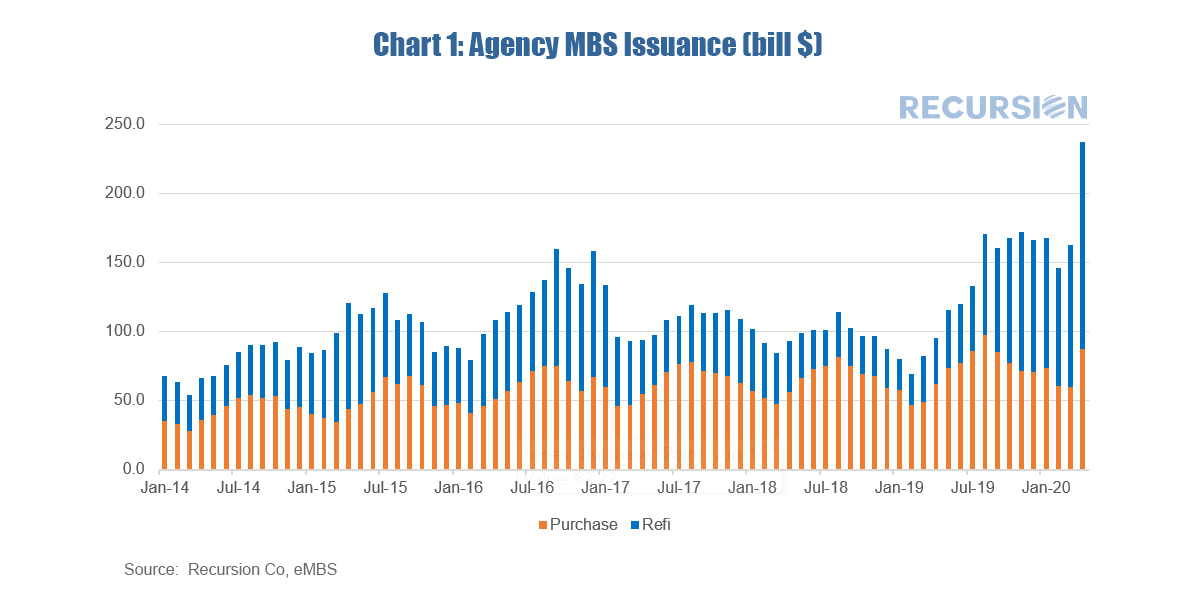 Just-released data from Freddie Mac is the first clear signal of distress in the conforming mortgage market. Data at the pool level for April 2020 showed a record high share of 30-day delinquencies (dq’s) of 3.735% for pools backed by 30 year mortgages. This data set goes back only to January 2011, so to get a reference to the Global Financial Crisis (GFC) we calculated the 1-month dq for 30 year mortgages from the Freddie Mac Loan Performance data set which goes back to 1999, although the most recent observation is June 2019. This dataset consists of a large sample of Freddie Mac loans but is not the whole universe. During the period of overlap there is a clear correlation between the two series. Finally, we overlay the insured unemployment rate to obtain a clear connection between the shock to the labor market from the Covid-19 virus and borrowers who have missed their mortgage payment. 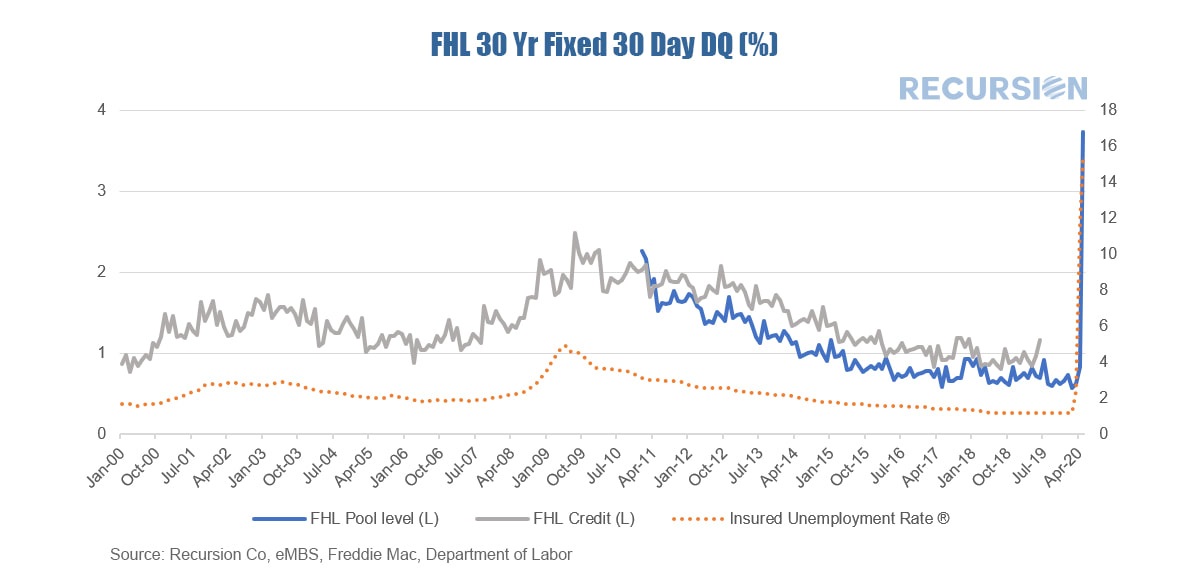 As noted in an earlier post[1] we discussed how the GSE’s have been sharing credit risk with private investors through the Credit Risk Transfer (CRT) [2]market. At that time, we discussed how losses tended to grow over time, and noted the significant geographical variation in default rates by state, reflecting local economic conditions. Another consideration noted along these lines is underwriting characteristics. This impact is particularly notable when comparing the performance of loans for lower-credit quality borrowers to others. The chart below looks at the relative performance in CRT high-LTV reference pools between those with FICO scores less and equal to 680 and those greater than that score: 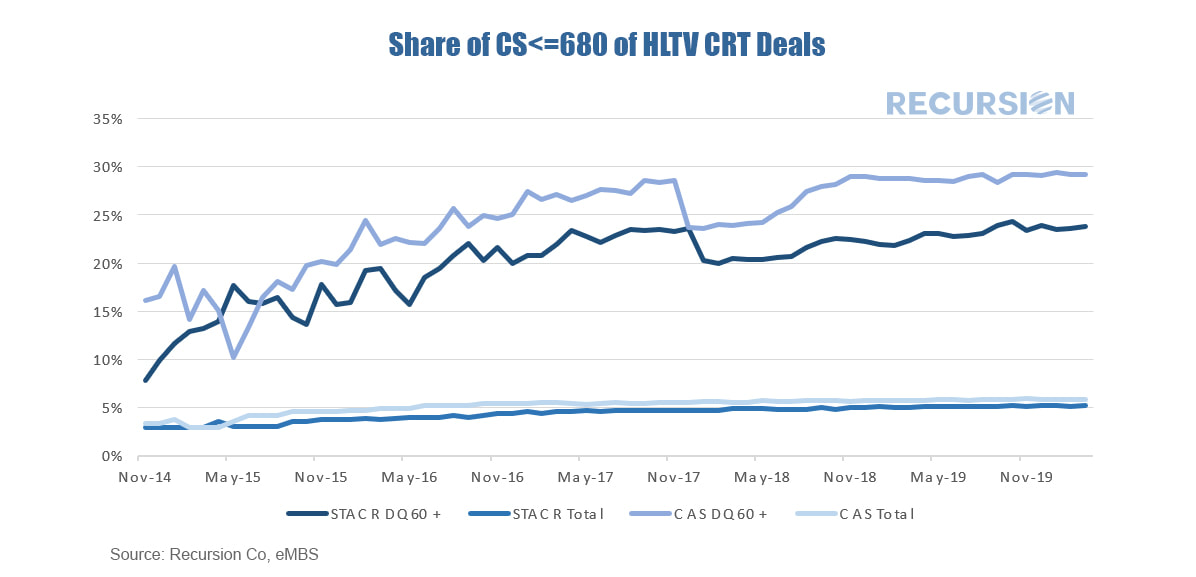 Recursion data featured in today's Commercial Mortgage Alert - Fed slows down purchasing siting market condition improves. 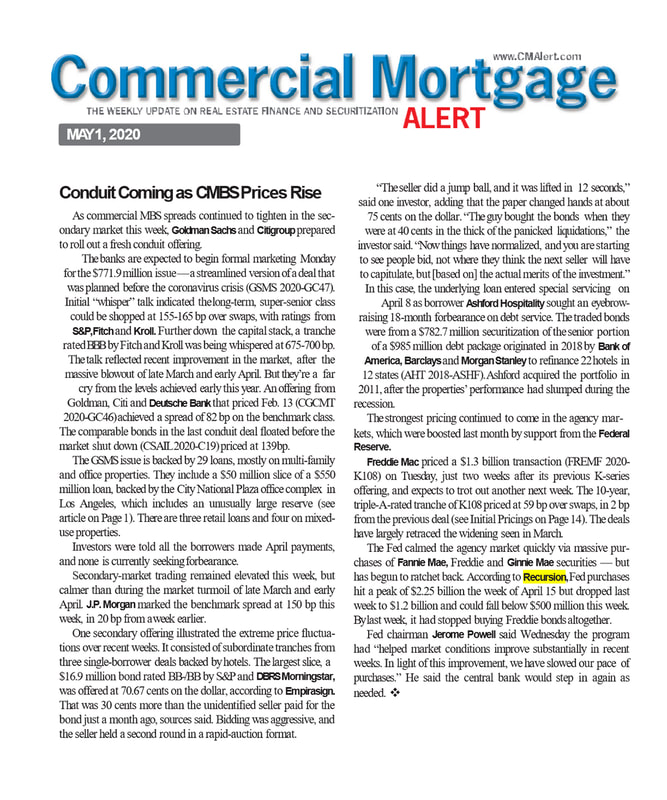 |
Archives
February 2024
Tags
All
|
 RSS Feed
RECURSION |
|

Copyright © 2022 Recursion, Co. All rights reserved.