|
In a recent post we established a correlation between the 30 day dq rate of the loans in the reference pools for the Freddie Mac High LTV STACR CRT program and the share of these loans with high indebtedness as measured by DTI>45 for the month of May[1]. Recently Fannie Mae released the corresponding data for its CAS program and the results are striking. First, the pattern of results we saw for STACR is confirmed. This can be clearly seen if the results of the two programs are overlaid one over the other[2]. 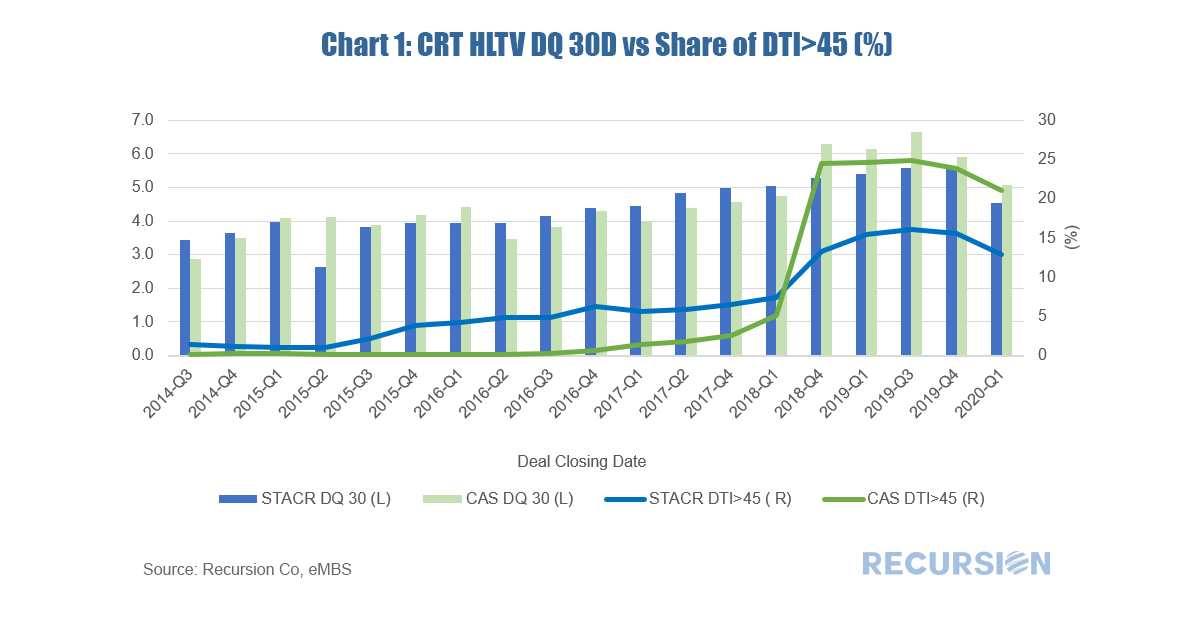 *The Chart 1 and Chart 2 can be duplicated using the following two queries
We received delinquency and forbearance information for the GSE pools late last night. By balance, the pools with such information cover over 99% of FHL and 92% of FNM pools, which is satisfactory. In terms of delinquency, Fannie Mae reported higher delinquency rate than Freddie Mac, which is in line with the relatively higher DTI’s seen in FNM deliveries in recent years. Freddie’s 30d delinquency rate reported in May was 2.47%, about 0.4% below the same figure for Fannie Mae .   We have written extensively on the mortgage market impact of the Covid-19 crisis, most recently on the first signs of delinquencies in the loans in the reference pools of the Freddie Mac Structured Agency Credit Risk (STACR) program[1]. In that post we noted the dispersion in 30-day average loan delinquencies by state for May 2020. In this note we look at the distribution of delinquencies in the same month across each of the 28 deals issued to date. We can see a distinct increase in the rate of delinquencies from the onset of the program through 2019, before falling early this year. What can account for this pattern? In the five-year period from early 2013 to early 2019, we notice that there was a trend loosening in credit standards as measured by the share of loans in Agency securitized pools with debt-to-income ratios in excess of 45. The trend was exacerbated in 2018 due to rising mortgage rates weighing on mortgage production volumes. As rates fell back during the course of 2019, pressure to keep lending standards so loose eased, and fewer high-LTV loans were delivered to the Agencies. 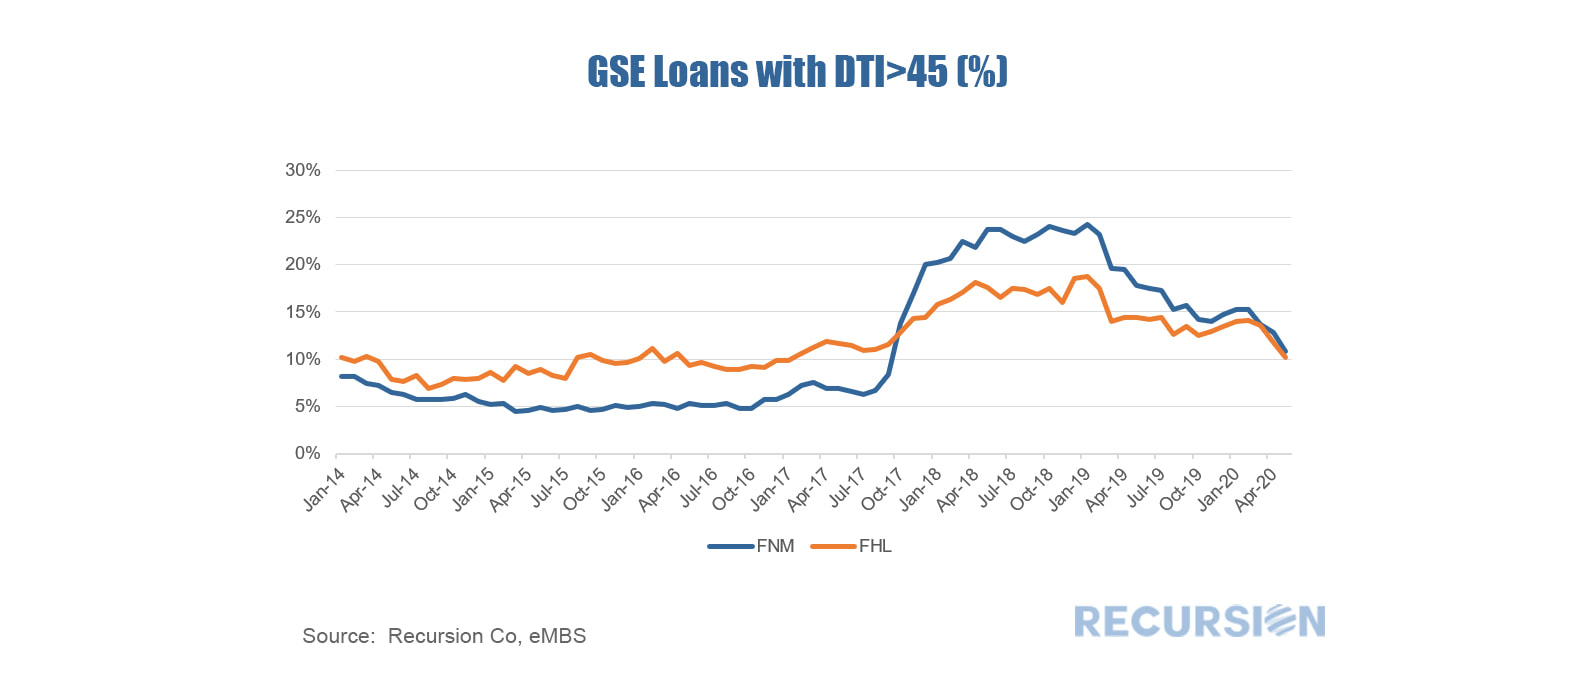 It seems natural to ask if this pattern spills over to the loans in the STACR pools. The chart below shows the share of such loans in high-LTV STACR issues since 2013, plotted against the 30-day May DQ rate for each.
As noted in an earlier post[1] we discussed how the GSE’s have been sharing credit risk with private investors through the Credit Risk Transfer (CRT) [2]market. At that time, we discussed how losses tended to grow over time, and noted the significant geographical variation in default rates by state, reflecting local economic conditions. Another consideration noted along these lines is underwriting characteristics. This impact is particularly notable when comparing the performance of loans for lower-credit quality borrowers to others. The chart below looks at the relative performance in CRT high-LTV reference pools between those with FICO scores less and equal to 680 and those greater than that score: 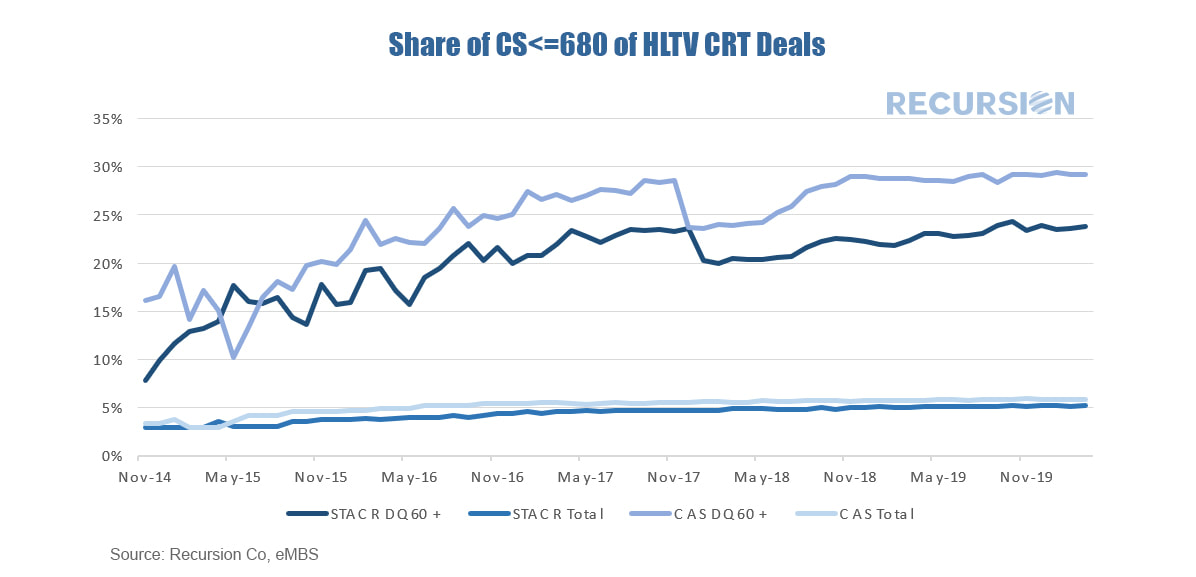 The Credit Risk Transfer (CRT) market was launched in 2013 by the GSE’s to help protect taxpayers from credit risk (risk of borrower nonpayment) by sharing mortgage losses with private investors. The market has grown substantially since that time, with the outstanding balance of reference loans reaching over $2 trillion at the end of 2019. Over this time, investors have largely been rewarded, as home prices have continued to rise and labor market conditions have been robust. Chart 1 shows these for the sixteen most recent high loan-to-value (LTV) Fannie Mae deals from their CRT program Connecticut Avenue Securities (CAS). 1. Cumulative Default Rate for CAS Securities 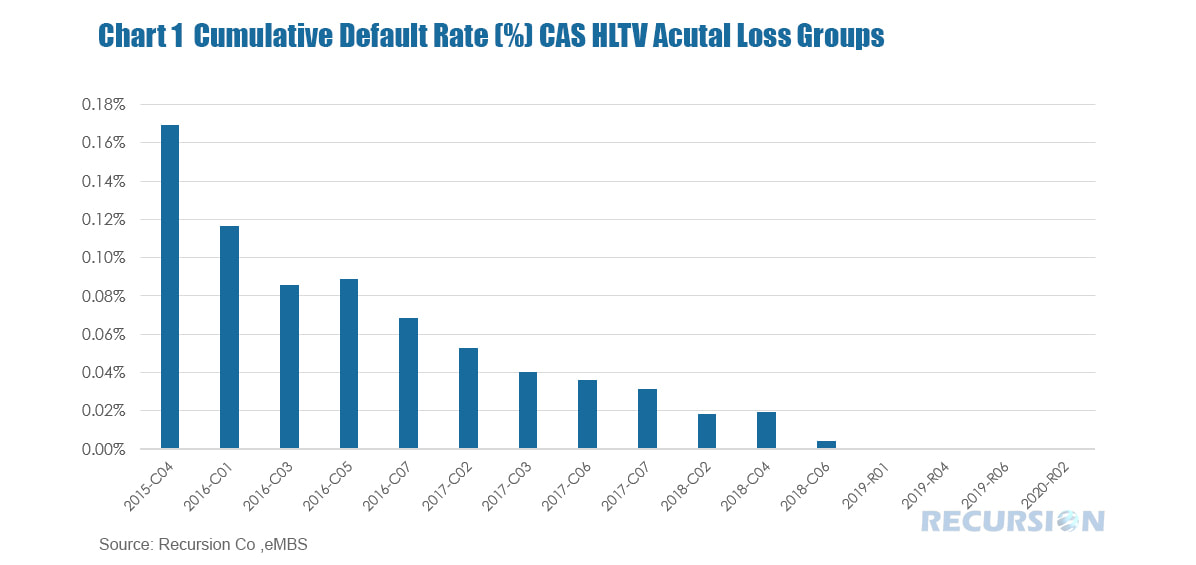 Preparing for the Delinquency Storm — Using Big Data to Track Portfolio Risk in the Mortgage Market3/27/2020
As US society goes deeper into “Shelter in Place” and “Social Distancing” to protect itself from the COVID-19 virus, jobs are being lost at a rapid pace. Jobless claims in the United States for the week ending March 21 came in at a record high 3.28 million. In turn, household finances are being stretched around the country. Fiscal stimulus and various debt forbearance plans can help to mitigate the damage, but families will have to make decisions about how to allocate scarce resources based on their own priorities.
A key metric in the decision regarding investment in MBS is prepayment speeds. Investors concerned about lower interest rates naturally find value in lower-prepaying pools. In looking into the drivers of differing prepayments, it’s useful to look into differences in performance for different groups of loans. Chart 1 looks at the prepayment speeds for the entire books of Fannie Mae and Freddie Mac mortgages as measured by the 1-month conditional prepayment speeds (CPR).
|
Archives
February 2024
Tags
All
|
 RSS Feed
RECURSION |
|

Copyright © 2022 Recursion, Co. All rights reserved.