|
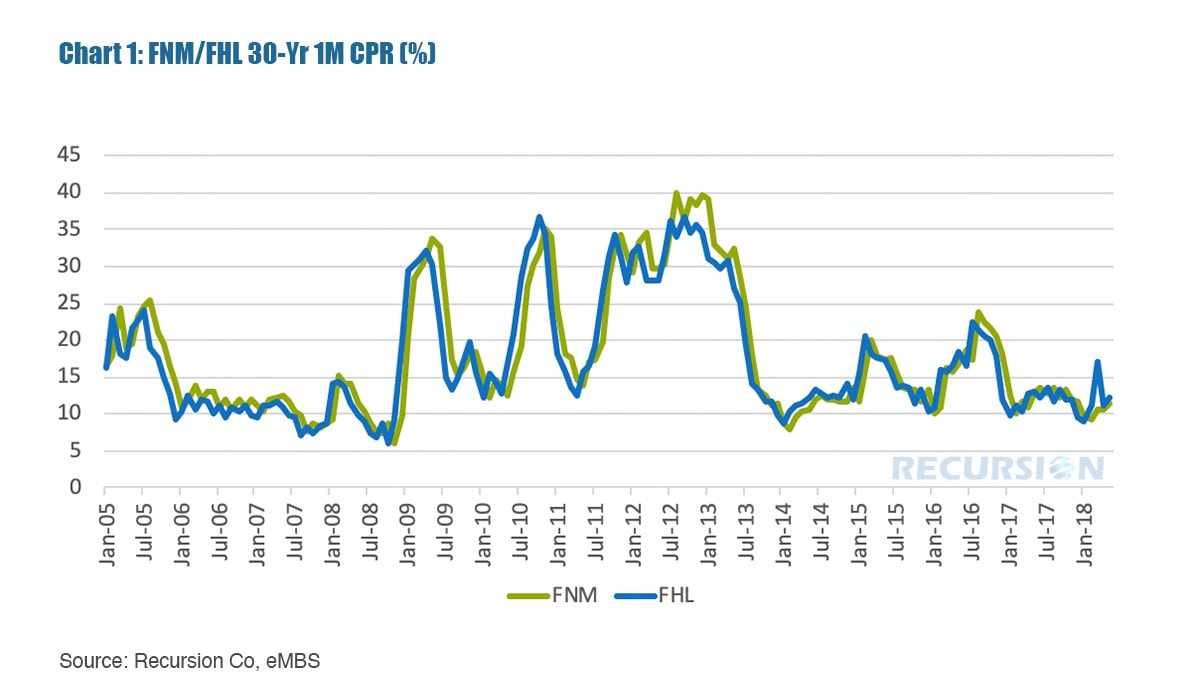
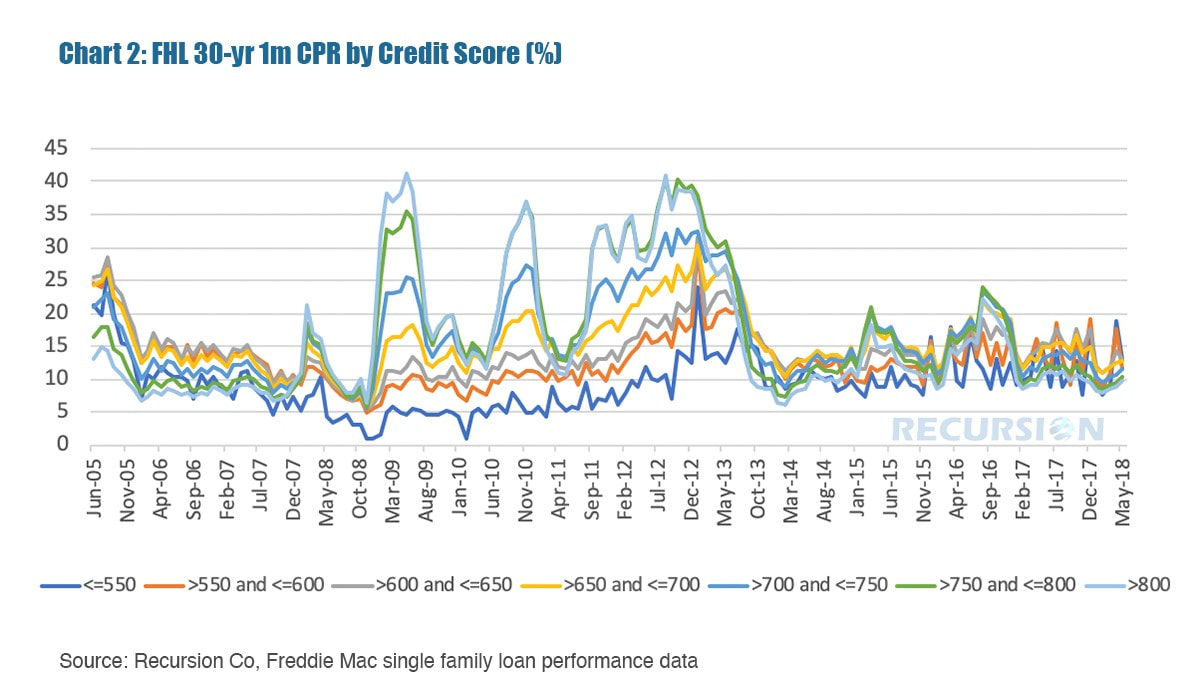
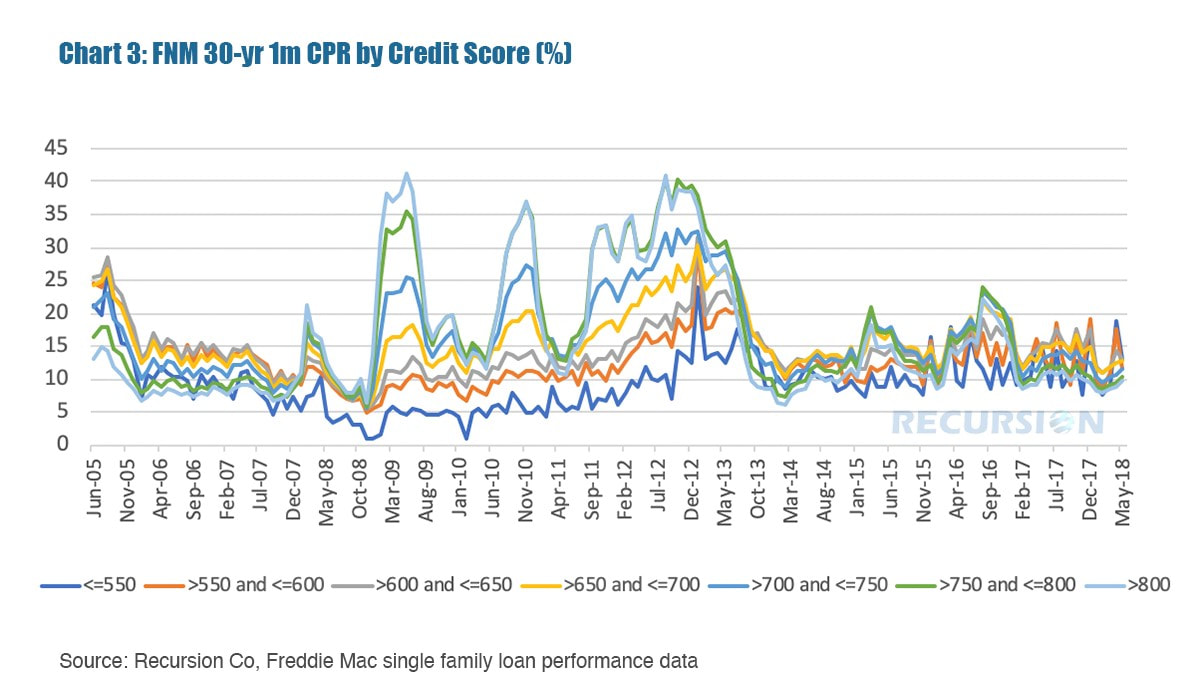
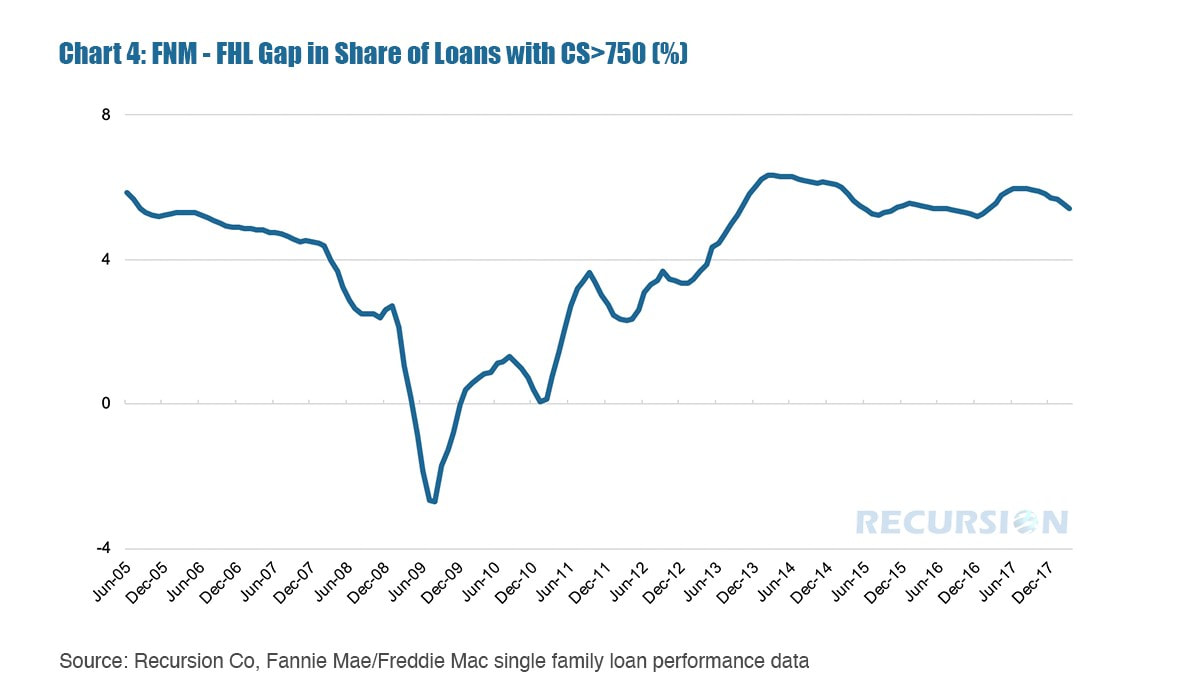
A key metric in the decision regarding investment in MBS is prepayment speeds. Investors concerned about lower interest rates naturally find value in lower-prepaying pools. In looking into the drivers of differing prepayments, it’s useful to look into differences in performance for different groups of loans. Chart 1 looks at the prepayment speeds for the entire books of Fannie Mae and Freddie Mac mortgages as measured by the 1-month conditional prepayment speeds (CPR). It’ s clear that in the low-rate episodes of 2012 and 2016 that Fannie Mae securities traded faster than those of Freddie Mac. The question is why this might be the case. It is well-known in the mortgage market that a spike in refinances associated with a decline in interest rates results in “credit rationing”. That is, due to capacity constraints, underwriters extend credit to the most credit-worthy borrowers as these are both the lowest-risk borrowers and the fastest loans to process. This can be clearly seen in Charts 2 and 3: For both Fannie and Freddie loans, those with FICO scores greater than 750 have the highest prepayment speeds. Finally, Chart 4 shows the gap in the share of loans with credit scores above 750 between Fannie Mae and Freddie Mac: Since June of 2013, Fannie Mae’s book has held a greater share of loans with FICO scores greater than 750 compared to Freddie Mac. This result offers an explanation as to why Fannie Mae prepayment speeds were greater than those of Freddie Mac in late 2012 and 2016, periods of low mortgage rates.
By having access to big data resources, firms are able to provide decision makers with refined information and improved outcomes. |
Archives
July 2024
Tags
All
|
RECURSION |
|
Copyright © 2022 Recursion, Co. All rights reserved.


 RSS Feed
