|
The release of loan-level dq data by the GSEs opens the door for much new analysis. In today’s blog we will look at servicer type. Below find a table of average DQ’s for each available type, along with average levels of underwriting characteristics: 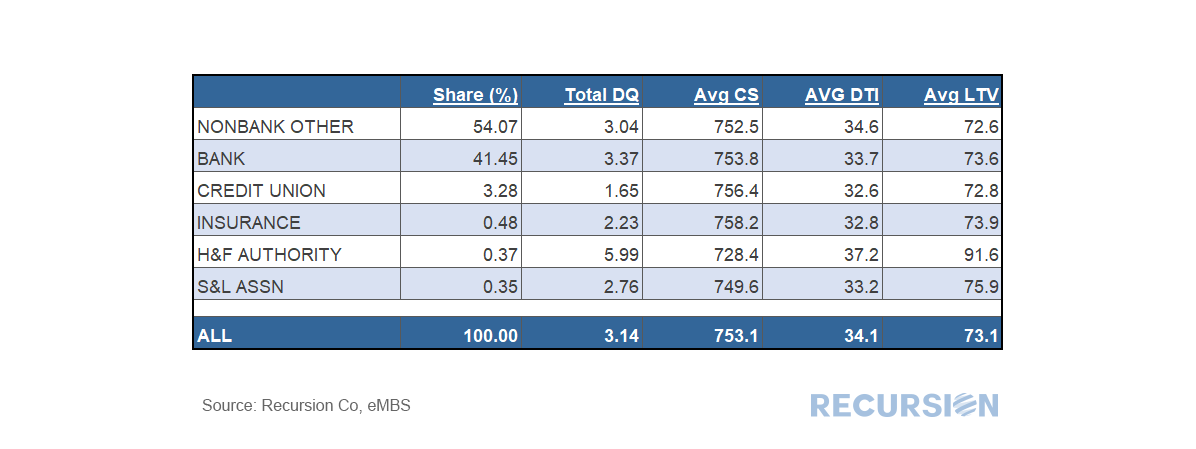 It’s interesting to note that banks tend to service loans with a modestly higher total DQ rate than the “Nonbank Other” category. The table also shows that banks have a tighter credit box with respect to credit score (higher) and DTI (lower) than nonbanks but have a more generous appetite for higher LTV loans. The data also presents financial analysts and strategists with a great deal of information about the performance of individual institutions. As an example, we look at the 100 largest servicers from the bank and “nonbank other” category (known as “nonbanks” from now on). There are 43 banks and 57 nonbanks in this group. The charts below plot total DQ’s vs credit score and DTI for each servicer type. Comparing different points or a single point vs trend lines can provide useful insights regarding the competitive landscape. 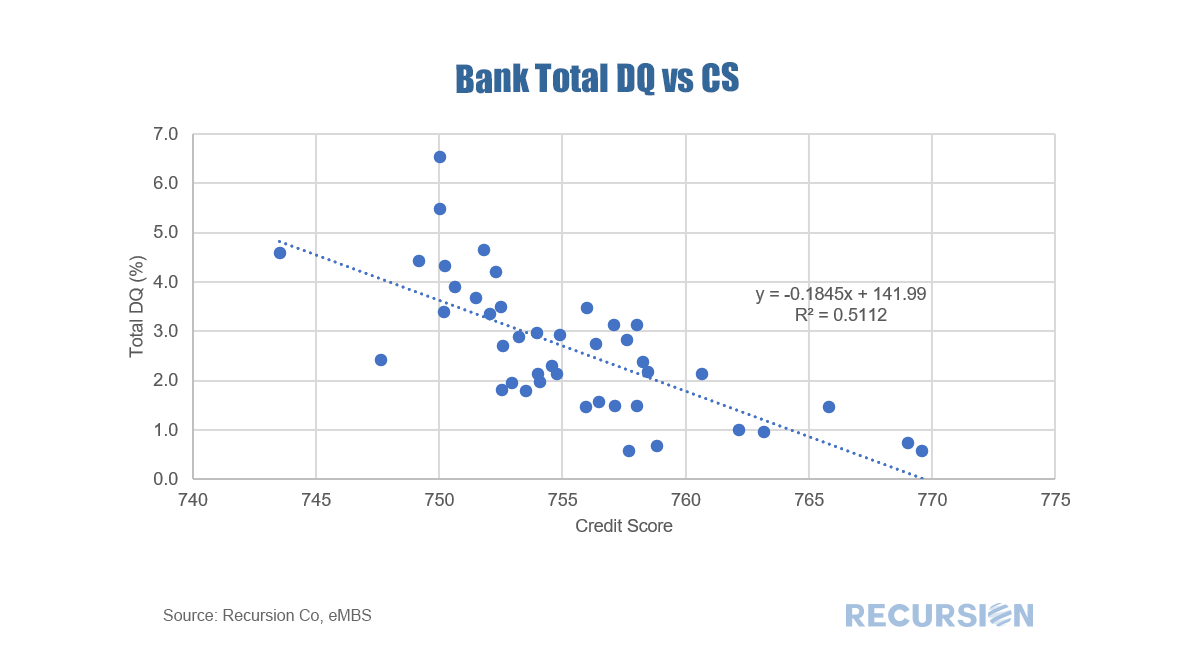 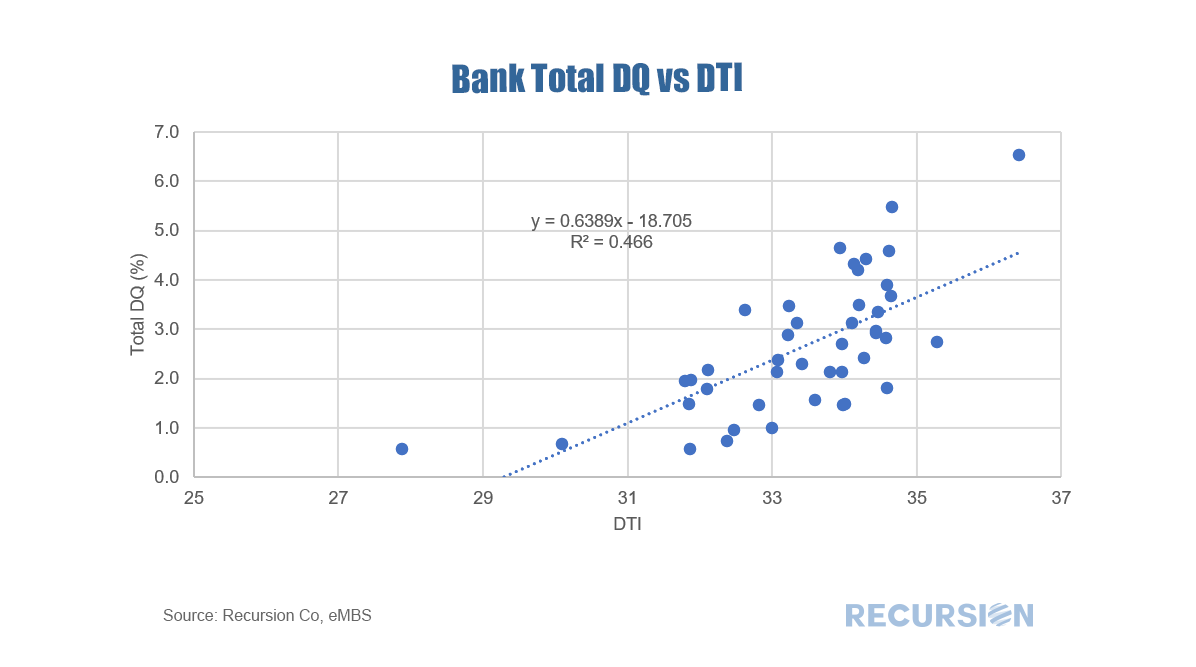 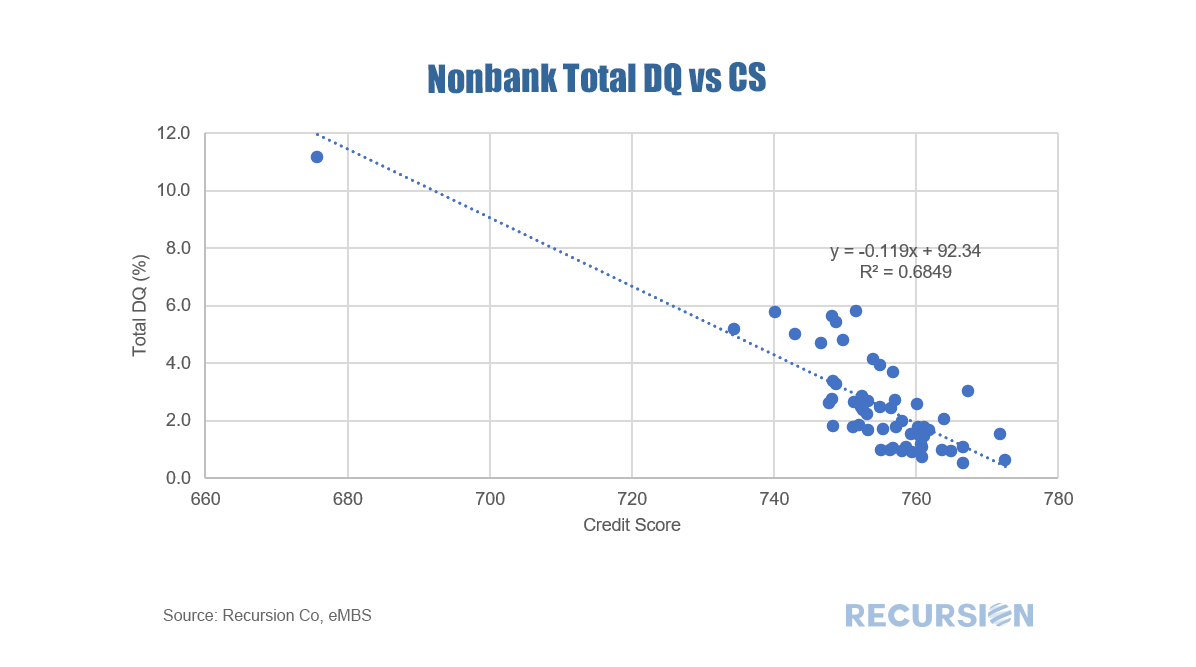 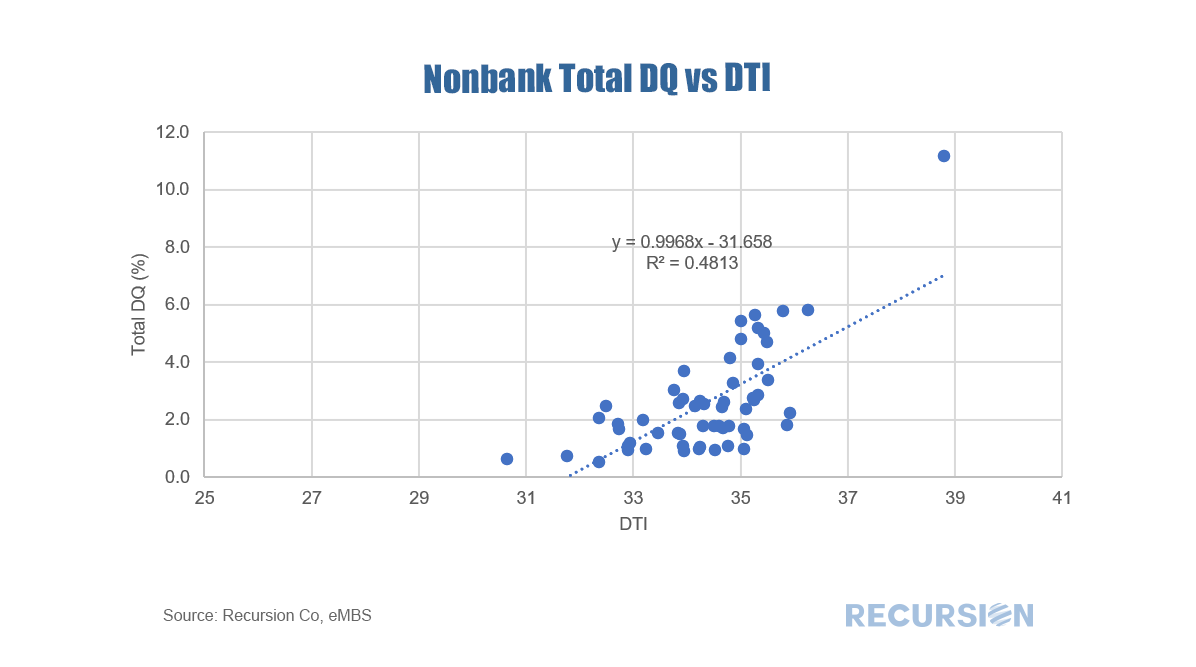 Of course, these charts just scratch the surface of what is possible here.
On Tuesday February 23, FHFA released its monthly purchase-only HPI for December, showing a 1.1% rise from the prior month, and a striking 11.1% increase from December 2019, the record-high annual growth rate reported since this data was first released in the early 1990s. 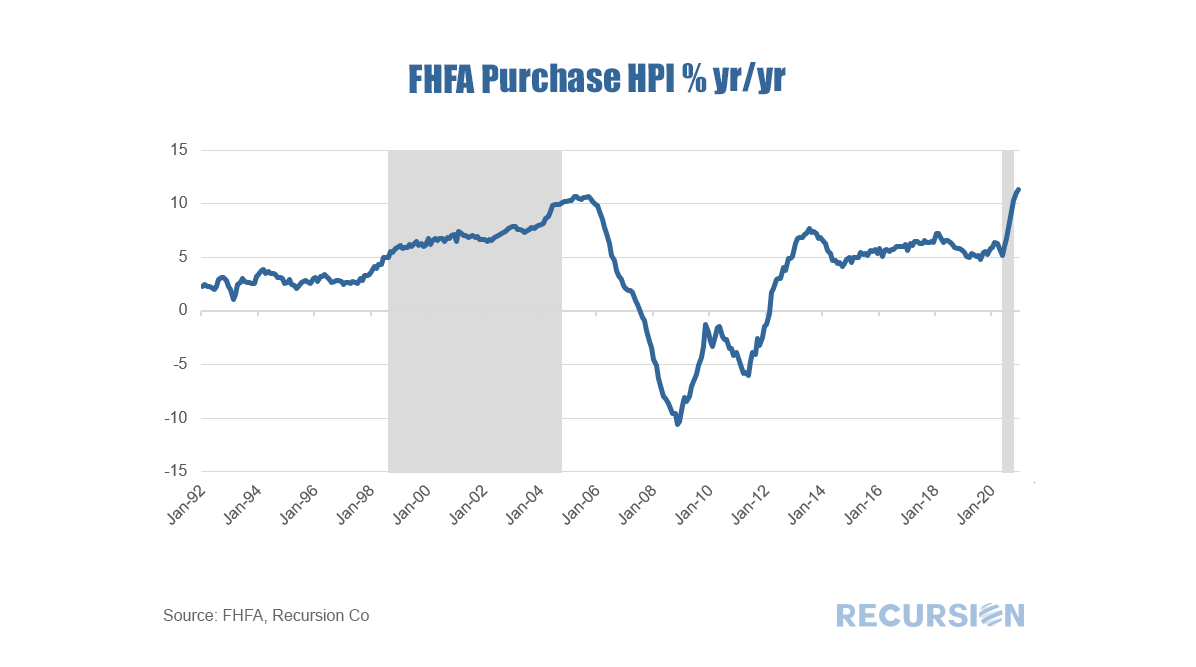 Our last post demonstrated that Fannie Mae performance at the pool level has been lagging that of Freddie Mac since the start of the pandemic[1]. The question remains as to why. The challenge in answering this question is that unlike the case for Ginnie Mae programs, Fannie Mae and Freddie Mac have not been releasing performance data on the loan level[2]. Those who subscribe to our monthly risk reports know that we have been tracking relative underwriting standards between the two mortgage giants for some time. We do this not by looking at the average levels of underwriting characteristics, but rather at looking at the tails of these characteristics. Our experience is that this is a far superior method for this as distinct policy about risk come in much clearer this way. We focus on the share of GSE deliveries with LTV>95, DTI>45, and credit score<680.   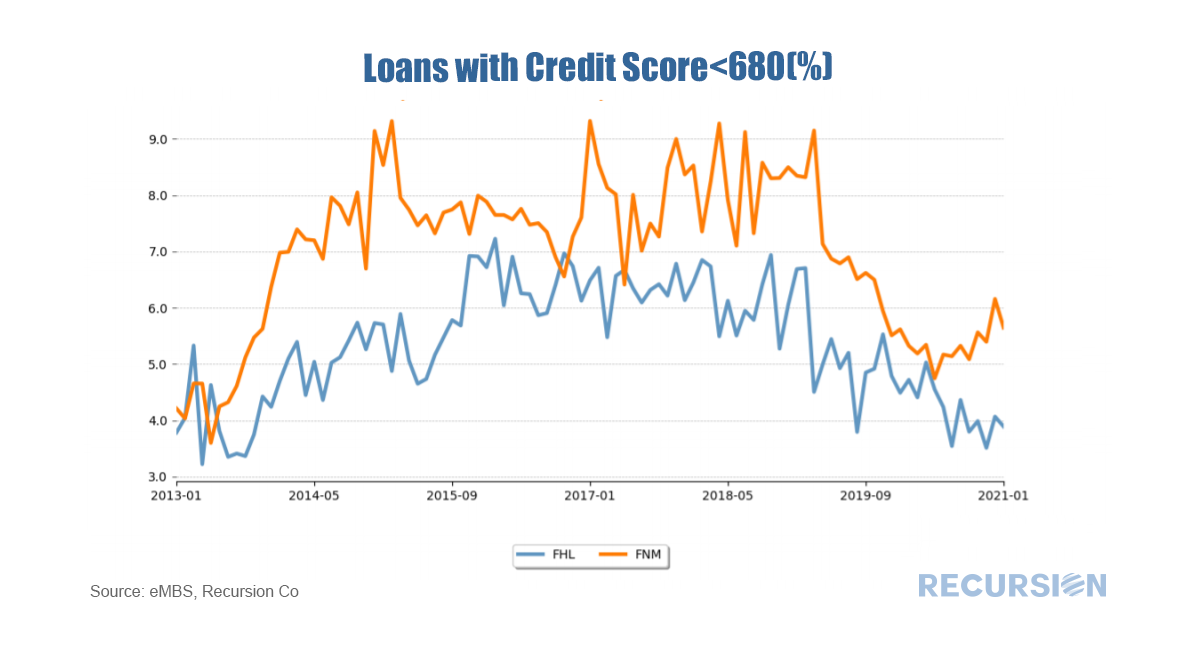 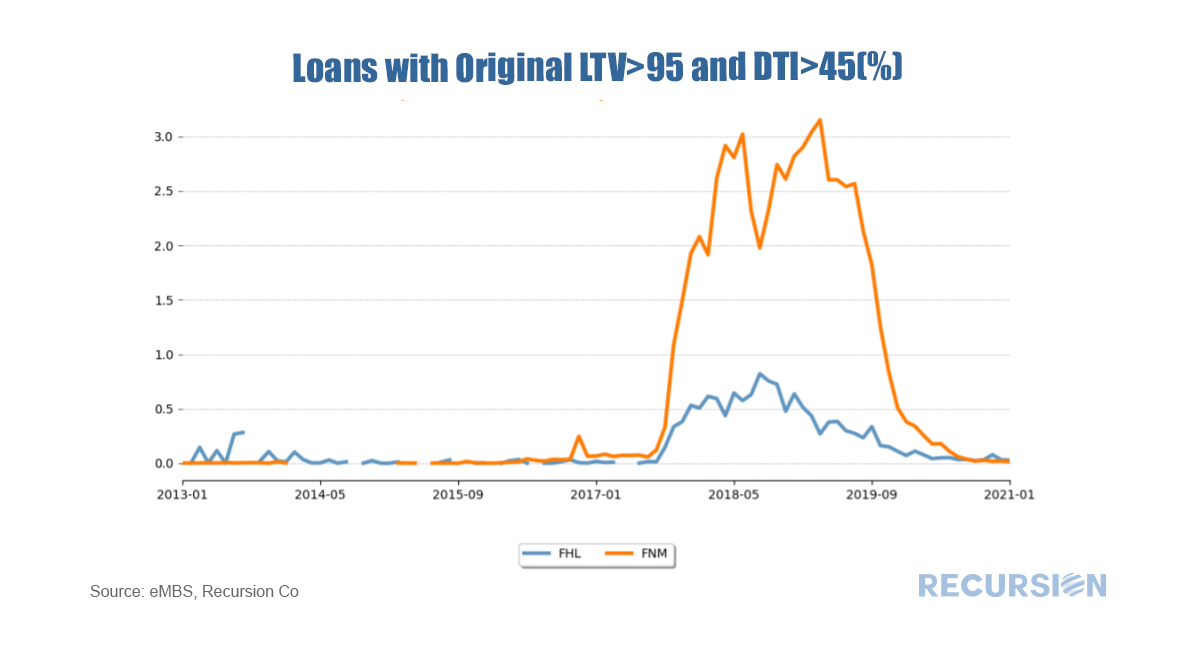 In a recent post we noted the recent striking rise in the GSE refinance share and commented that the rate of this activity in GNM programs, while still rising, has lagged[1]. This seems to be related to the tendency of capacity constrained lenders to provide credit to the highest quality borrowers, and to a looming 0.5% fee hike on GSE refinance deliveries scheduled for December 1. Focusing on FHA alone, the share of refinance loans compared to those delivered to the GSE’s has plummeted in recent months: 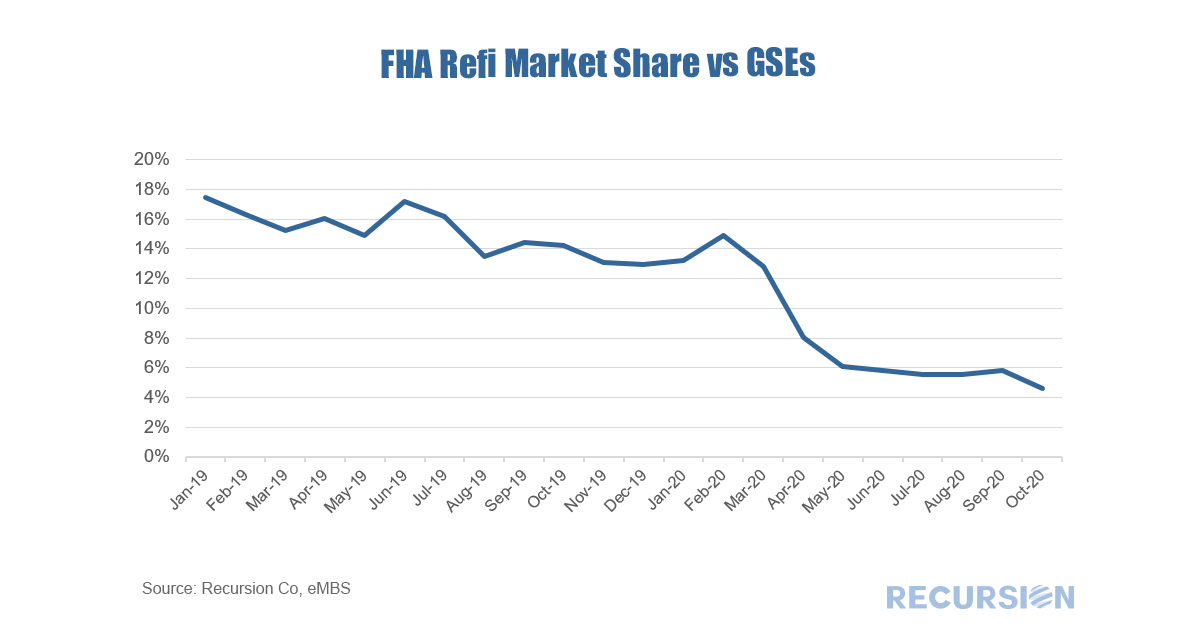 In a recent post we looked at the differences in bank underwriting characteristics between those conforming loans held on book compared to those delivered to the GSEs using data pulled from Recursion HMDA Analyzer[1]. We now extend this into another dimension via the addition of LTV. Below find the difference in share of such deliveries between sold loans and those held on book: 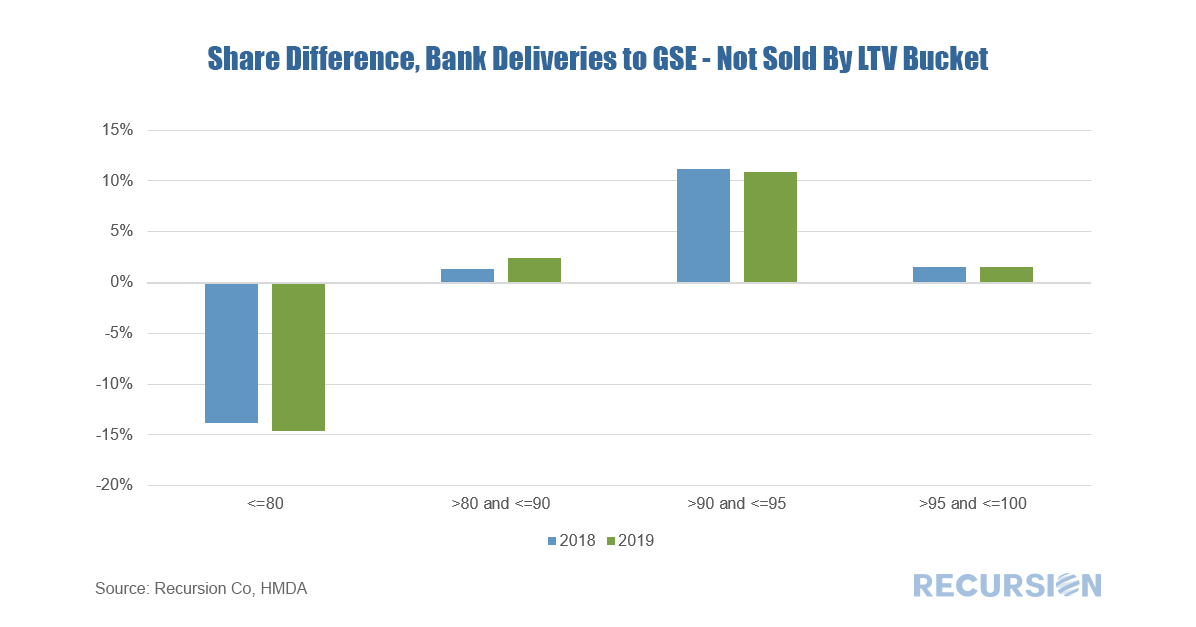 With the release of 2019 HMDA data, we now have two years of loan-level information that contains both demographic and credit characteristics. Demographic information in HMDA includes income, race, and geography down to the census tract level, while credit characteristics include DTI. Our agency loan level databases contain a richer set of information regarding lending characteristics, but limited data on geography and demographics. For institutions looking to benchmark their performance in affordable and minority lending for regulatory purposes, 2019 HMDA, with data on thousands of lenders, is an invaluable tool. If you are interested in finding out more, please reach out. There are of course policy uses for this data as well. A significant difference between HMDA and the agency pool loan-level data is that HMDA contains data for loans held on book, the so-called “Unsold” category. This allows a comparison of loans that banks originate and keep and those they deliver. We can break this down in any number of ways, but let’s look at it for conforming loans broken down by DTI. 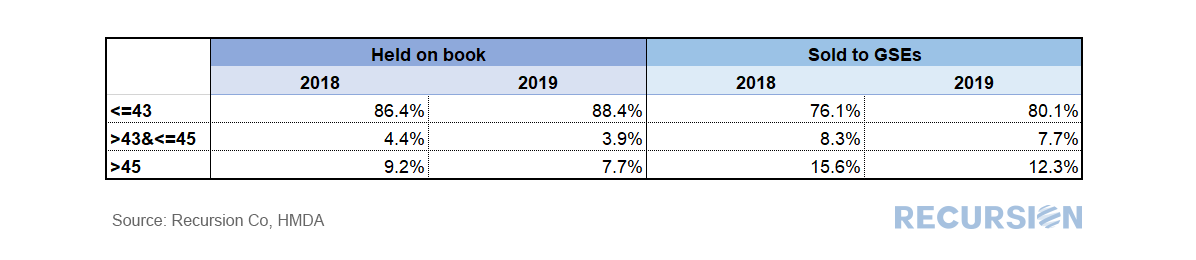 In the table above, we can readily observe that banks tend to keep higher-quality loans (as measured by DTI<=43) compared to those they deliver to the Enterprises. Of course, this is not a complete picture of this issue; there are many other ways to slice the data (credit score, LTV, loan size, geography). Moreover, as there is a correlation between low LTV and desirable loan characteristics for regulatory purposes (minority status, low income), we cannot simply conclude that it’s a matter of keeping the best for themselves. A second interesting question is: did behavior in this regard change between 2018 and 2019? Below you can find a chart of the change in the distribution between unsold and delivered loans between these two years. 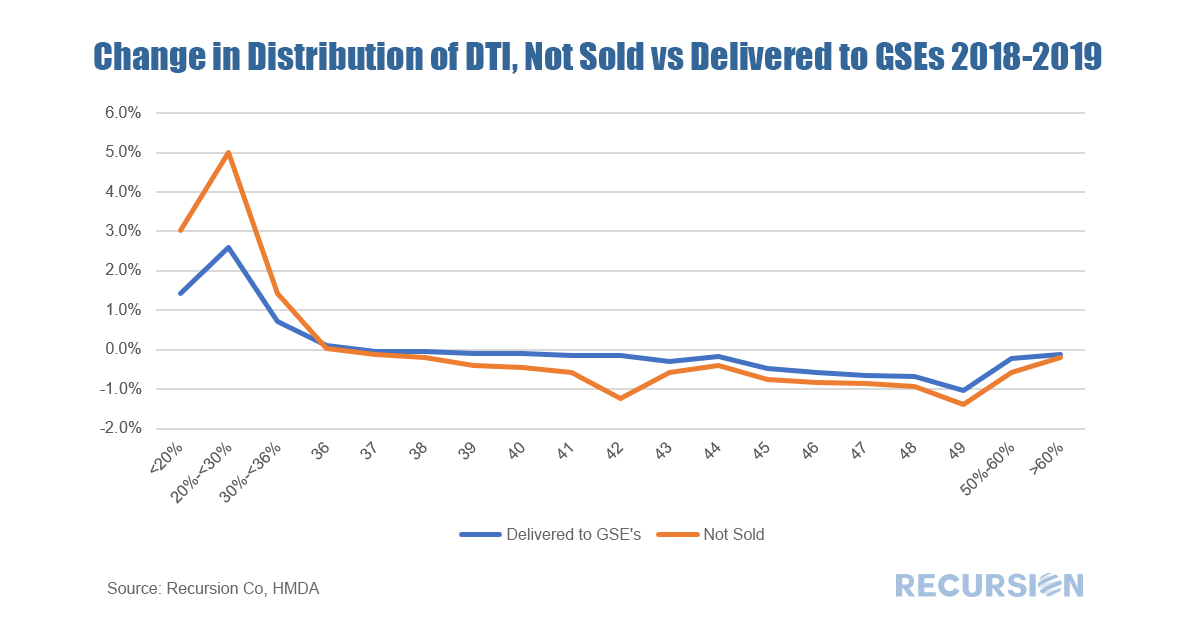 It appears that banks kept more of the loans associated with very low levels of indebtedness (DTI<35) in 2019 compared to 2018, while they distributed a small share of higher-risk loans across the spectrum of DTIs above that level.
Explanations for such behavior are the subject of future research. In a recent post we looked at the agency composition of the recent surge in MBS production[1]. We observed that Ginnie Mae’s market share in the three months to July 2020 is significantly below that experienced in the same period a year ago. The bulk of the decline is due to a drop in the refi share, while the purchase market share experienced less than a 1% decline. There are several drivers of share for purchase market share, including program design, the coupon spread between the government and conforming sectors, and differences in the credit boxes between the two. This note looks at competitiveness through the lens of the latter factor, credit boxes. As noted in the prior post, Ginnie Mae is the securitizer for four different programs, with the two biggest being FHA and VA. VA has a fairly unique set of program requirements, so the main competition in the purchase mortgage space is between FHA and the GSEs. In the three months to July 2020 FHA lost about 2.5% of its share in the purchase mortgage space compared to the GSEs. Let’s dive into credit factors, starting with credit score: 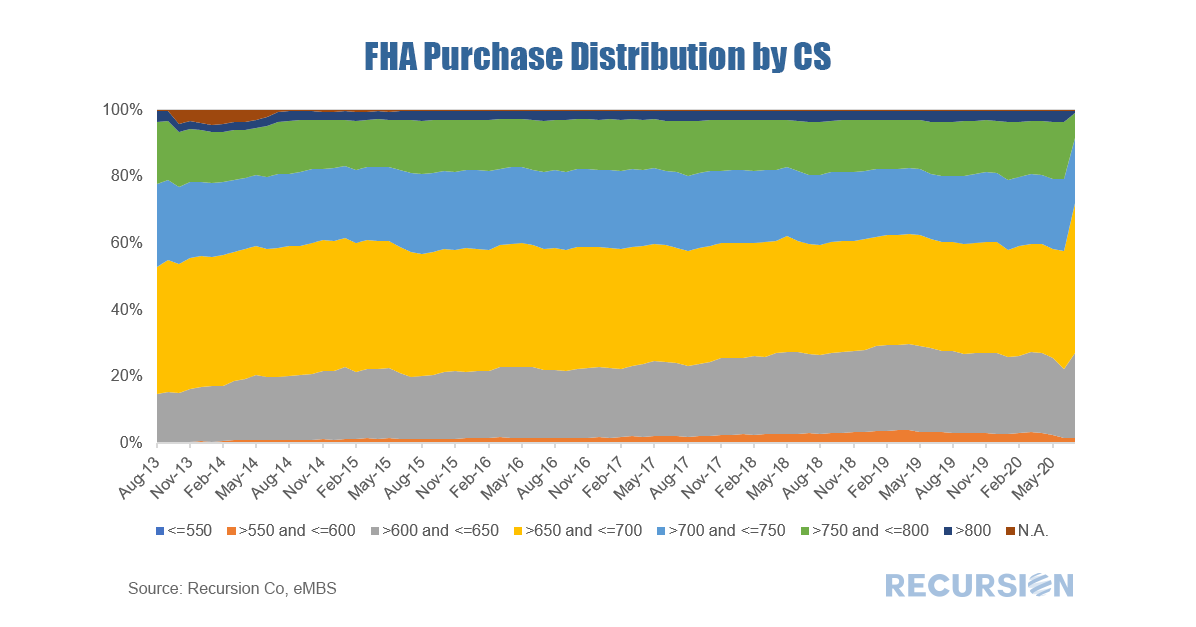 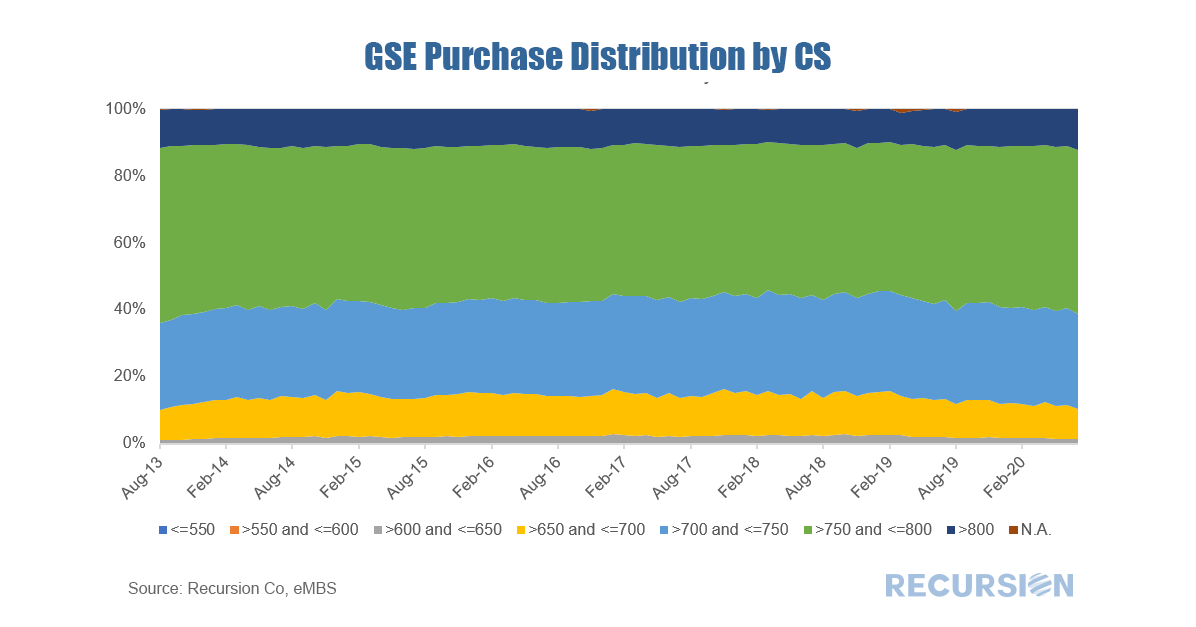 A new paper by Pedro Gete at IE Business School and Michael Rehrer at the University of California San Diego entitled “Mortgage Securitization and Shadow Bank Lending” identifies a channel through which prices for FHA-insured loans rise relative to those insured by the GSE’s as the result of a change in a financial regulation. This relative price hike provides an incentive for credit-constrained nonbanks to increase their lending relative to banks by expanding their activity to less credit-worthy borrowers. A key metric utilized to measure the degree of credit loosening is median credit score. Calculation of this statistic requires the availability of the kind of big data digital tools in the cloud to order the millions of loans involved that are available to Recursion Co customers.
Congratulations to them for exceptional research! The paper will be appearing in the Journal of Financial Studies and can be found here: https://papers.ssrn.com/sol3/papers.cfm?abstract_id=2921691 |
Archives
February 2024
Tags
All
|
 RSS Feed
RECURSION |
|

Copyright © 2022 Recursion, Co. All rights reserved.