|
The Credit Risk Transfer (CRT) market was launched in 2013 by the GSE’s to help protect taxpayers from credit risk (risk of borrower nonpayment) by sharing mortgage losses with private investors. The market has grown substantially since that time, with the outstanding balance of reference loans reaching over $2 trillion at the end of 2019. Over this time, investors have largely been rewarded, as home prices have continued to rise and labor market conditions have been robust. Chart 1 shows these for the sixteen most recent high loan-to-value (LTV) Fannie Mae deals from their CRT program Connecticut Avenue Securities (CAS). 1. Cumulative Default Rate for CAS Securities 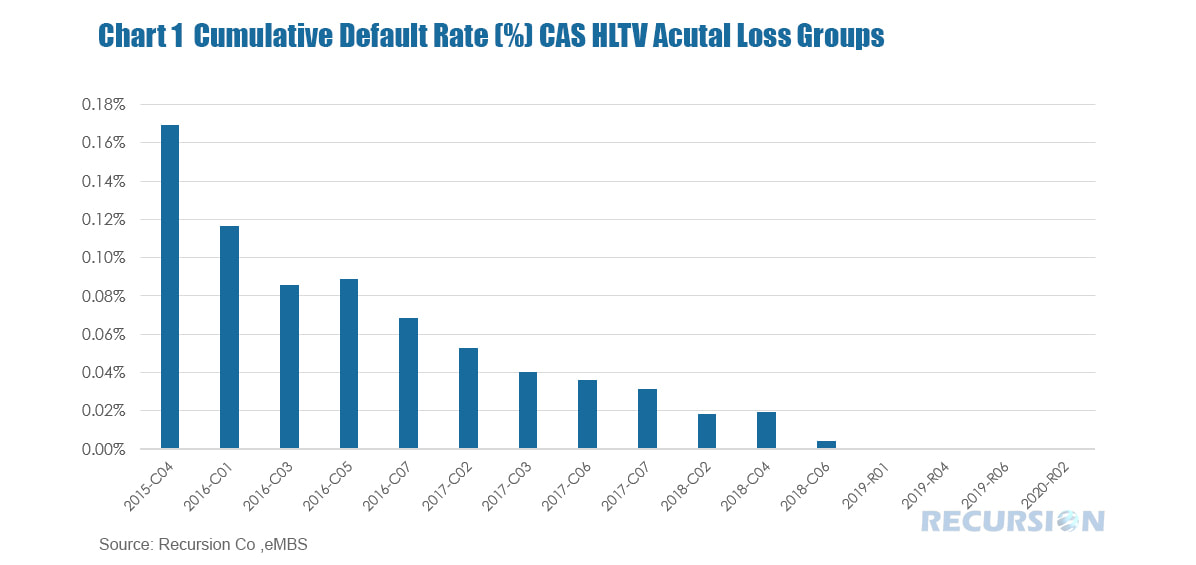 Generally, deals tend to accumulate losses over time, although many factors contribute to the pace of these increases, including underwriting characteristics and geography. Forming expectations of future losses to guide investment decisions requires the application of advanced big data techniques to these deals at the loan level. For example, Chart 2 shows the geographic distribution of cumulative default rates by state for the CAS 2015-C04 high LTV group. 2. Cumulative Default Rate by State 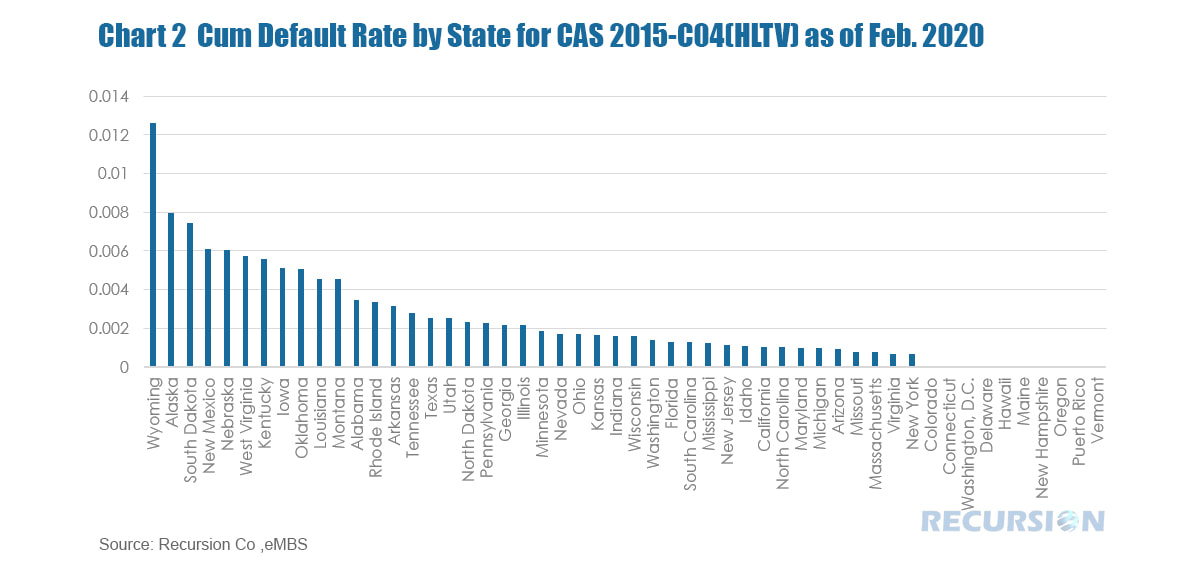 These will certainly grow much higher in coming months. Breaking losses down in this manner can provide a basis for forming expectations of future defaults based on local economic conditions, particularly those impacting labor markets, in each area. Parsing losses according to underwriting characteristics requires a more nuanced understanding of these factors. Losses can be calculated as the product of default rate (% of loan balances for which borrowers fail to meet their debt obligations) and severity rate (% of unpaid balance cannot recover by disposition of the collateral). Chart 3 shows a breakdown of losses on this basis for the CAS 2016-HQA transaction. 3. Breakdown of Loss by Default Rate and Severity 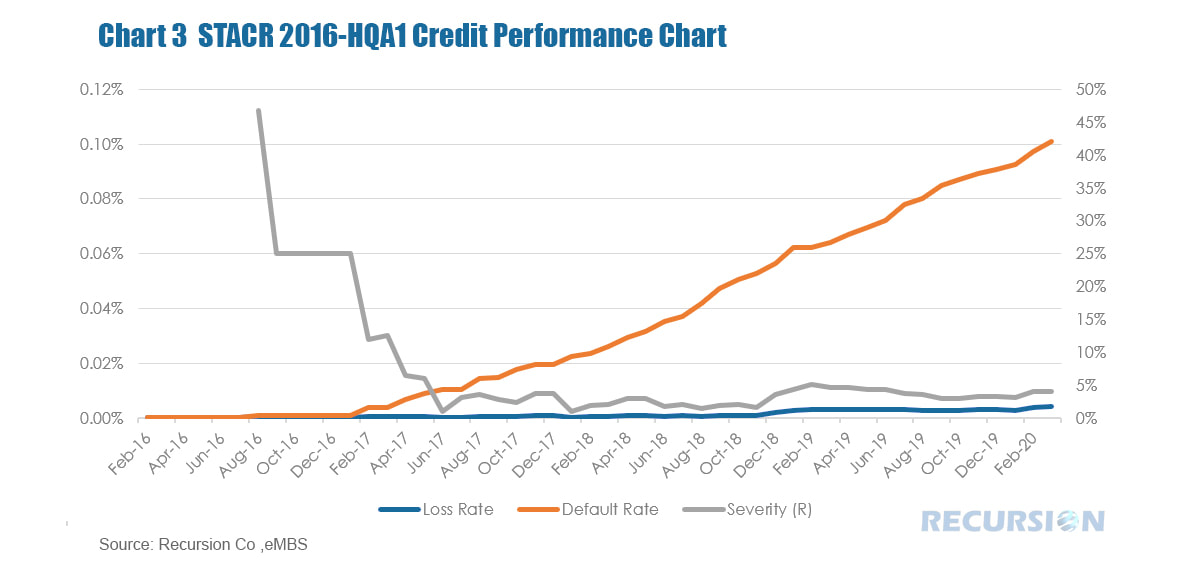 Once this loss breakdown has been computed, the components can be assessed. For example, severity is likely to be highly dependent on local house price trends. Defaults themselves will relate to job loss and the credit conditions of borrowers. For the latter factor, new machine-learning modeling techniques have been developed that can be effectively applied to this analysis based on the availability of large data sets and digital tools to manipulate them.
Going forward, the ultimate extent of losses associated with the economic downturn caused by the COVID-19 virus is unknowable. Policymakers and investors can best navigate this highly uncertain environment by having a detailed up-to-date view of the current environment and recent trends. |
Archives
July 2024
Tags
All
|
 RSS Feed
RECURSION |
|

Copyright © 2022 Recursion, Co. All rights reserved.