|
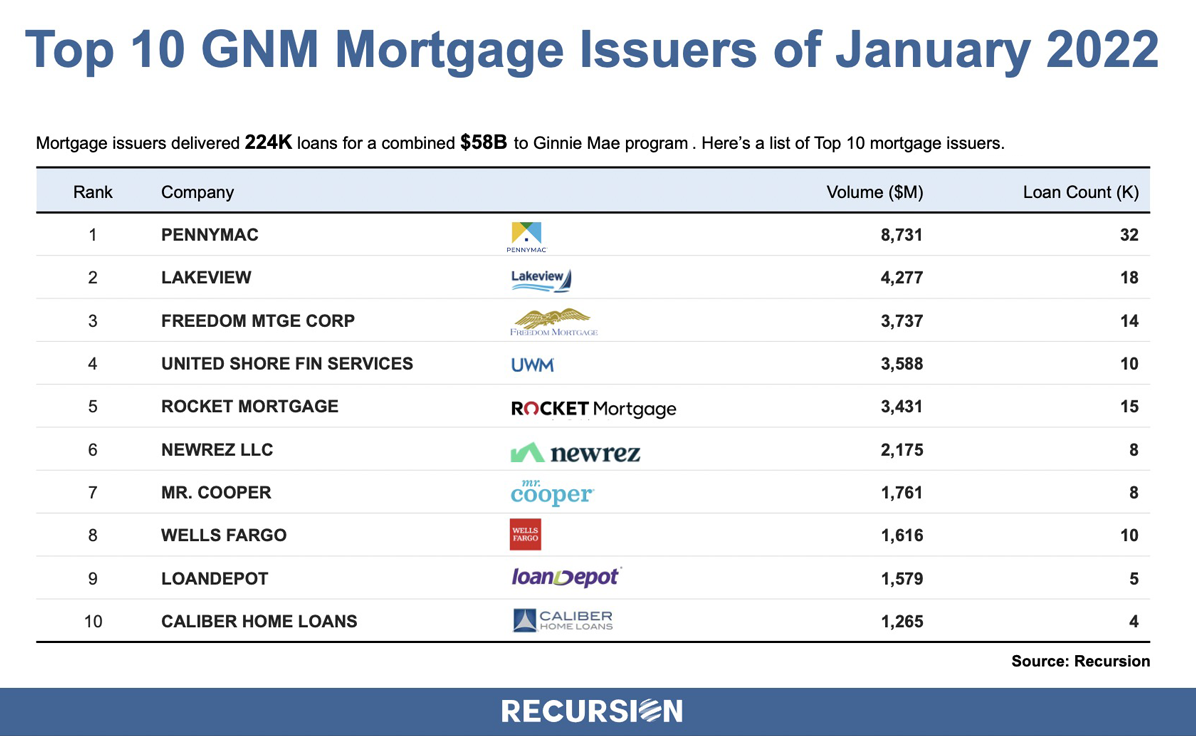
In a recent post[1], we discussed findings obtained with the recent release of 2021 HMDA data. Among other things, we looked at the share of mortgage originations by income group and product type. In this note, we look at the difference in lending patterns between the banks and nonbanks. The incentive behind this approach is policy driven. There is a long history of measures taken to encourage lenders and builders to foster economic development in low-income areas via the housing market. For example, the Community Reinvestment Act (CRA) stipulates that a bank’s performance with regards to compliance of their regulatory requirements depends in part on: “the geographic distribution of loans—that is, the proportion of the bank's total loans made within its assessment area; how these loans are distributed among low-, moderate-, middle-, and upper income locations[2]” To assess this issue, we assign a flag to each of the census tracts designated by HUD as having a greater than 51% share of households with incomes in the Low-to-Moderate (LMI) range in the larger MSA the tract is part of[3], which are called LMI area by HUD, or “low income” tracts by FHFA. Below find a chart of the 10-year trend in the share of loans originated in this category by institution type for conventional and FHA loans: 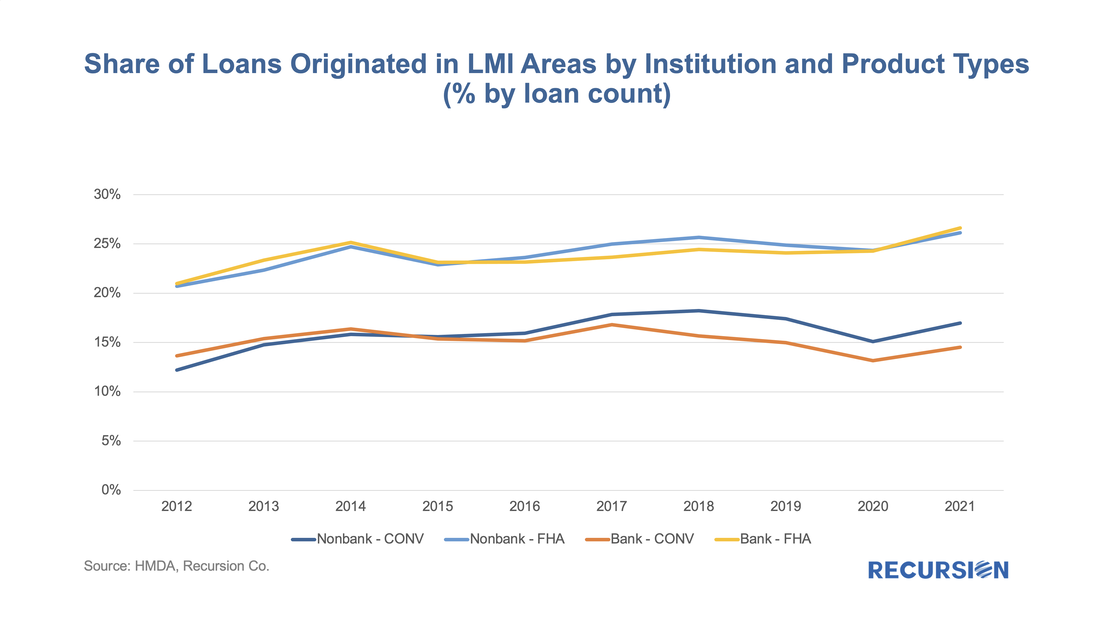 On March 24, the CFPB released HMDA data for 2021[1], with results obtained from 4,316 reporters, little changed from 4,472 reporters in 2020, but well below the 5,505 respondents reached in 2019[2]. There are yet more companies are expected to report to 2021 HMDA. However, our experience from previous year indicates little change in big picture when reporting is finalized. The drop reported in the number of reporters in 2020 vs 2019 is largely due to a reduction in the number of loans that a bank needed to underwrite, requiring a report to be filed starting in 2020. This data is used for market sizing by regulators and market participants, but it also represents a treasure trove of information regarding lender and consumer behavior across a wide variety of economic and market regimes. 2021 was notable for being the second year of the Covid-19 pandemic, which is associated with expansive monetary and fiscal policies and surging house prices. This report will briefly assess trends across a variety of topics. Market Activity After surging by 47% in 2020 to 24.8 million from 2019, the number of loan activities reported in 2021 HMDA ticked up by just 2% to 25.2 million, almost 40% below the record high 41.5 million attained in 2003. Similarly, the number of loans originated reported in 2020 jumped by 57% from the prior year to 14.2 million, while in 2021 the figure rose by only 3% to 14.6 million, down by about one-third from the 2003 peak of 21.4 million. 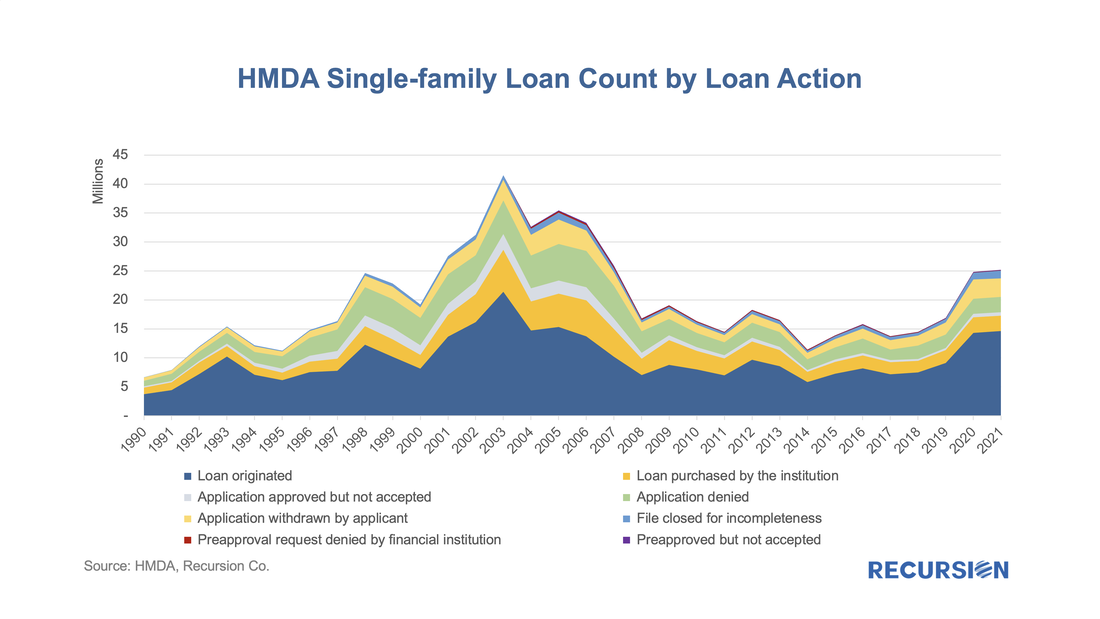 The fourth quarter of 2021 marked the 13th anniversary of the introduction of the Federal Reserve’s Quantitative Easing (QE) policy, whereby the central bank worked to push longer-term rates lower once short-term rates hit the zero lower bound. This activity largely took place via purchases of longer-dated Treasury securities and mortgage-backed securities. There were many nuances as the central bank bought securities in different proportions over time and occasionally let their balance sheet shrink as the securities they held paid off or matured. The purpose of this note is to take a big-picture view of the MBS market impact of a likely decline in Federal Reserve holdings in the Agency space as the central bank has recently indicated its intention to begin letting these securities run off its balance sheet. In particular, the FOMC statement of March 16 stated, “In addition, the Committee expects to begin reducing its holdings of Treasury securities and agency debt and agency mortgage-backed securities at a coming meeting.[1]” Which we guess will be in May. What does this mean to valuations in the MBS market? Our analysis is based on the data collected on Agency MBS ownership broken down by major investor class by the Federal Reserve in the Financial Accounts of the United States[2]. This data is produced quarterly and is a broad measure of Agency securities, including not just single family Agency MBS but also Multifamily MBS and Agency Debt. Below find a chart of the progress of the Agency MBS market from Q4:2008, when the Fed launched QE, through Q4:2021. The chart nicely shows the ebb and flow of activity in this market on the part of the major players. The holdings controlled by the central bank is one example, starting at near-zero in Q4:2008 and cycling up and down, reaching a record high of almost 25% at the end of 2021. 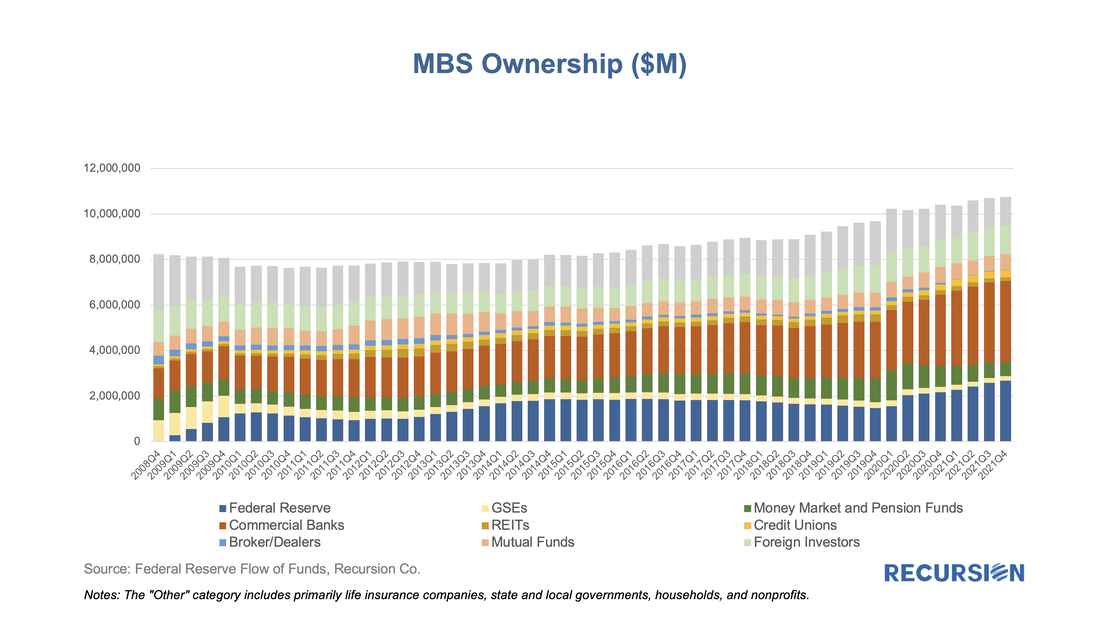 Recursion released the roaster of TOP 10 GNM issuers and GSE lenders of February 2022. Mortgage issuers delivered 186K loans for a combined $49B to Ginnie Mae program. Issuance volume dropped $9B from January 2022. Here’s a list of top 10 GNM mortgage issuers. 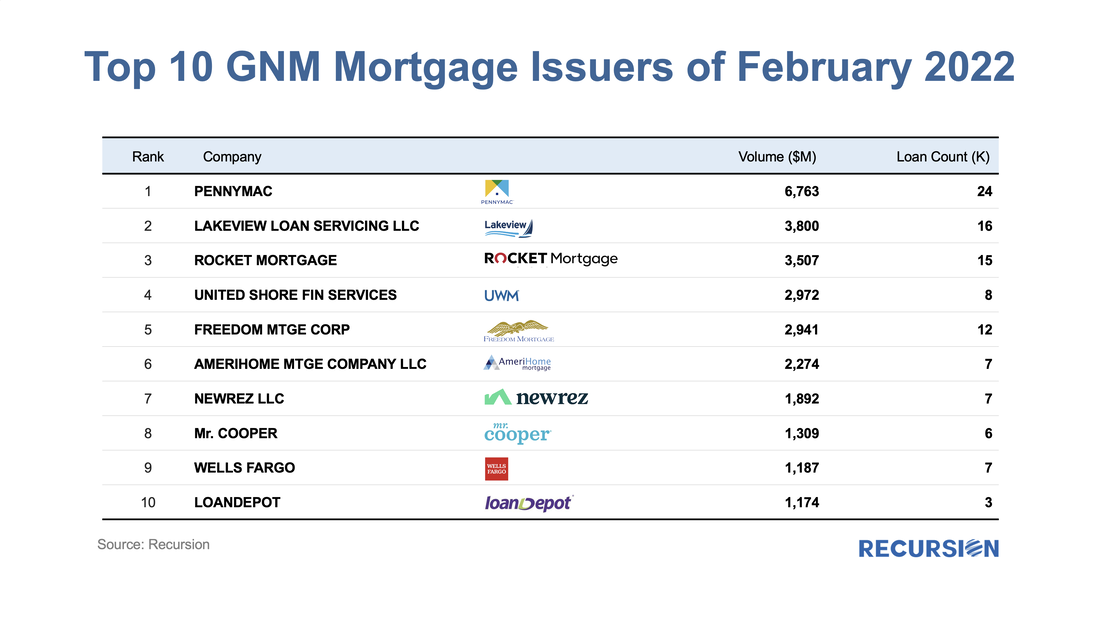 Mortgage lender delivered 476K loans for a combined $138B to GSE program. Issuance volume dropped $41B from January 2022. Here’s a list of Top 10 GSE mortgage lenders. 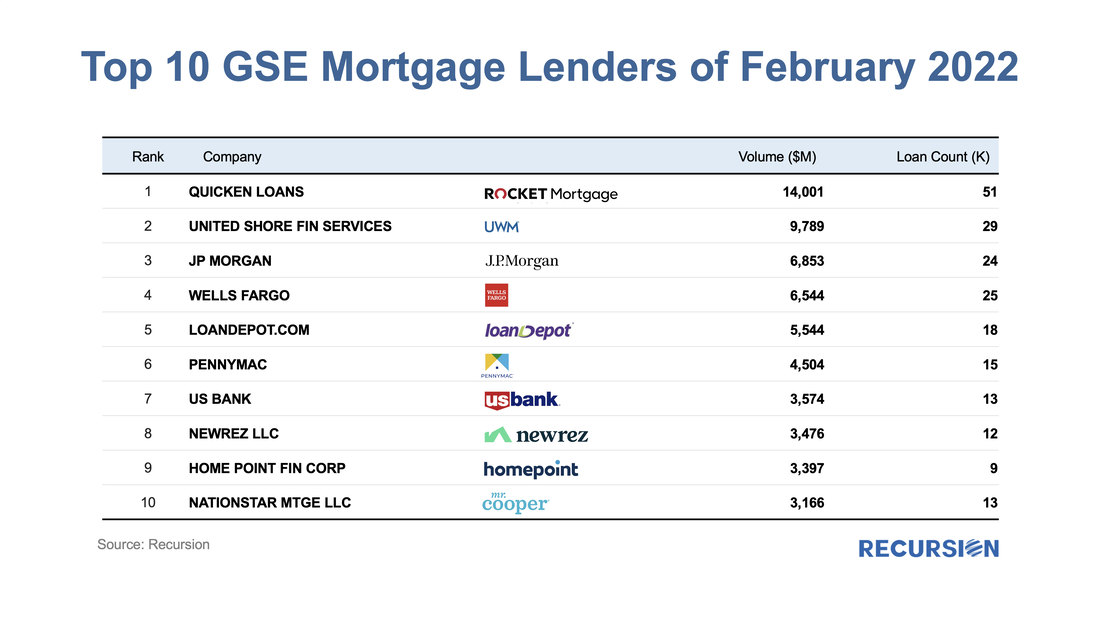 We observe these trends by tracking our monthly data reports. If you are interested in the outlook for mortgage market developments, reach out to inquiry@recursionco.com and subscribe to Recursion Reports!
As mortgage rates have moved up recently, we have observed some changing trends in underwriting characteristics associated with GSE new issuance. According to Freddie Mac, the US weekly average 30-year fixed mortgage rate stood at 3.89% as of Feb 24, 2022, which is about a 1.3% increase since the record low level of 2.65% was reached on Jan 7, 2021. 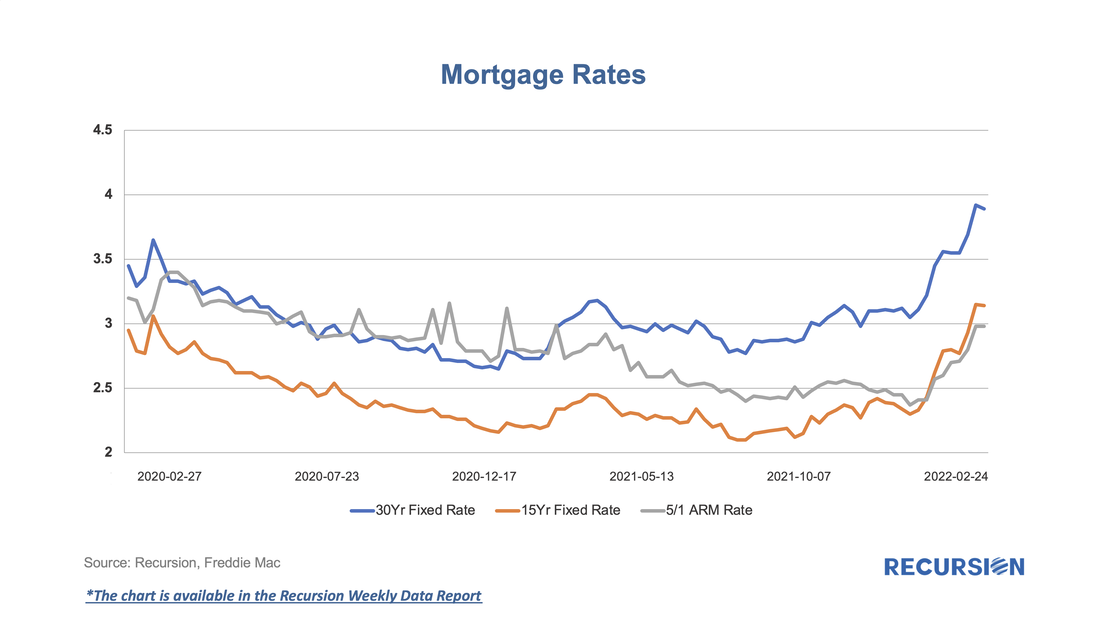 As mortgage rates decline, originators become capacity constrained and allocate credit to the highest-quality borrowers. Similarly, to keep lending pipelines full, originators are likely to loosen up their underwriting standards when rates rise. After declining in recent years when interest rates were low, GSE new issuance purchase loans with DTI over 45 started to increase again in the second half of 2021, especially for Fannie Mae, as mortgage rates began to rise. Nonbanks have historically been more active in lending to higher DTI borrowers, but recently the gap between banks and nonbanks has narrowed. 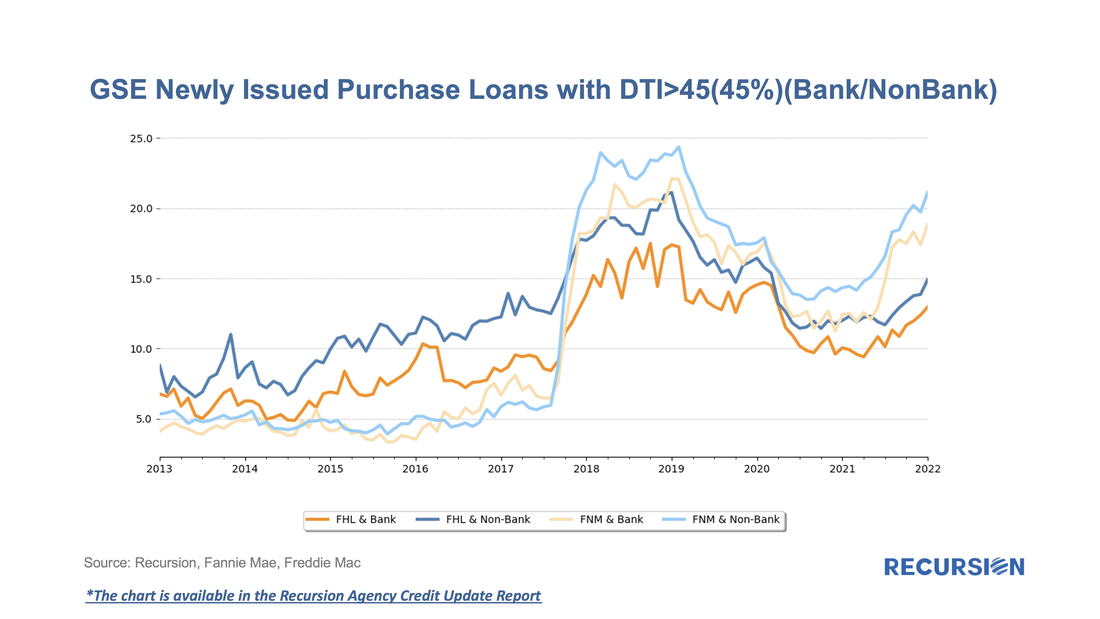 We have observed similar trends in credit scores. After the decline in the shares of low credit score borrowers in 2019 and 2020, sellers have recently been delivering an increasing share of loans with credit score less than 680 to the GSEs. 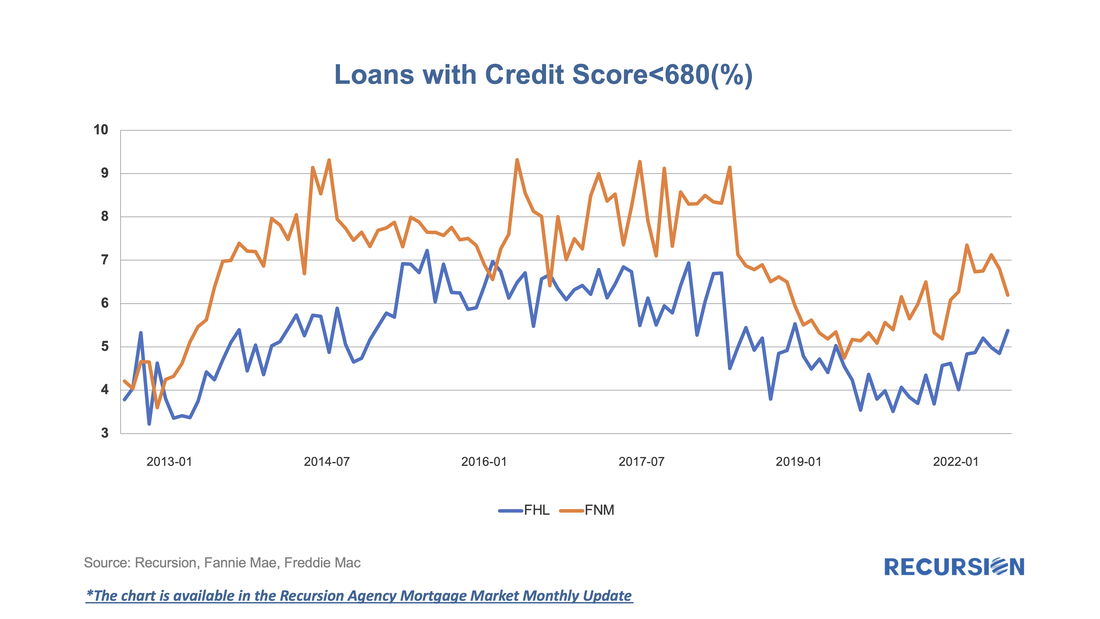 We observe these trends by tracking our monthly data reports. If you are interested in the outlook for mortgage market developments, reach out to inquiry@recursionco.com and subscribe to Recursion Reports!
In a recent note, we pointed out how a measure of the success of the Unified Mortgage Backed Securities (UMBS) project was the narrowing in the CMO Lockup Rate between Freddie Mac and Fannie Mae[1]. For many years, Fannie Mae benefitted from the liquidity advantage its security maintained compared to that of Freddie Mac, based on its long-standing market leadership position. To compensate, Freddie Mac locked up more of its securities in CMO’s, in an effort to create a supply-constrained premium in its own securities. The degree of success achieved using this strategy could be measured in terms of changes in the “Traditional Share”. “Traditional Share” is a terminology widely used within Fannie and Freddie, that measures the market share held by Fannie Mae compared to its smaller rival. For example, the Traditional Share of 60, means loans guaranteed by Fannie Mae contribute to 60% of the GSE book, while those guaranteed by Freddie Mac contribute 40%. For the purposes of this note we will measure this in terms of loan count for purchase mortgages only. In 2014, FHFA announced the establishment of a new securitization infrastructure[2] for all mortgage loans backed by single family residences into a new common security. Historically, the Traditional Share had stood at about 60%, but at that time it had risen to over 70%, putting Freddie Mac into a dire situation. With that announcement, the share started to decline, and by the time the UMBS was launched in 2019 the share had eased back towards the 60% level. As a result, Freddie Mac faced reduced pressure to lock its securities up in CMOs, and the gap between this activity and that of Fannie Mae was about halved over the 2014-2019 time frame. Subsequently, the question was whether investors would maintain an indifferent posture between the delivery of Fannie Mae and Freddie Mac UMBS. Lingering fears about the possibility of so-called specified trades faded along with narrowing performance differences between the two agencies, and in recent months the Lockup Gap has almost disappeared. This was recently met with a significant plunge of 8.6% in the Traditional Share in Q3 2021 to a record-low 47.4%. 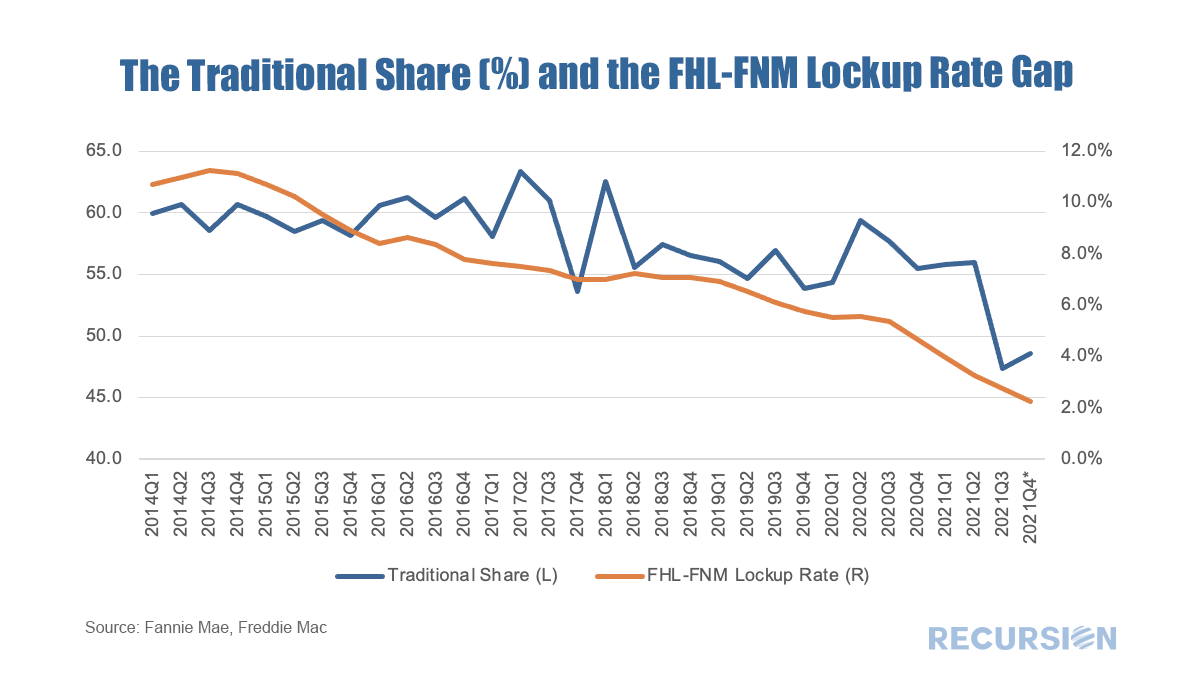 Over the past six months, prepayment speeds of Ginnie Mae securities have notably widened against those of the GSEs. 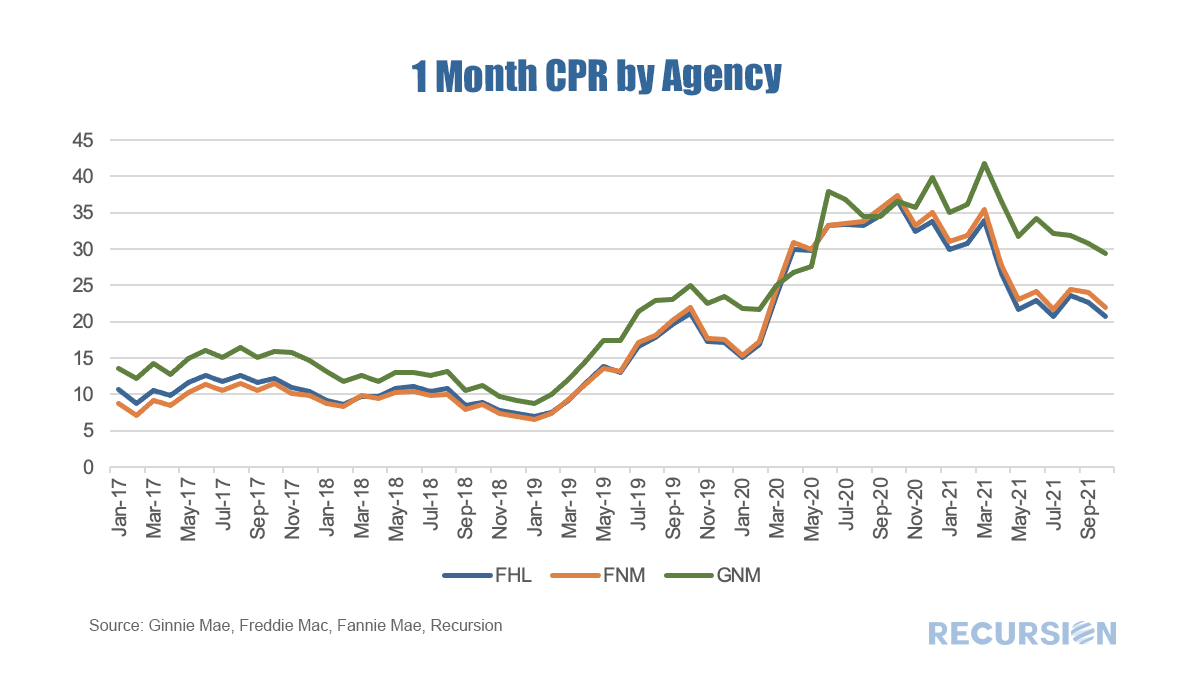 |
Archives
February 2024
Tags
All
|
 RSS Feed
RECURSION |
|

Copyright © 2022 Recursion, Co. All rights reserved.