|
The value of research depends on the consumer. Traders look for actionable ideas to shore up their P/(L), policymakers look for insights into the impact of various regulatory changes, and risk managers look for potholes in the road ahead. The best research informs all of these constituencies by impacting the “big picture” thinking of all of these constituencies. We just got a fine example of the latter from a new paper by Camelia Minoiu of the Atlanta Federal Reserve, and Andres Schneider and Min Wei of the Federal Reserve Board, “Why Does the Yield Curve Predict GDP Growth? The Role of Banks.”[1] An old puzzle in economics is why Treasury Curve yield flattening is an excellent predictor of recessions. The authors conduct a comprehensive investigation into the role of banks in the relationship. A lower term premium, they argue, reduces profitability and the availability of credit. What does this have to do with the mortgage market? Mortgage credit is provided by both banks and nonbanks. Nonbanks, it may be argued, are monoline credit providers whose credit provision is less impacted by this factor. This leads us to the following chart: 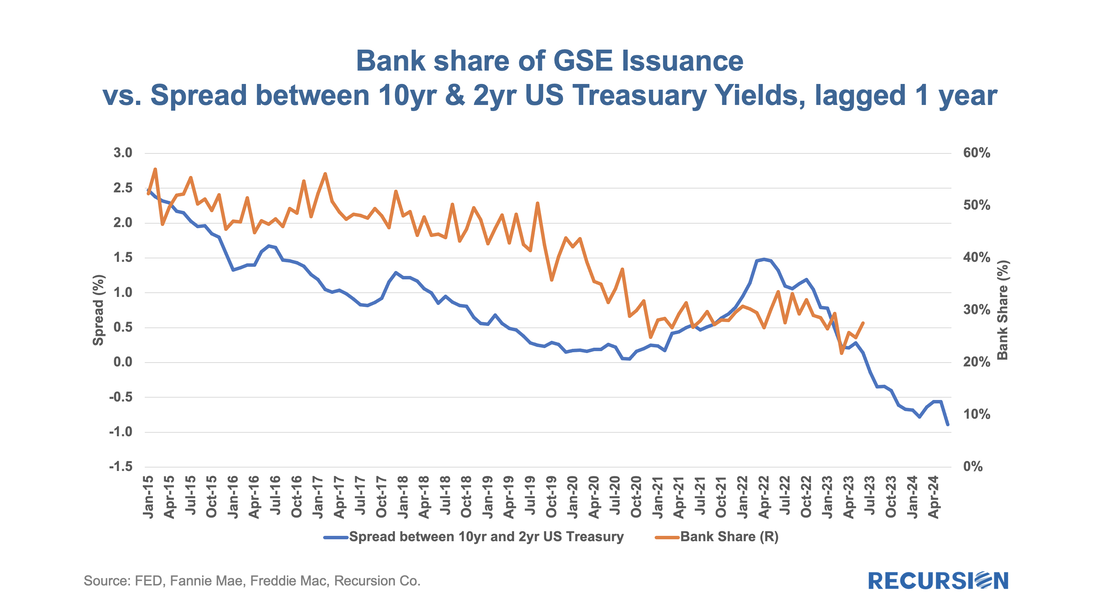 As daily April Agency mortgage loan delivery data completed, we found convincing evidence that the freeze in market activities we have witnessed since the fourth quarter of 2022 is continuing, although there are some new twists. Here is the chart for the loan counts of purchase market deliveries to the GSEs back to 2019. Rather than do this as a time series, we stack the years over an annual monthly x-axis to better correct for the seasonality in the time series: 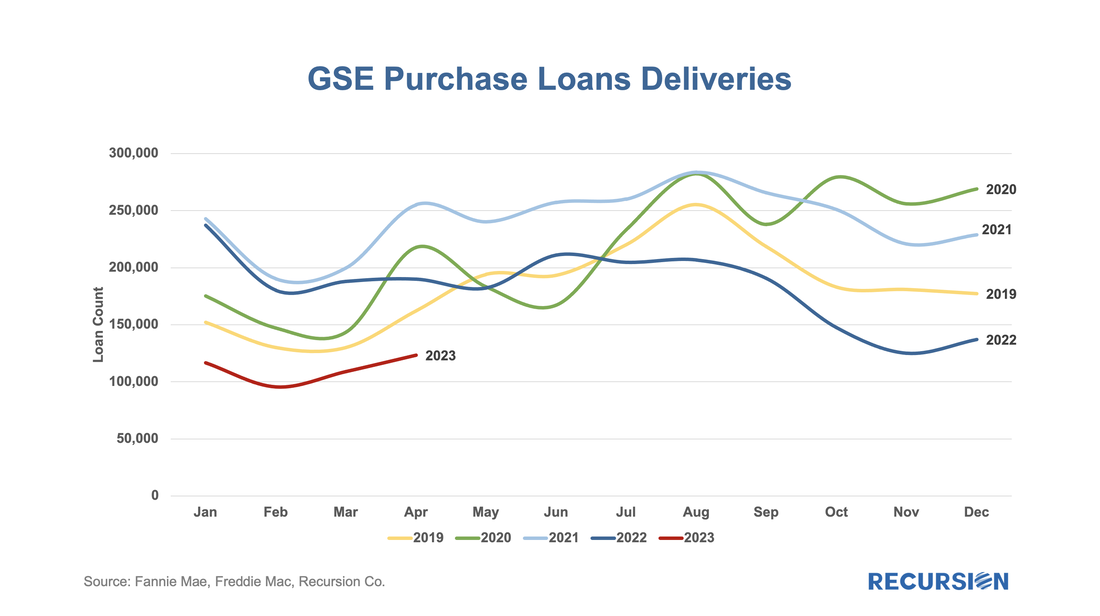 The cherry blossoms are blooming, which means it’s time for the HMDA preliminary data set to be released. The dataset provides a social underpinning to the nation’s mortgage market and enhances our understanding of the behavior of borrowers and lenders. The 2022 dataset has been particularly eagerly awaited, as we get our view on the new world of high inflation and mortgage rates for the first time in decades. We start with origination volumes and get not just confirmation of the onset of mortgage winter, but some breakdown of its characteristics.
In recent posts, we introduced the phrase “Mortgage Winter” to describe the current environment where high-interest rates and elevated home prices lead to a severe drop in transaction volumes[1]. Subsequently, we looked at the impact of this situation on individual market participants[2]. The bulk of market participants across the mortgage ecosystem is experiencing year/year revenue declines of two-thirds or more. These entities are having to adjust their business models to this situation and develop strategies to navigate the uncertain environment ahead. Spring will come, but whether the ensuing rebound will be sufficient to return the sector to a state of financial health is a question that remains far from assured. There is also another factor to consider besides revenue, and that is the potential for increased servicing costs associated with delinquent borrowers. 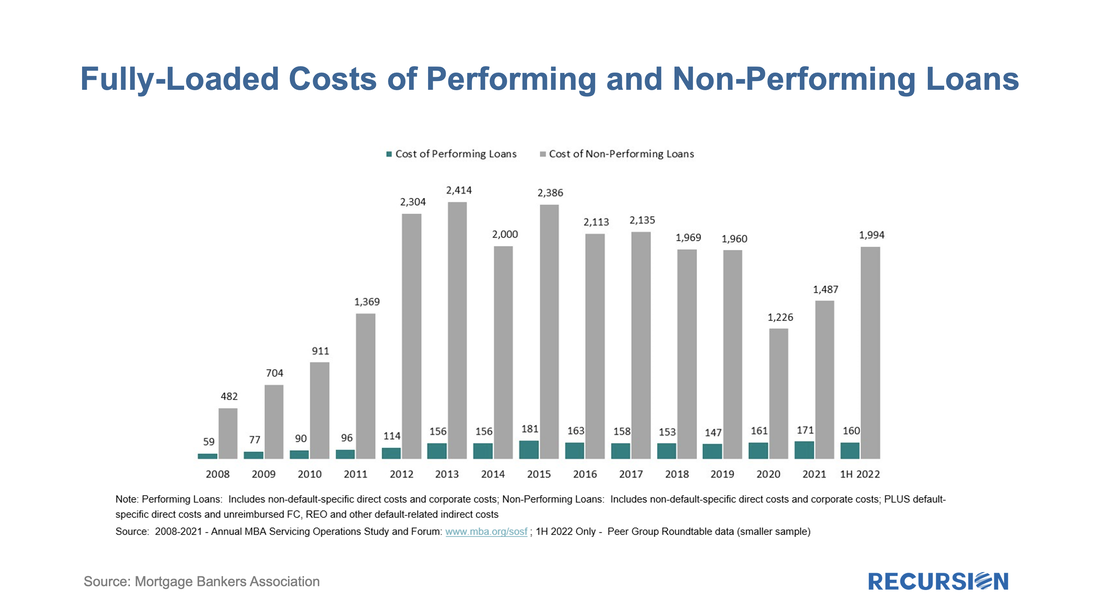 Growing concerns about a looming recession combined with increasing signs of distress in Government mortgage programs, particularly FHA, are leading many market participants to step up their focus on GSE buyouts. These found a recent peak last winter as forbearance programs unwound and have been in a generally declining trend since that time. 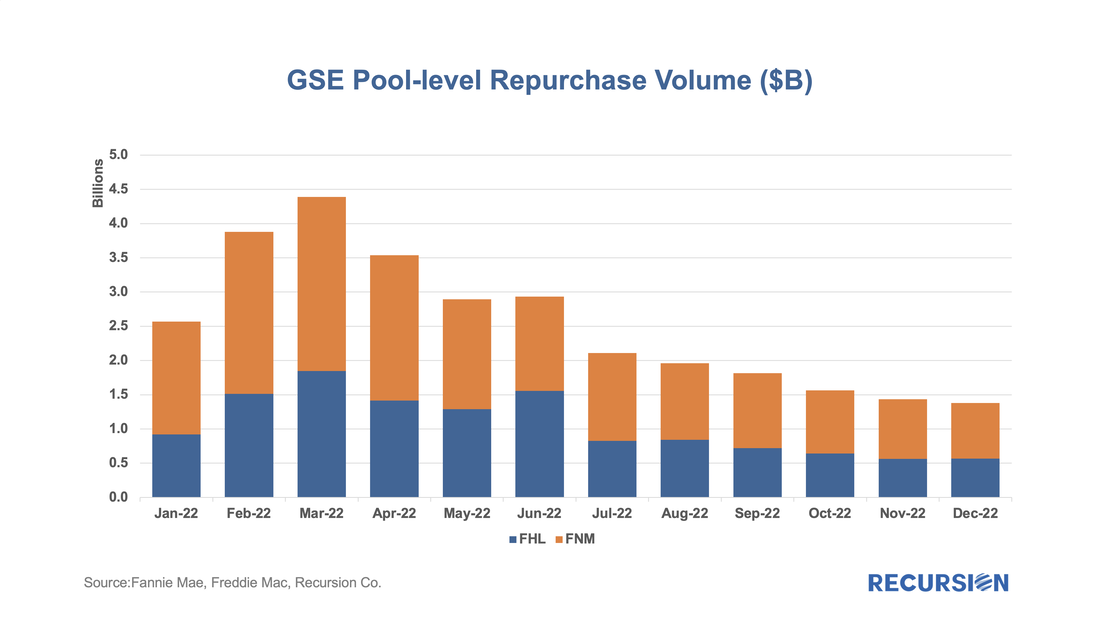 In a recent post[1], we spoke about how the current market environment of high interest and home prices is leading to downward pressure on both supply and demand in the housing market, a situation we call "Mortgage Winter". While this environment is unlikely to result in a severe recession such as the Global Financial Crisis, there is the potential for broad fallout associated with distress in the lender and broker markets. First, we look at the originations. The count of loans that were delivered to the three agencies dropped by 68% from Q4 2021 to Q4 2022: 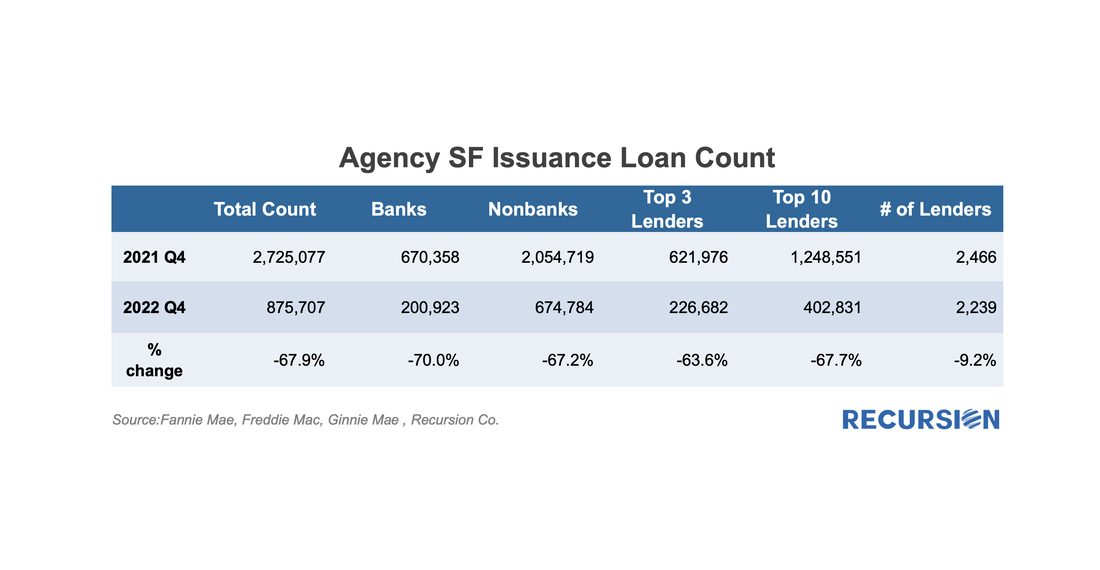 Usually, when we talk about financial institutions in our posts, we focus on sellers and/or servicers as we have a clear view from the Agency disclosures. An interesting distinction in this regard is to break down originations between those sourced through a retail channel within the lending institutions and those purchased from other lenders, known as third-party originations (TPOs). We are often asked the question in the case of TPO lending, where only sponsors of the mortgages are reported, who are the originators? This information is not reported in the agency loan-level disclosure. We can supplement this information by examining originators in the HMDA data by observing the fact a TPO (correspondent or broker) loan is often reported twice, one record reported by the originator and another reported by the sponsor. At Recursion, we conducted an exercise by matching the pairs together, and we were able to identify the counterparty pairs for about 50% of the mortgages marked as “purchased”, and also made this revealing data point to our HMDA Analyzer users. According to the 2021 HMDA preliminary release, about 2.65 million loans were purchased from other lenders that year, about 18% of all originations. Roughly half of these purchases were made by 10 institutions: 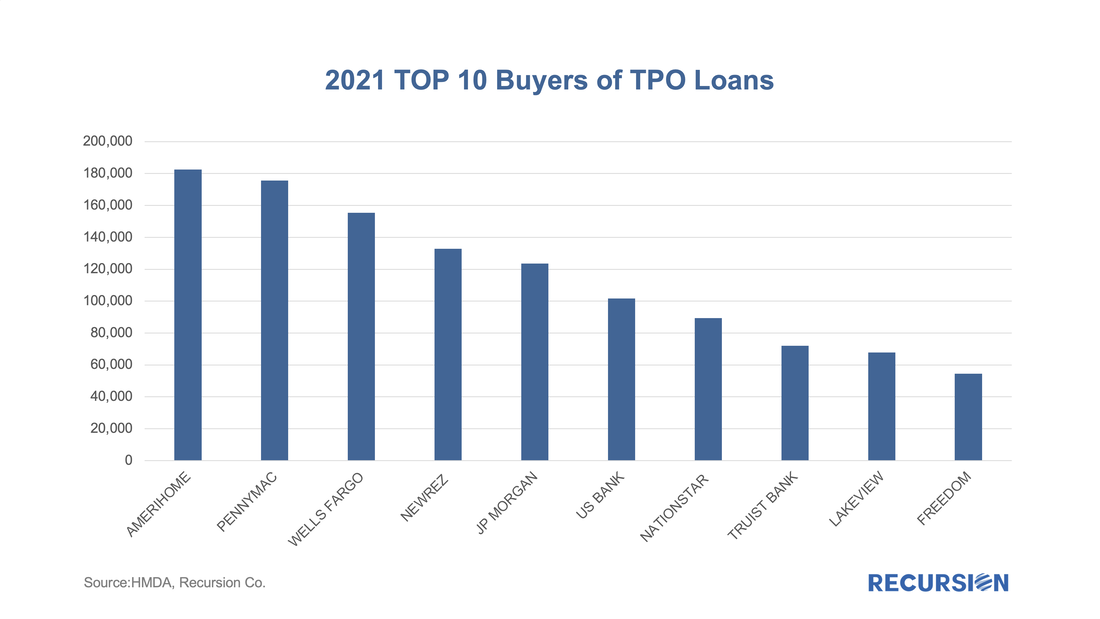 While the Fed has clearly been the dominant player in the MBS market for the last 13 ½ years, the consistent biggest holders of MBS have been the banks. When the Federal Reserve launched its QE program in late 2008, banks held about 16% of the outstanding balance at the time, and that share has more than doubled as of Q1 2022 to stand at about one-third of the total. In a recent blog, we dug into the details behind international investor behavior with an ancillary dataset[1], for the banks, we look for guidance from the Call Reports[2]. The Call Reports provide details on portfolio holdings of individual banks across financial asset categories (e.g., equities and bonds) for both loans and securities. For the purposes of this note, we just look at securities. What makes bank behavior so challenging to assess is that various types of policy actions have profound impacts on their investment decisions. To begin, we look at the share of residential agency MBS out of total bank assets, including both pass-through securities and CMOs: 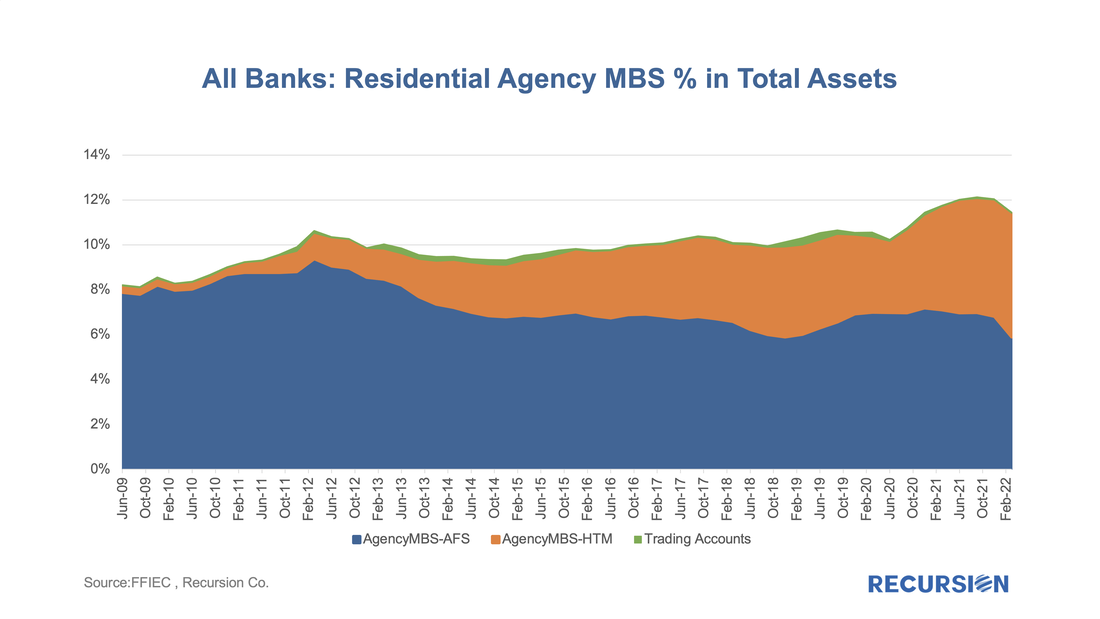 |
Archives
February 2024
Tags
All
|
 RSS Feed
RECURSION |
|

Copyright © 2022 Recursion, Co. All rights reserved.