|
The Covid-19 pandemic has resulted in a great economic shock that has been met with a tremendous policy reaction in the form of interest rate cuts and MBS purchases by the central bank. Prepayments have picked up substantially during the year. The question arises as to whether the magnitude of the response is unusual compared to previous episodes of rate declines, and whether they can rise further should borrowing costs fall further. The magnitude of the relationship between rates and refis is complex and depends crucially on a number of factors. First, the relationship is path-dependent. That is, it doesn’t just matter if rates fall 1.0%, but whether this decline takes rates to new lows so that the biggest possible set of borrowers can profitably refinance. Great gobs of sophisticated statistics and modeling go into forecasting prepays on the part of lenders and investors. But a look at prepays over time shows three main waves of refis over the past 20 years. The first (A) is 2000-2003, (B) 2008-2013, and (C) 2019-2020. In all three instances, rates reached new lows. The dates correspond roughly to the times when the mortgage rate broke to a new low until a new trough was formed (or the present in the case of “C”) 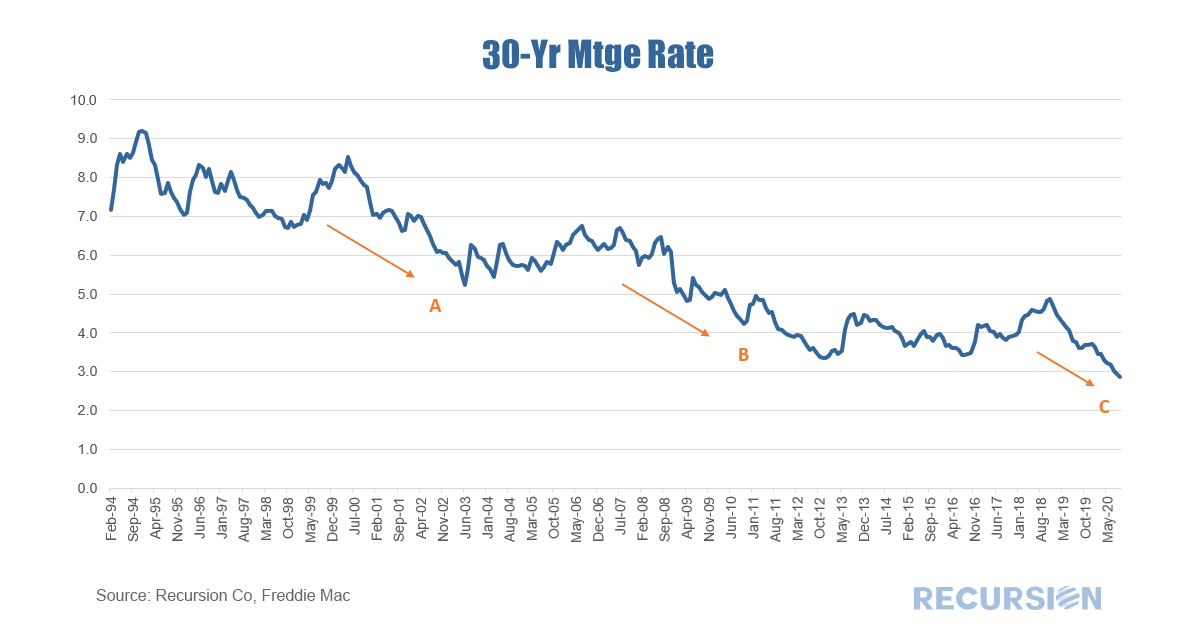 Here are the corresponding periods for prepays: 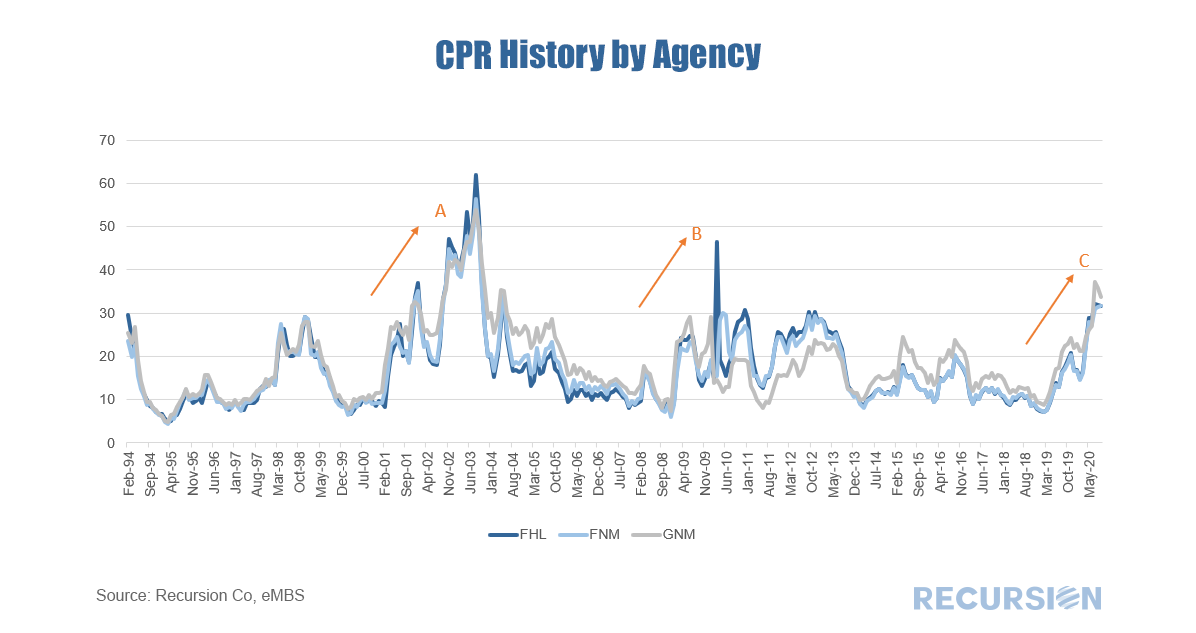 Here are the corresponding periods for originations: 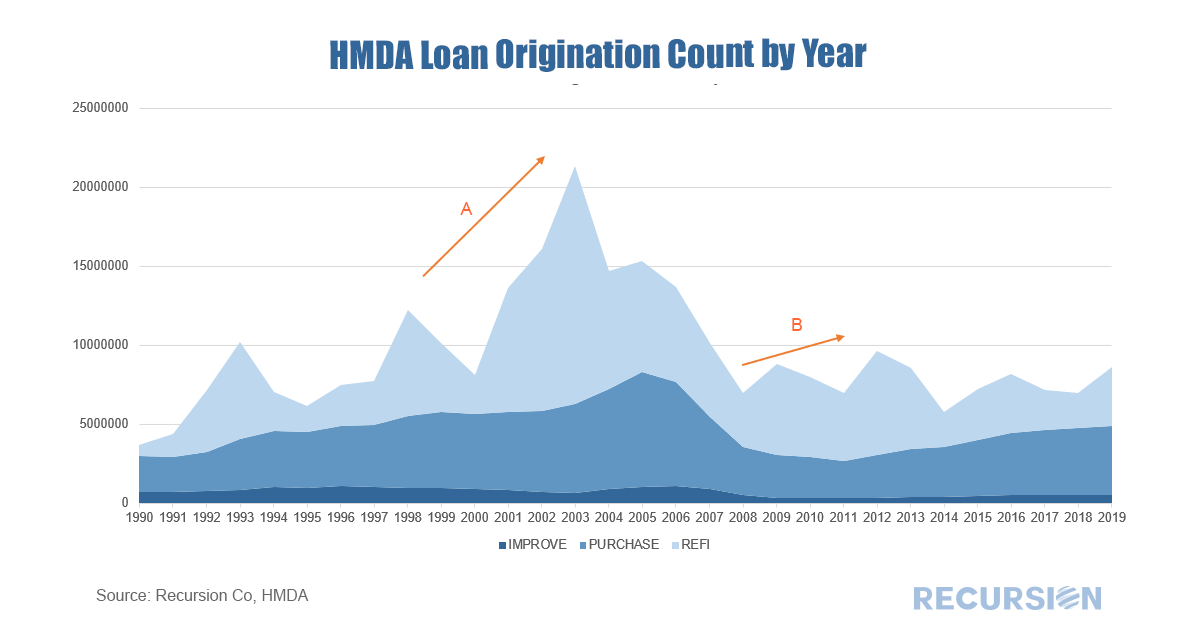 Here is a summary of the three periods: 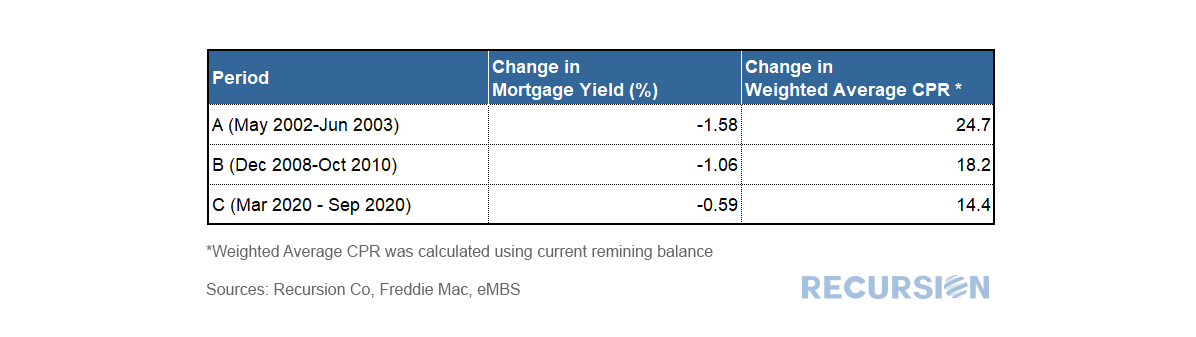 Notably, the biggest jump in prepays occurred in the early 2000s, reaching a record high of 60 CPR. Rates had fallen substantially based on aggressive Fed ease in the wake of the bursting of the tech stock bubble. This passed right through to refis. There was also a substantial decline in rates with the Global Financial Crisis(GFC), but the refi response was more muted due to declining house price, but perhaps also more stretched out in time (off and on through 2013). The current episode with Covid-19 has resulted in record-low mortgage rates, and a substantial spike in refis, but still well below the experience of 2002-04. What might explain the differences? A clear place to look is at credit conditions. If rates drop the same amounts in time periods X and Y, but credit conditions are tighter in Y than X, we can reasonably expect a bigger refi impact in X than Y. Below shows the Urban Institute’s Housing GSE Credit Availability Index, which is used to evaluate lender’s risk tolerance: 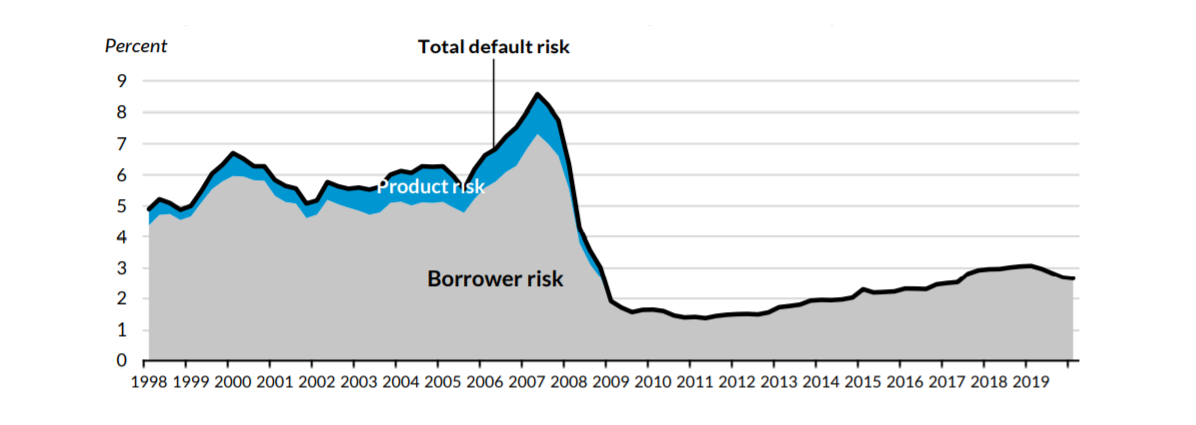 Note: Urban Institute’s Housing Credit Availability Index for GSE Chanel. Adapted from Urban Institute Housing Finance at a Glance (August 2020). (https://www.urban.org/research/publication/housing-finance-glance-monthly-chartbook-august-2020)
As can be seen, credit was extremely loose before the GFC, very tight thereafter, followed by a period of modest loosening until 2019. This correlates well with the magnitude of the response of prepays to interest charges in the three regimes. Too hot, too cold and just right? Maybe. All of this is important not just for investors but for the central bank as the Fed attempts to steer the economy through this uniquely uncertain period. Recently, credit conditions appear to have started tightening. It’s unclear whether this is a “normal” market reaction as volumes rise and capacity is constrained (good credits are easier to process) or whether lenders are becoming more cautious based on a more pessimistic view of the economic outlook. There is a big difference between the two in terms of choosing a successful investment strategy or an optimal monetary policy. The answer is unlikely to come from attempts to model borrower and lender behavior in a nuanced way and more likely to be discerned by careful observation of emerging trends in big data sets. We have commented previously on the rising share of nonbank deliveries to the GSE’s in the wake of the Covid-19 crisis[1], but the data just released for the month of July shows this trend to be picking up at an astonishing pace. This time, let’s break the market up into two pieces: Purchase and Refi: 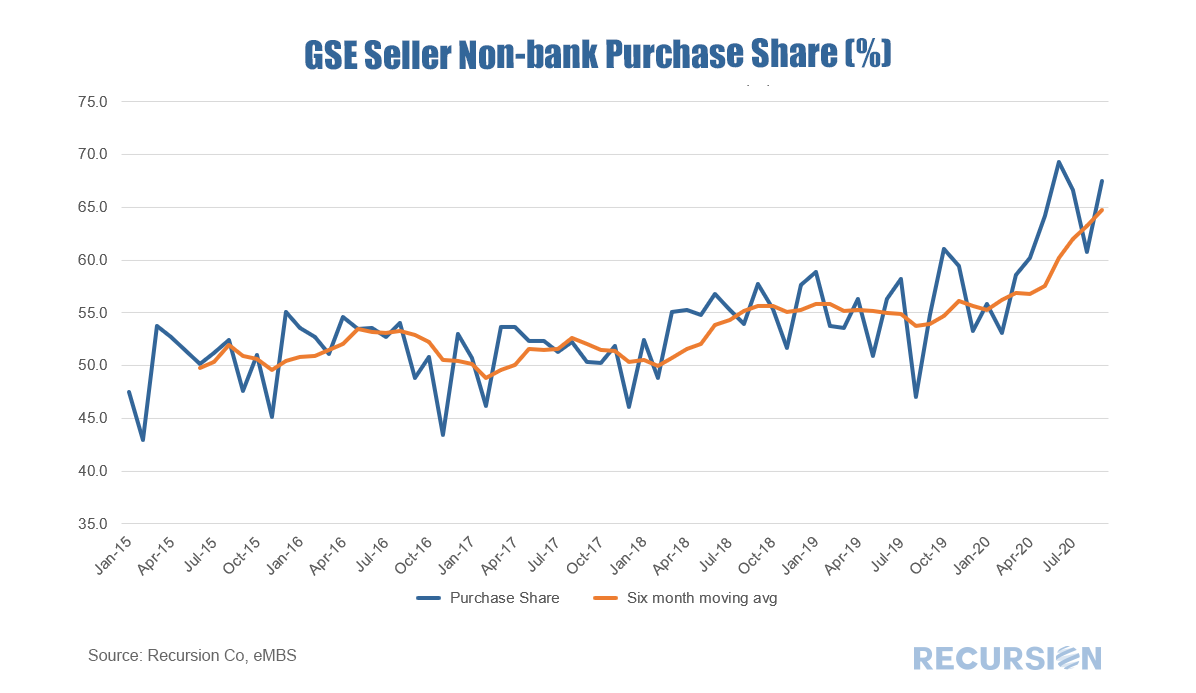 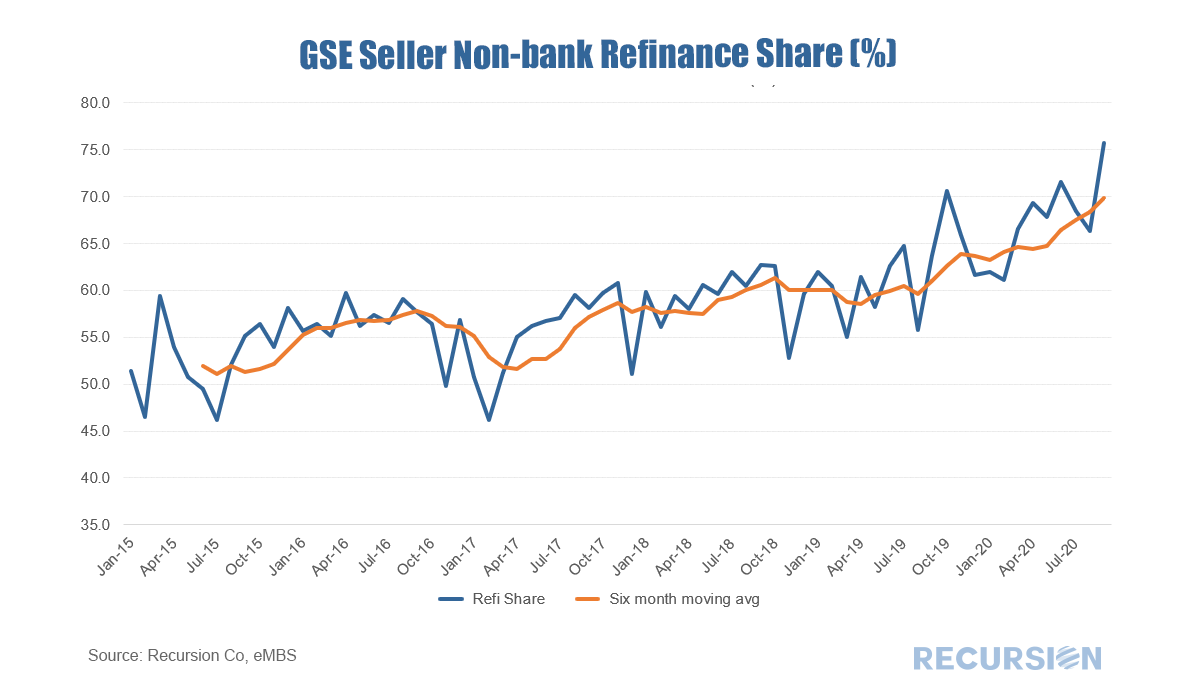 In a recent post we looked at the agency composition of the recent surge in MBS production[1]. We observed that Ginnie Mae’s market share in the three months to July 2020 is significantly below that experienced in the same period a year ago. The bulk of the decline is due to a drop in the refi share, while the purchase market share experienced less than a 1% decline. There are several drivers of share for purchase market share, including program design, the coupon spread between the government and conforming sectors, and differences in the credit boxes between the two. This note looks at competitiveness through the lens of the latter factor, credit boxes. As noted in the prior post, Ginnie Mae is the securitizer for four different programs, with the two biggest being FHA and VA. VA has a fairly unique set of program requirements, so the main competition in the purchase mortgage space is between FHA and the GSEs. In the three months to July 2020 FHA lost about 2.5% of its share in the purchase mortgage space compared to the GSEs. Let’s dive into credit factors, starting with credit score: 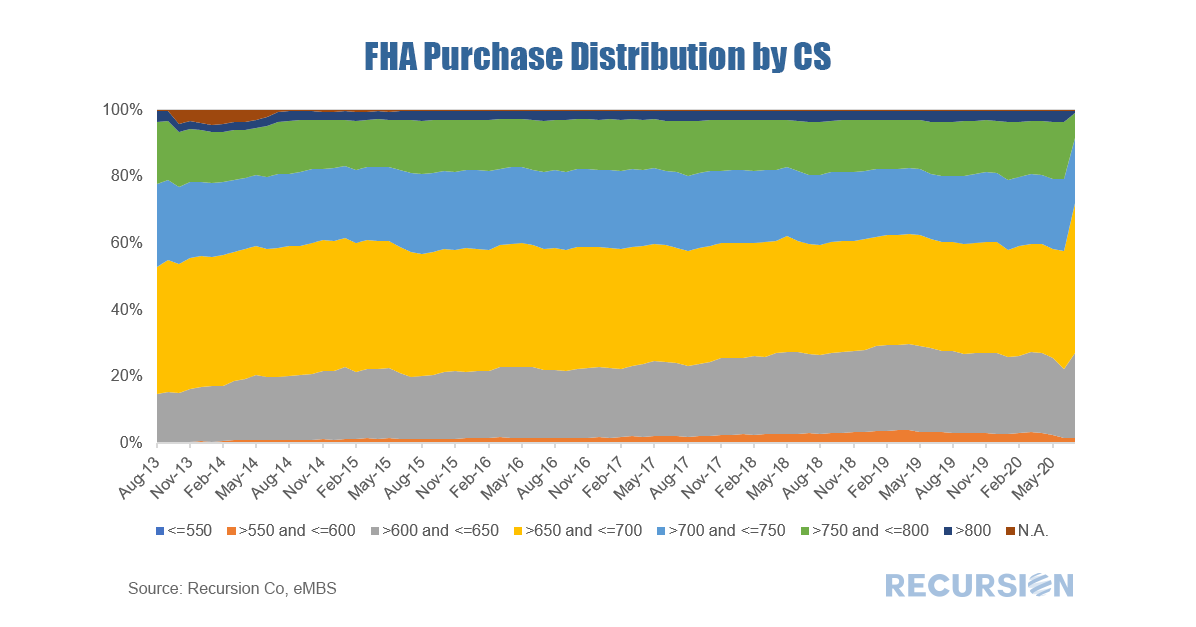 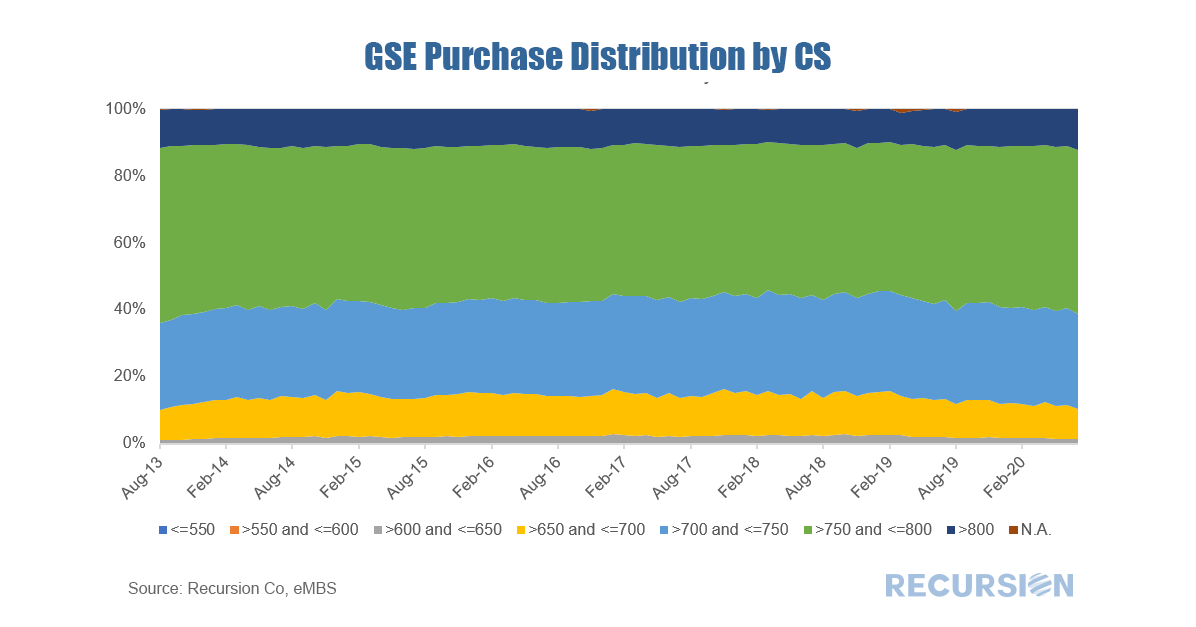 2019 HMDA data has been released and is loaded into Recursion’s HMDA Analyzer so clients can perform consistent queries back to 1990. As always, a vast wealth of information is available. Below are several high-level observations. First, total originations rose by over $700 billion compared to 2018[1], a 13-year high. The bank share fell for the eighth consecutive year, reaching a record low of 37%. This was down 1 percentage point from 2018, the smallest decline posted for 8 years. Nonetheless, banks have suffered a remarkable 30-point drop in market share since 2008. 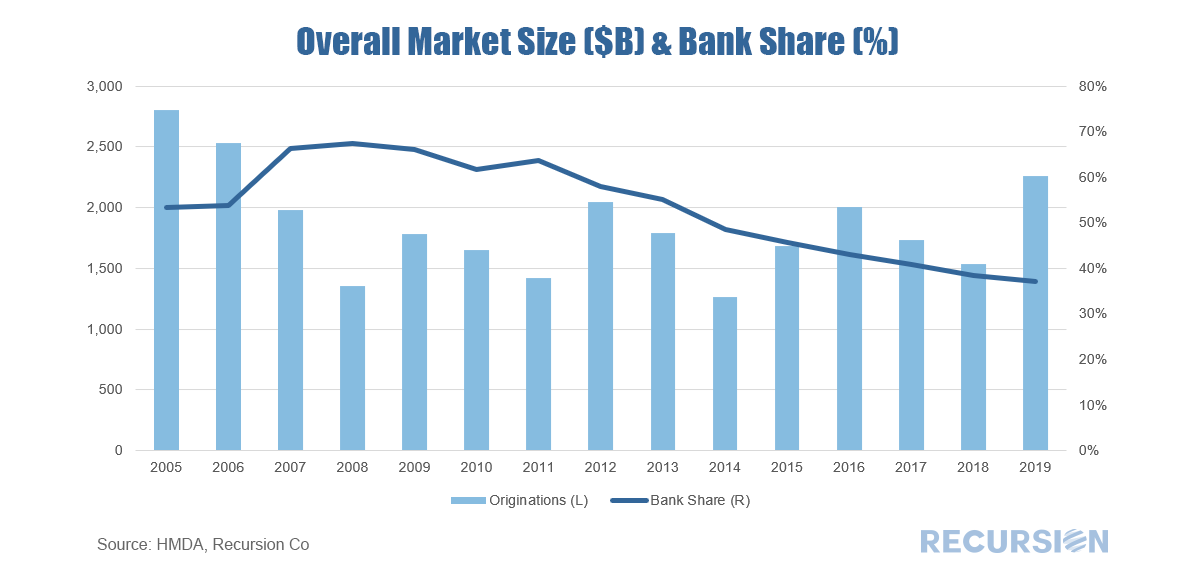 In a recent post, we noted the surge in new mortgage deliveries to a record level[1] in July. Besides this sharp increase, there is an interesting shift in the composition of these deliveries in the form of a striking decline in the government share. 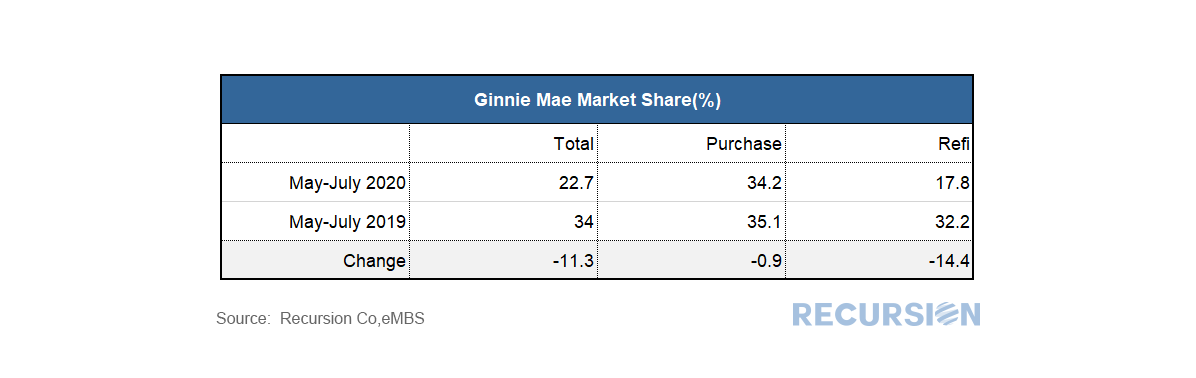 Cyclical and secular factors are coming together to boost agency mortgage production. On the cyclical front, record low mortgage rates are the key driver of surging refi activity. Purchase activity is supported as well by low rates, but there are also indications that secular changes surrounding lifestyle choices sparked by the Covid-19 pandemic are leading homeowners to change residences away from the largest urban centers[1]. 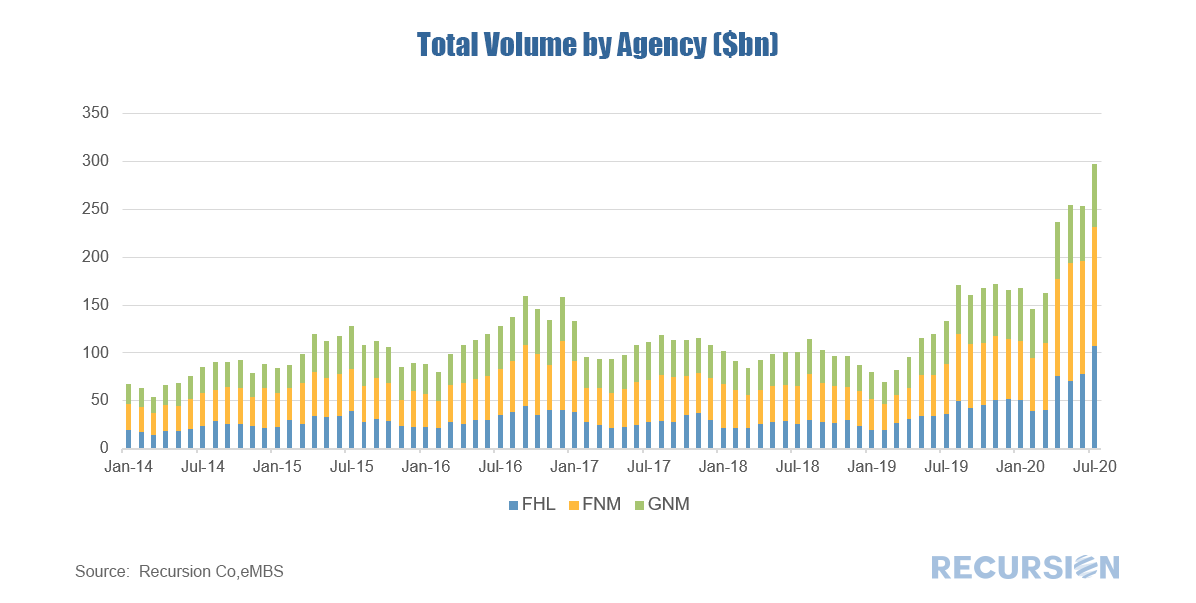 The drop in the 30-yr mortgage rate to close to 3.0% has worked to keep purchase mortgage securitizations relatively steady while refinancing activities have soared to record highs. Refis in Q2 2020 for the GSE’s came in at more than twice the next highest quarterly figure reported over the past seven years: 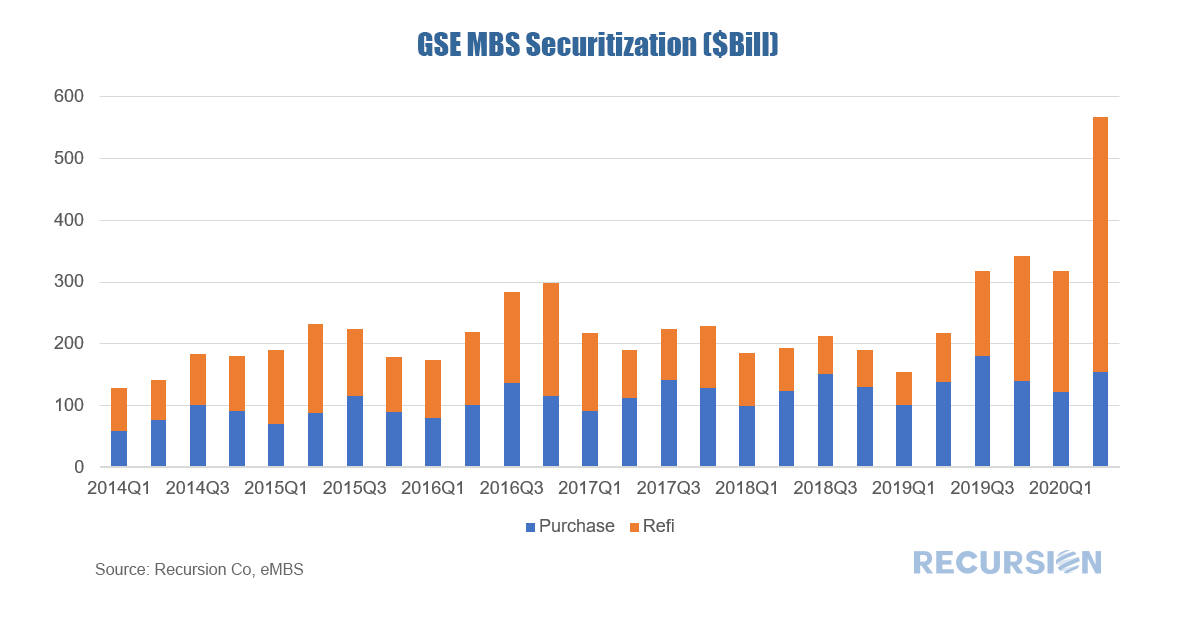 Besides the sharp drop in rates, another factor in this sudden surge compared to previous years is the increasing use of Property Appraisal Waivers. With the transaction costs of refinancing going down as a result, it appears that refis accelerated compared to prior episodes of falling rates. To look at this a bit deeper, below find 1-month prepayment speeds of both PIW loans and PIW eligible purchase loans for the two agencies[1]: 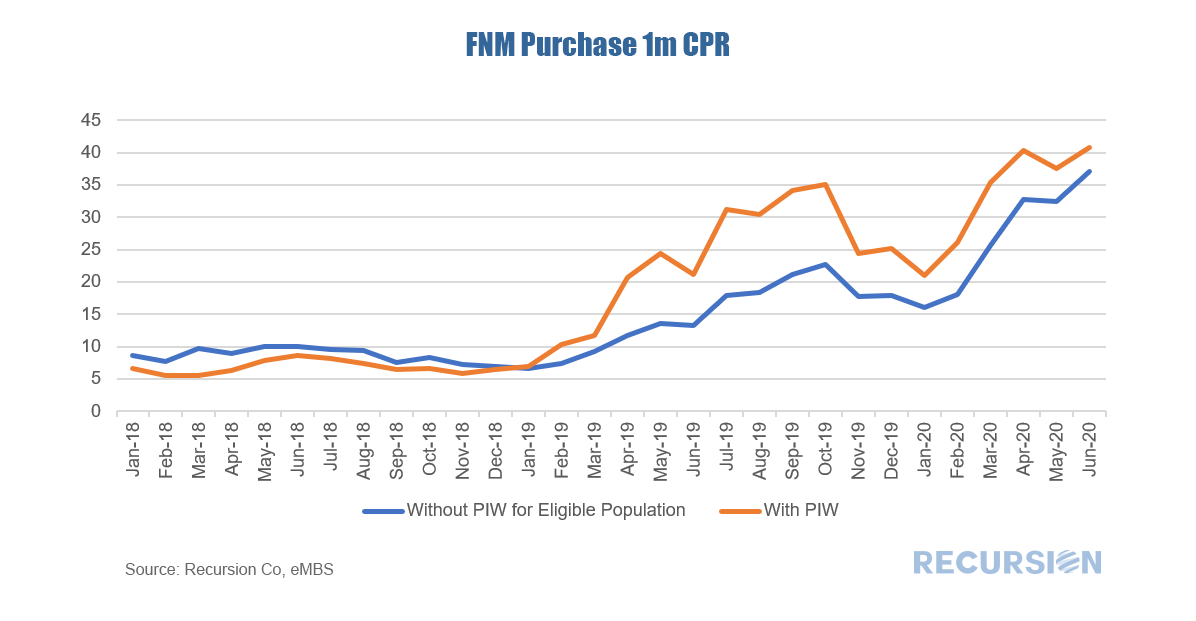 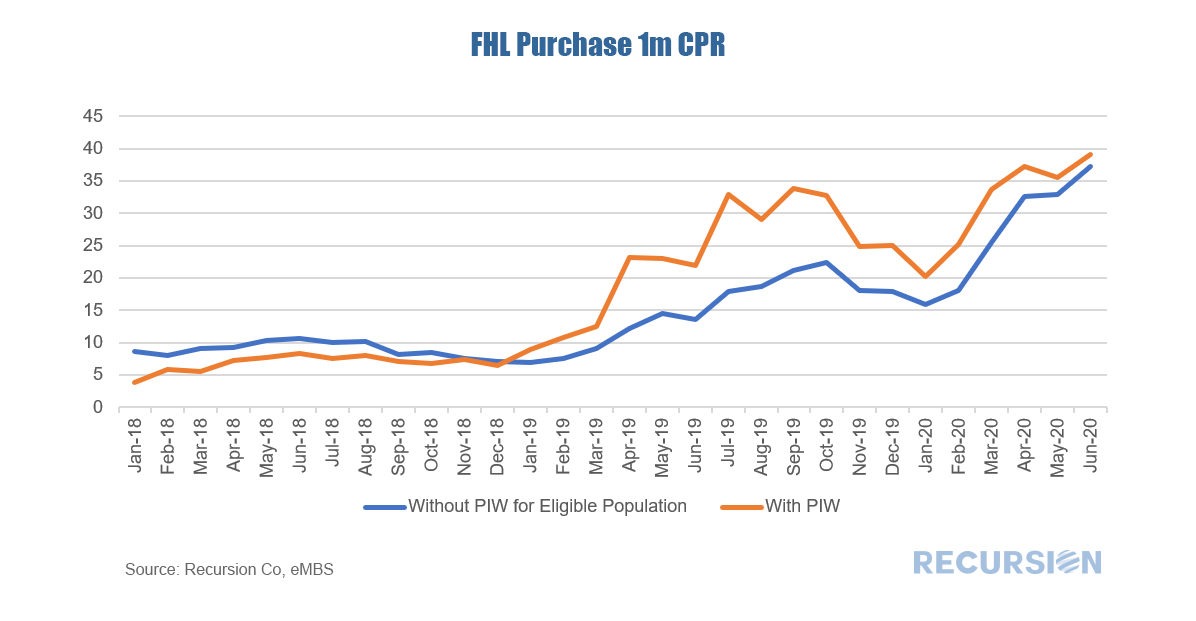 For both agencies, it appears that loans with appraisal waivers prepay faster than eligible loans without, but the impact diminishes over time in part because there are fewer such loans with a PIW left that haven’t prepaid. In fact, for non-cashout refis the impact is even more pronounced: 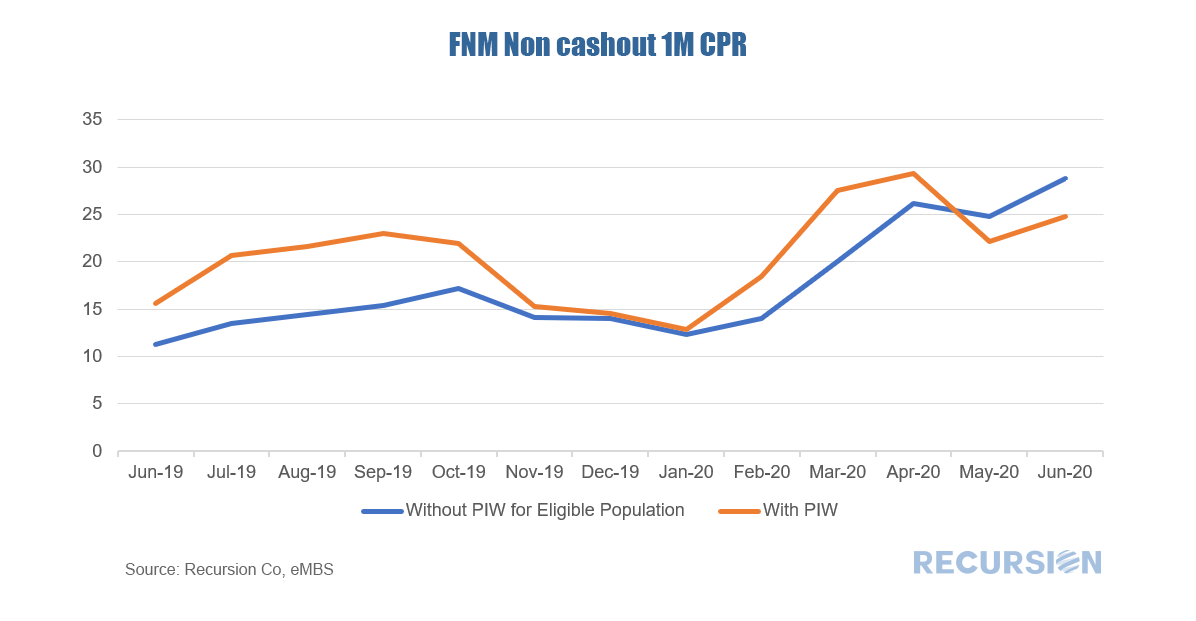 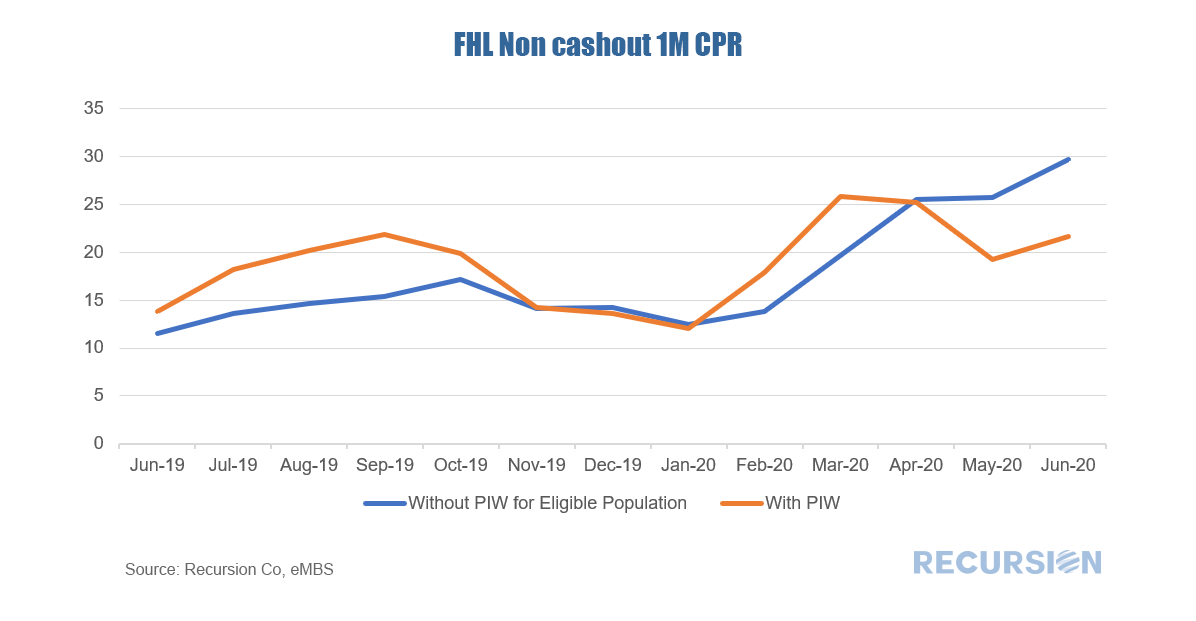 In this case not only have prepayment speeds for this category of loans with appraisal waivers slowed relative to others, but in the last couple of months they have actually become slower compared to other eligible loans. A combination of unprecedented policy moves and market developments have served to upend conventional mortgage market analysis, underscoring the need for new thinking, and new tools. [1] For a description of eligibility criteria see https://www.recursionco.com/blog/property-inspection-waiver-eligible-population
Appraisals play an important role in managing the risks associated with residential mortgages. Since 2017, both Fannie Mae and Freddie Mac (GSEs) have published multiple rules (see Appendix below) for lenders to qualify mortgage applications for property inspection waivers (PIW). PIW can reduce the cost of mortgage transactions. However, PIW raised concerns of improper usage among investors, mortgage insurers, regulators and other players in the mortgage market. In particular, research has shown that loans with PIWs prepay much faster than loans without.
In March 2020, both Fannie Mae and Freddie Mac released loan level information regarding “Property Valuation Method” which included the Appraisal Waiver information. The new data regarding PIW’s offers the opportunity to study how this program affects the market. |
Archives
February 2024
Tags
All
|
 RSS Feed
RECURSION |
|

Copyright © 2022 Recursion, Co. All rights reserved.