
|
In prior posts, we commented on trends in the distribution of risk in the mortgage markets of single-family residential[1] and multifamily markets[2] from the Federal Reserve Z.1 data. This note takes a look at the commercial mortgage market[3] in a similar fashion. Other than the multi-family category, commercial mortgage for properties such as office, retail, hospitality etc is not normally in our wheelhouse at Recursion, but insofar as it is a substitute as an investment vehicle for the residential markets it is useful to take a look at trends here. Commercial mortgages (excluding multifamily) are exposed to unique risk due to COVID-19, as it is very likely offices, hotels and shopping malls will never to able to achieve the same occupancy rate as before the pandemic. 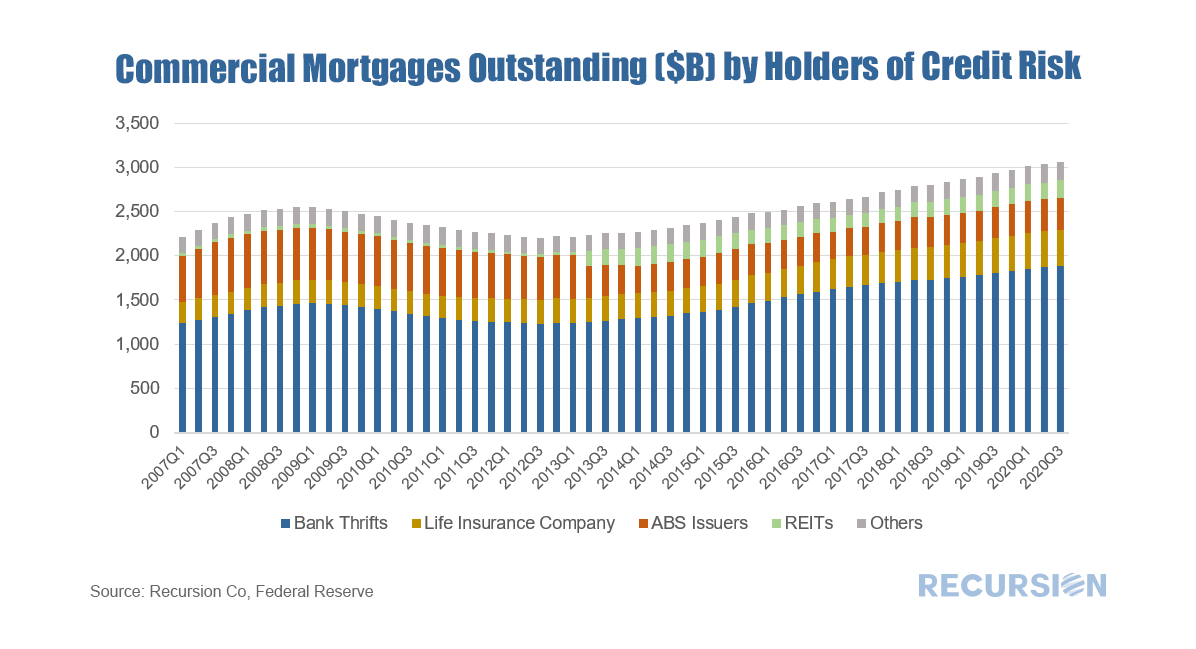 The commercial mortgages(excluding multifamily) outstanding crossed the $3 trillion threshold in Q1 2020. Of interest is that the dominant holder of this risk is banks and thrifts. Their share has been in a narrow 1% range between 61.4% and 62.5% over the past four years[4]. This observation leads naturally to the question of bank holdings across the residential and commercial categories: 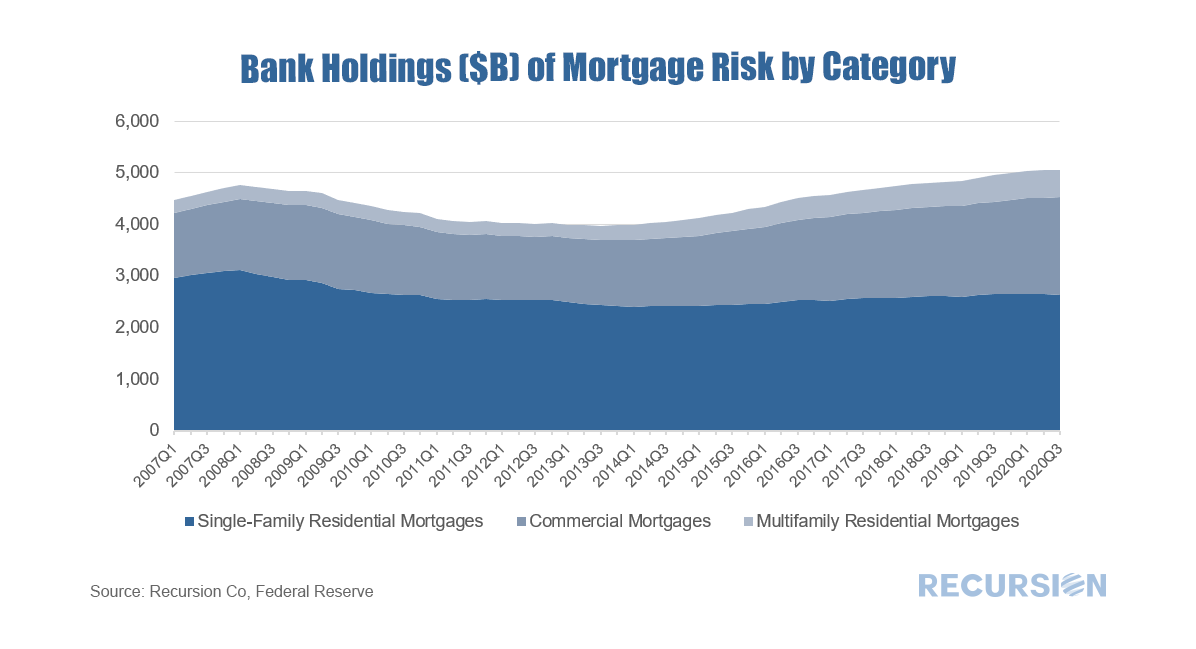 What is interesting is the steady drop in the share of single-family mortgages held on bank balance sheets over the past dozen years by about 1% per year (currently 52.1%). [5]The impact of Covid-19 on this trend appears to be quite small. Both multifamily and commercial mortgages have gained shares. It’s worth noting that banks hold sizable amounts of single-family MBS in addition to loans, on the order of $2.9 trillion [6] in Q3 2020. In this case, the agencies hold the credit risk, not the banks. There is ample room for banks to boost their holdings of residential loans, one more item to watch in the transition year 2021. [1] https://www.recursionco.com/blog/that-was-then
[2] https://www.recursionco.com/blog/big-data-and-the-multifamily-market [3] Also called “nonfarm, nonresidential” in the Federal Reserve Z.1 data [4] From Q4 2016 – Q3 2020 [5] The denominator of calculation only banks’ holdings of single-family mortgages, multifamily mortgages, and commercial (non-farm, non-residential) mortgages; It does not include the “farm” sector on the Federal Reserve Z.1 data [6] According to L.211 Agency-and GSE-Backed securities outstandings from the Federal Reserve Z.1 data We’ve written previously that the multifamily market will be of growing interest during the course of 2021[1]. During the Global Financial Crisis, the single-family market was ravaged by foreclosures resulting from the popping of the housing bubble. The large number of households losing their homes became renters to a large degree. This time is different. Renters are fleeing congested urban areas and are buying homes in areas with more space, serving to push up house prices while rents are under downward pressure. According to the Elliman Report, the rental vacancy rate for Manhattan in November 2020 was 6.1%, compared to 1.8% a year earlier.[2] This figure will of course vary considerably from place to place. The potential for more vacancies remains once the various Federal and Local Covid-19 bans on evictions are allowed to expire. According to Trepp, the national 30+ day delinquency rate for multifamily loans in December 2020 was 2.75%, up modestly from 2.00% a year earlier[3].
The role of the Agencies in the multifamily debt market is significant, but less than the overwhelming presence seen in the single-family market[4]. Data disclosed by the agencies provides a wealth of information about the rental market but did not receive widespread attention until recently. In this post, we discuss trends in multifamily loan maturity schedule and prepayment penalty schedule. This data is of interest because unlike the single-family market, there are fewer apartment loans, but they are generally quite large. Maturities can clump, leading to periods of time when capital demands can push borrowing costs higher. On the other hand, opportunities for lenders arise when loans mature or exit the prepayment penalty window. While the single-family housing market is booming, the trend in the multifamily market is much more nuanced. Over the 3 ½ year period from July 2017 to December 2020, new supply as measured by housing starts was in a steady-to-modestly rising trend. This changed with the onset of the Covid-19 pandemic: 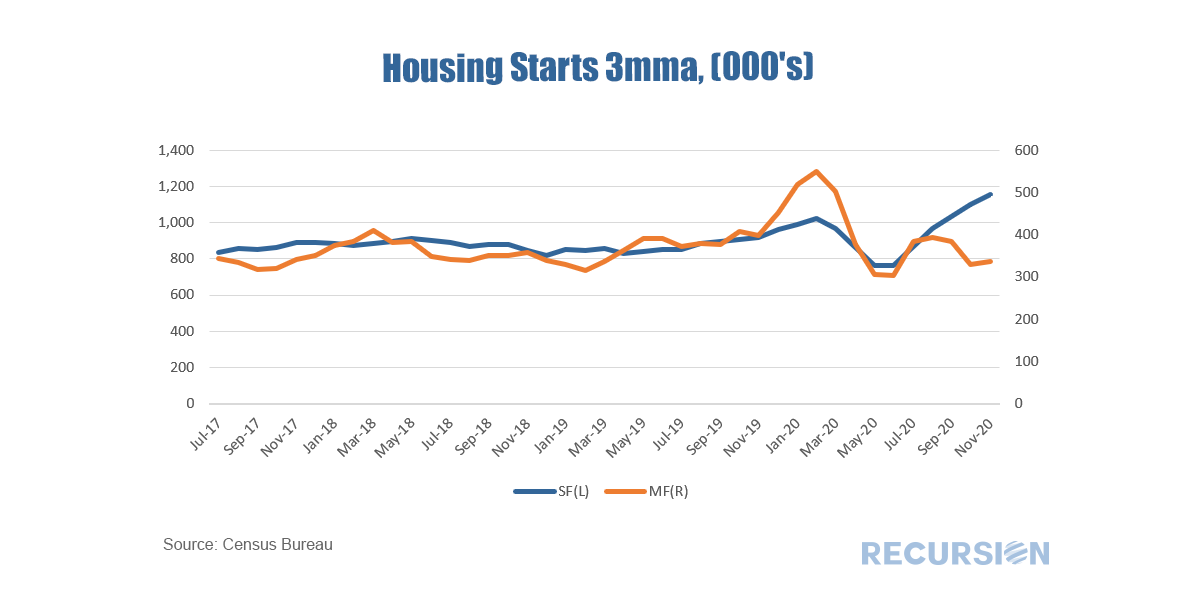 The Global Financial Crisis (GFC) of a dozen years ago was at its core a housing crisis. More specifically, it was a single-family mortgage crisis as imprudent lending led to a huge surge in home sales in a bubble that simply could not be sustained. The resulting collapse led to the biggest economic shock since the Great Depression. Until, perhaps, now. The other segment of residential housing, the rental market, skated through almost unscathed. While almost nine million people lost their jobs, including renters, millions of families lost homes and had to turn to rent, keeping the multifamily market afloat.
As is the case for residential mortgages, every month Ginnie Mae publishes data on loan-level delinquencies for its commercial real estate programs. The structure is a bit different than for single family, with different categories (the dominant one being FHA multifamily, but also hospitals and nursing homes). In this short post we look at recent performance for FHA multifamily and nursing homes. Traditionally, multifamily DQs for FHA are low because these loans are concentrated in affordable housing, where there is a persistent condition of excess demand. The costs of eviction are low and new tenants are ready to move in. But this is not necessarily the case in the COVID-19 era as the economic impact falls most heavily on the lower income working class, so there are fewer people who can afford affordable housing without support from government income programs such as jobless benefits. 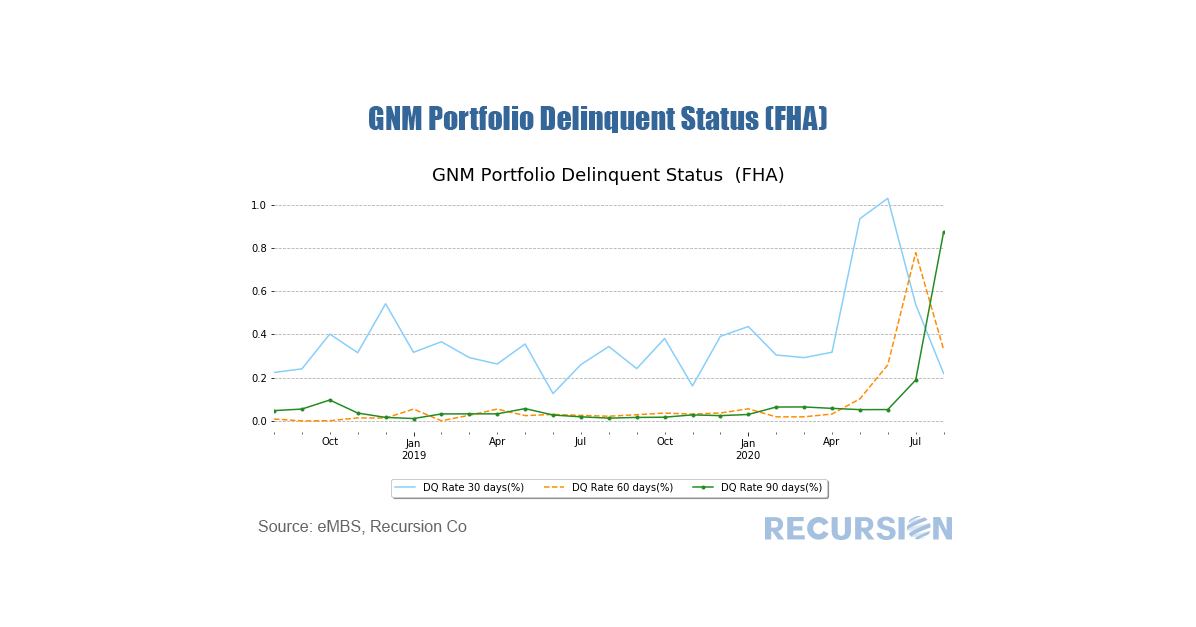 During the 2008 global financial crisis, the agency multifamily CMBS (commercial mortgage backed securities) and the RMBS (residential mortgage backed securities) markets performed differently as measured by delinquency rates. For example, at the peak of the financial crisis in Feb. 2010, single family Fannie Mae loans had a 90+ day delinquency rate of 5.6% in Feb. 2010, compared with their multifamily 60+ day delinquency rate of just 0.8% in Jun. 2010. However, the historical performance cannot guarantee the same relationship will hold during the current Coronavirus pandemic. The huge surge in unemployment currently being experienced will fall equally on renters and homeowners alike. The CARES act provides forbearance to households with mortgages, but there is no such broad program for renters[1].
|
Archives
August 2026
Tags
All
|
 RSS Feed
RECURSION |
|

Copyright © 2024 Recursion, Co. All rights reserved.