|
With home prices at record high levels and mortgage rates at their record highs since the turn of this century, it’s natural to ask if the housing market will be the source of new systemic risk. Over the past year, we have written extensively about “mortgage winter”, a condition where housing demand is held back because of affordability, while at the same time, supply is constrained by current homeowners who are locked into properties by mortgages with rates far below those available in the prevailing market. This is what economists would call a “bad equilibrium”, a state of great strains in the market that tends to persist. While the housing finance industry is under great duress, the spillover to the broader economy remains limited, as for example, the labor market has held up well despite soaring borrowing costs. Within housing, the notable good economic news is that the extraordinary surge in house prices in the wake of the Covid-19 pandemic has resulted in an astounding 50% surge in the value of homeowner’s equity in real estate since Q1 2020 to over $30 trillion. 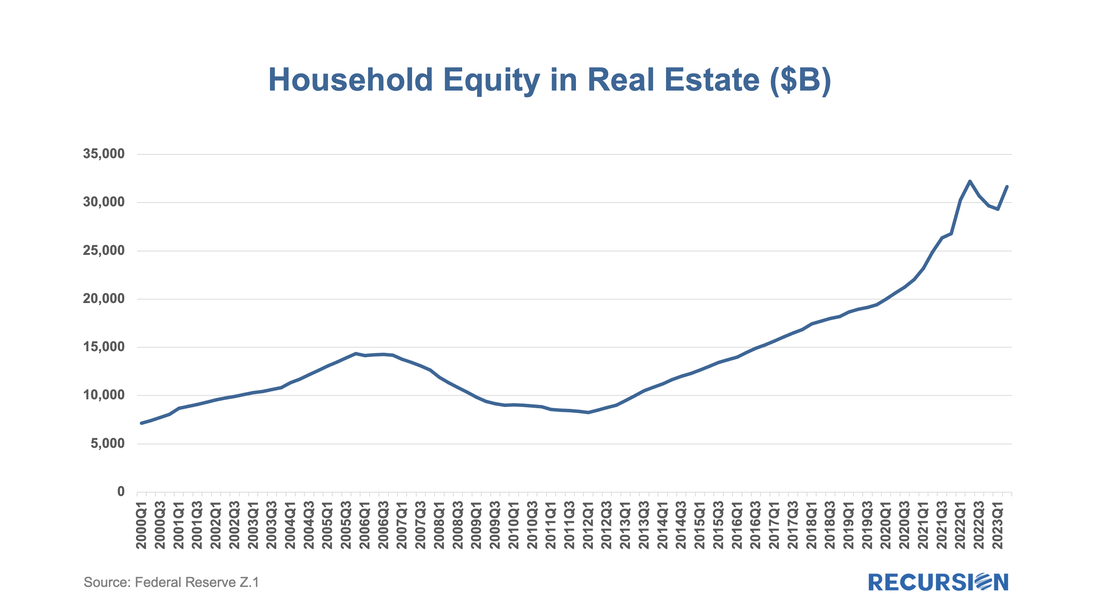 On June 29, 2023, both Fannie Mae and Freddie Mac announced enhancements to their MBS disclosures starting with the September monthly release[1]. The data covers active pools issued back to January 2022. As rates were quite low prior to this time, these disclosures cover the relevant period of high demand for buydowns: 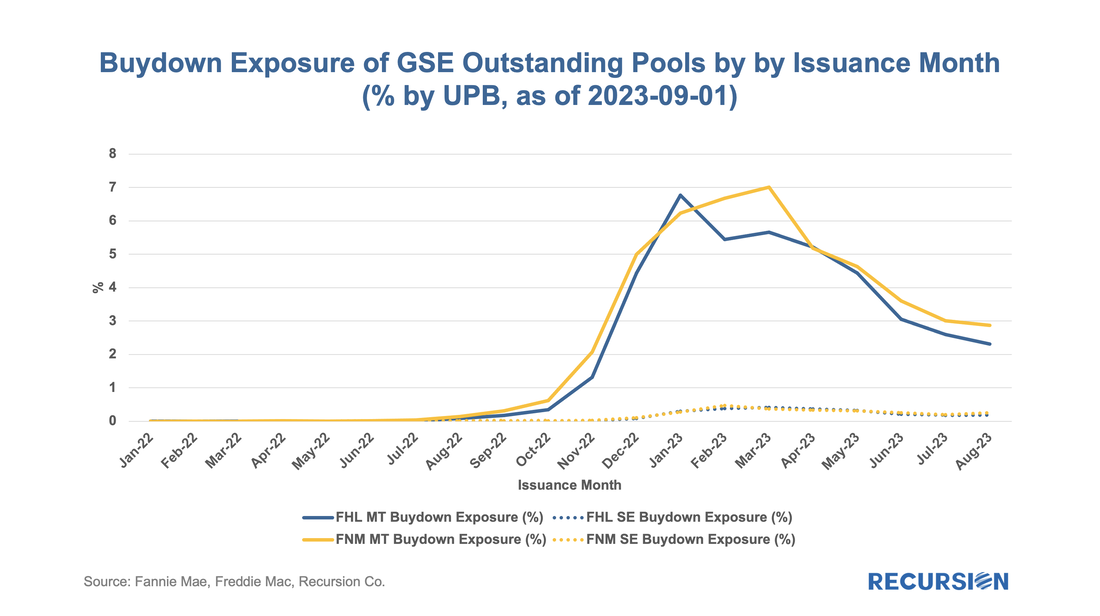 In a recent post, we discussed trends in commercial real estate outstanding debt, with an emphasis on the Agency multifamily market[1]. We mentioned that the key difference between risk sources associated with multi- and single-family debt is that the I/O structure and balloon term that predominates in multifamily loans implies that there is significant refinance risk in this market. We also previously wrote that we have collected all the loans in the major Agency multifamily books and verified that this data was consistent with the Federal Reserve’s Z.1 report[2]. We are now prepared to take some first steps at estimating the extent of this risk. To simplify things, in this note, we look just at the two major GSE multifamily programs, Freddie Mae DUS[3] and Freddie Mac K-deals[4]. To begin, as of August 1, 2023, the Fannie Mae DUS deals account for $384.5 bn or 86% of the total FNM book of $448.1 bn, while Freddie K deals account for $317.9 bn or 83% of $384.9 bn outstanding as of June 1, 2023. Superficially similar. Below find the maturities for the two programs by year starting in June 2023 for Freddie Mac and August 2023 for Fannie Mae[5]: 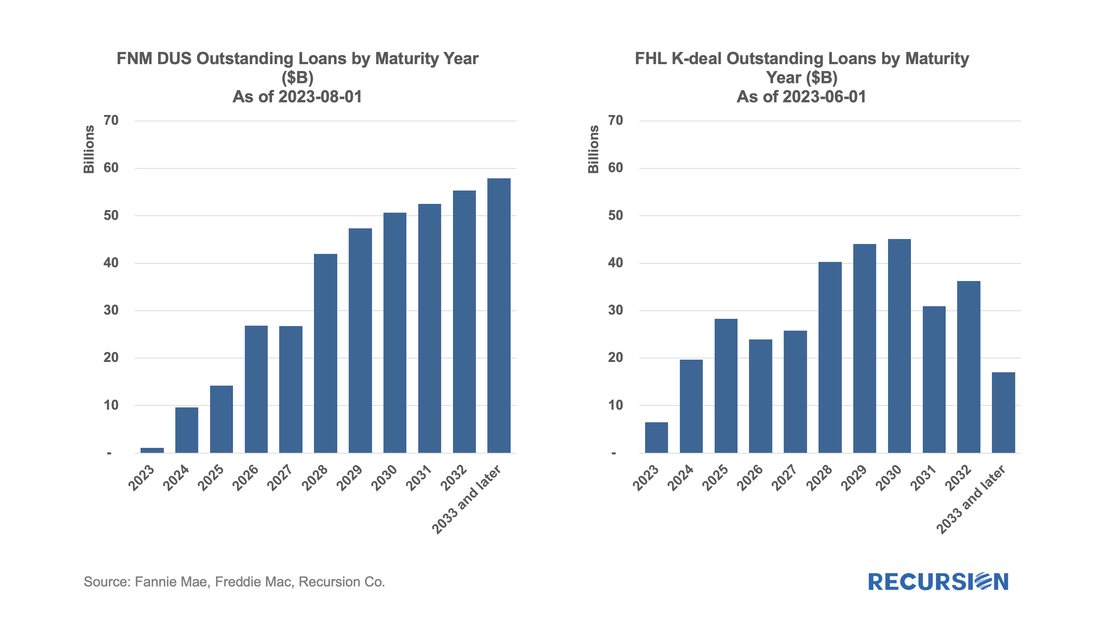 On September 15, Recursion Data was cited in a story in Commercial Mortgage Alert that pointed out that Fannie Mae “has started to restrict the interest-only payment periods on debt backing properties built before 2000.” They cite Recursion data in pointing out that Fannie Mae purchased $4.2 bn in multifamily loans in August, bringing the year-to-date total to 35.3 billion, down 20% from the same period in 2022.
Recursion is pleased to provide excellent support to all participants in this crucial segment of the commercial real estate market. In a recent post, we discussed trends in the ownership of risk in the single family residential real estate market[1]. In this note, we round the picture out with an analysis of the commercial real estate market. 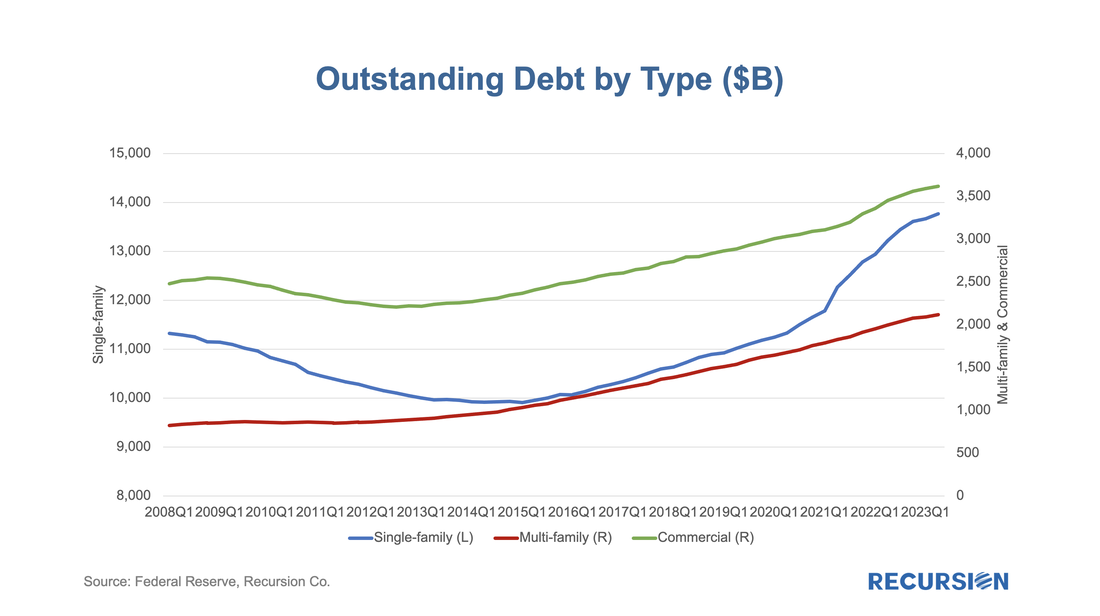 In recent posts, we discussed how some firms are implementing strategies to maintain origination volumes in Mortgage Winter. These include private securitizations and the use of buydowns. A more traditional approach would be direct market subsidies. The larger commercial banks have used various subsidy programs to assist low-income and first-time borrowers for some time, likely in compliance with their CRA obligations. More recently, some nonbanks have stepped up in this area, motivated by maintaining their volumes in a very challenging market. The ball got rolling back in April when United Wholesale Mortgage (UWM) launched its Conventional One Program, where a borrower with 50 or lower AMI who puts 1% down receives a 2% grant from the bank up to $4,000. In June, Rocket Loans instituted its One+ Program, offering a similar deal but for borrowers with AMI at 80 or lower. Not to be outdone, in July, UWB broadened its program to include borrowers at 80 AMI or less. 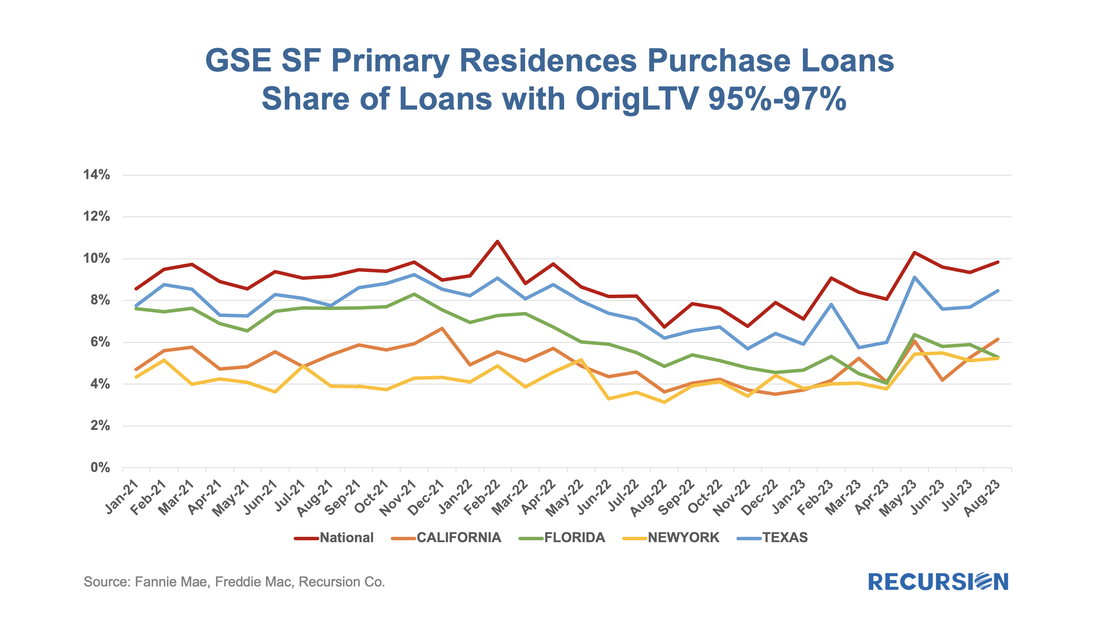 To read the full article, please send an email to inquiry@recursionco.com
We get a lot of requests at Recursion, the bulk of which never make it to these posts, but one that struck home recently was from a regulator who asked what we know about Lahaina. Given the scope of this tragedy, we thought it worth the effort to talk about what we do and don’t have. Specific to that location, the answer is relatively limited. The Agency disclosure data is provided at the state level. The population of Lahaina was 12,700 as of the 2020 Census, out of a population of the Island (County) of Maui of 164,000 and 1.4 million for the state of Hawaii overall. So, this level of detail seems unlikely to be sufficiently granular to provide a basis for analysis. However, it seems we can take a bottom-up approach that may yield something of value. This would be based on the HMDA data. HMDA data has the advantage of granularity down to the census tract level. Out of over 84,000 Census Tracts, we can identify 6 for Lahaina. We can then pull-down originations from HMDA: 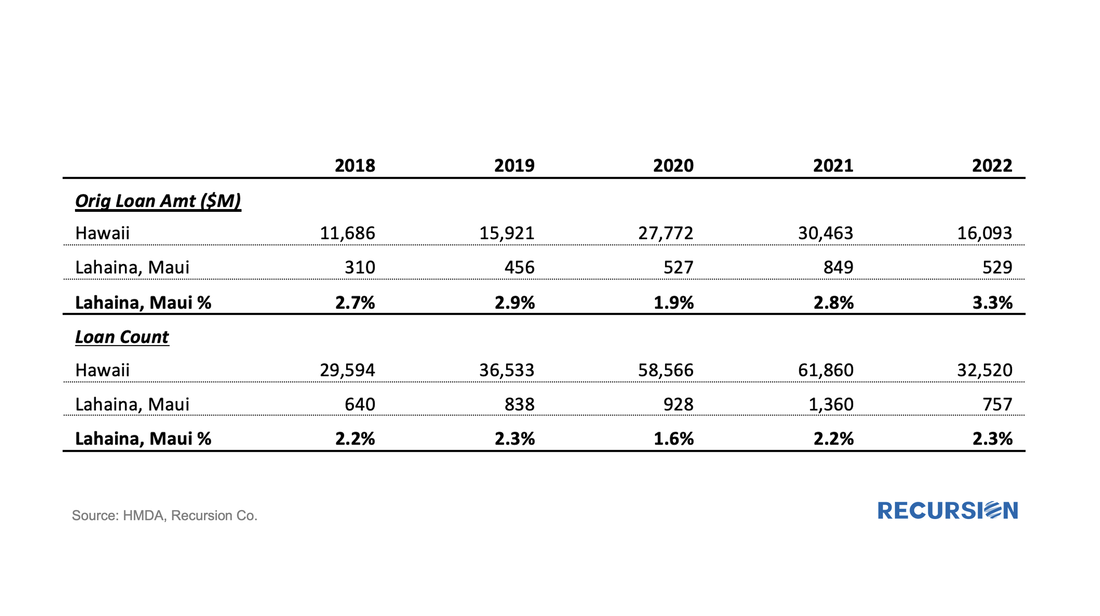 As we head into the end of summer, we note that the housing market remains locked into “Mortgage Winter”. Refinance activities are muted as mortgage rates are at a 22-year high. Even purchase mortgage applications are at the lowest level seen since 1995 as homeowners are not willing to give up their mortgages at historical low rates. It’s not hard to imagine that in such a world we will see new behaviors as mortgage lenders struggle to remain viable. PennyMac stood out as one of the more creative lenders that was able to refinance the mortgages it services, indicated by the following chart: 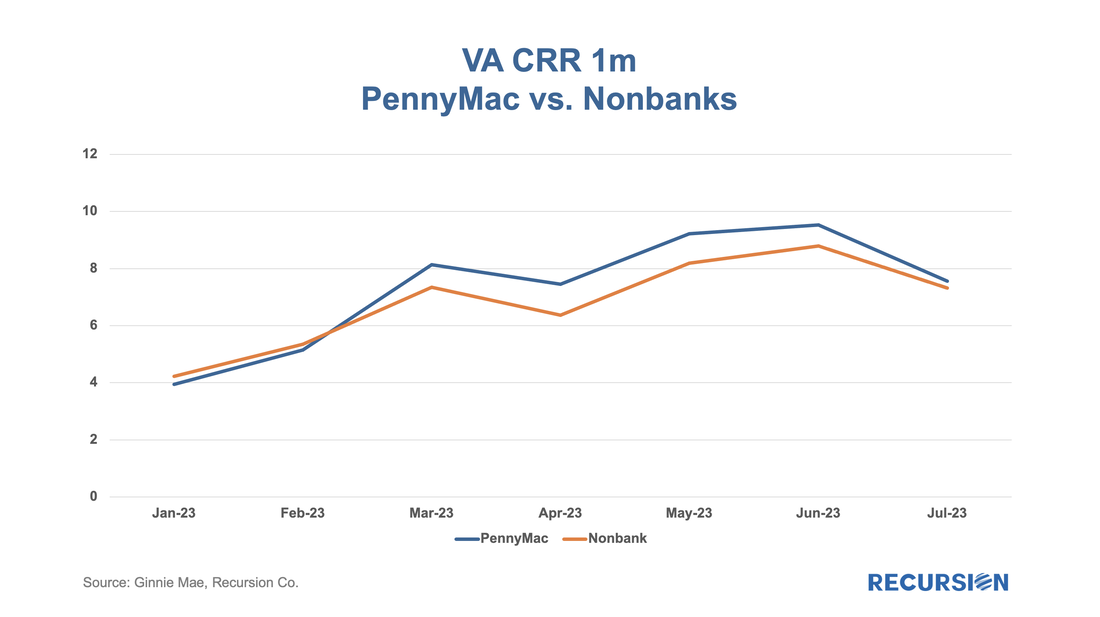 To read the full article, please send an email to inquiry@recursionco.com
|
Archives
February 2024
Tags
All
|
 RSS Feed
RECURSION |
|

Copyright © 2022 Recursion, Co. All rights reserved.