|
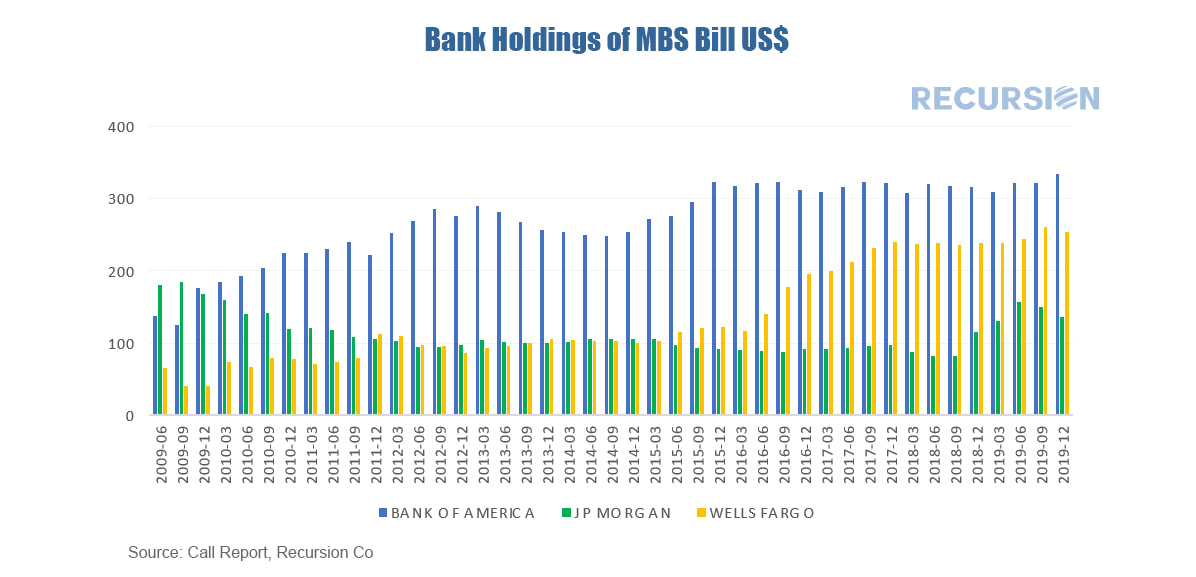
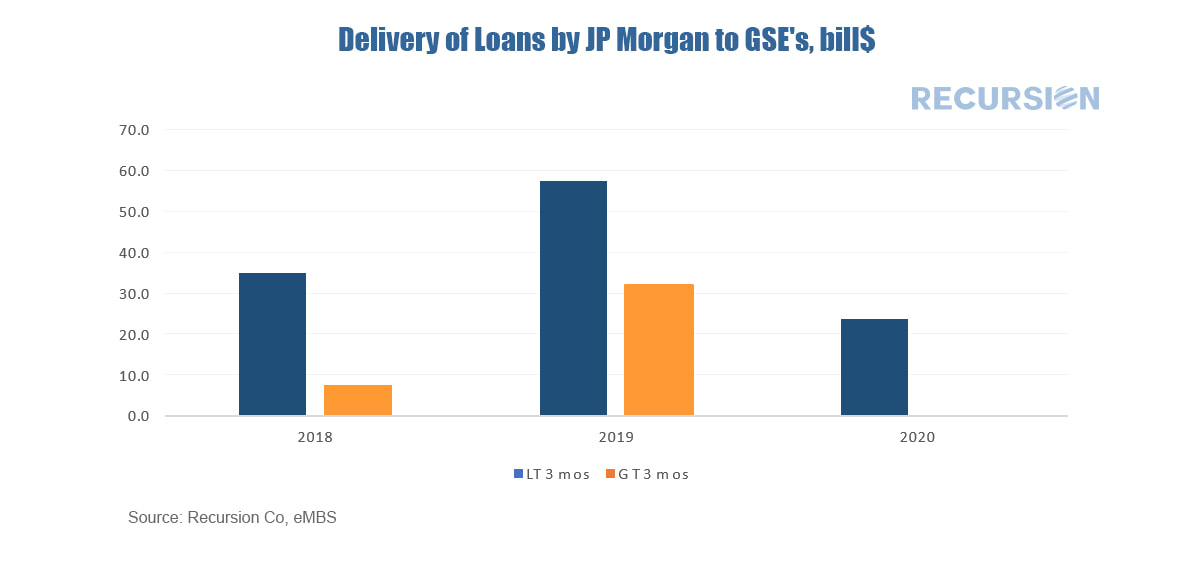
Overview With the onset of the Covid-19 crisis, the role of the banking sector has once again risen to the forefront of concern. As noted in an earlier post[1], the sharp spike in unemployment is certain to lead to a surge in delinquencies. Banks play a significant role in the mortgage pipeline as originator, servicer and investor. In our previous post, we noted that the onset of the crisis has triggered a flood of cash flowing into bank deposits as households and others shed risky assets. As such, banks have more assets to invest, including in the mortgage market[2]. Banks like mortgages as an investment, spurred by solid fundamentals related to firm labor markets and rising, but not overly stretched home prices. Banks are protected from credit and default risk by owning agency MBS instead of mortgage whole loans and enjoy favorable treatment from the capital rules set by the regulators. According to Federal Reserve data, in Q4 2019 banks held about 25% of the $9.6 trillion agency MBS market[3]. To understand the behavior of banks in this market it is important to probe its underlying structure. The Competitive Landscape of the Mortgage Market While there are thousands of mortgage lenders, the biggest banks play an important role. The shares of the top three banks – Wells Fargo, JP Morgan and Bank of America contributed 11.6% to the total of all loans originated in 2018. These top banks have an impact because they have a national scope, strong analytic capability and a broad customer base. Yet each of them has quite distinct profiles, geographic footprints, and address challenges like the rise of nonbank lending in their own unique manner. There are virtually an endless number of ways to look at this, but as an example we look at the investment behavior of the three biggest banks, Wells Fargo, JP Morgan, and Bank of America. Every quarter, Call Report data are available from regulators detailing balance sheet holdings of depository institutions. We process all this information in the Cloud and the following chart shows MBS holdings for the four institutions since 2019: There are many interesting trends here, including the significant pickup in holdings on the part of Wells Fargo, and a jump in MBS investments by JP Morgan in 2019 of about $50 billion. Industry analysts can utilize this data to provide context to their understanding of the strategies for each institution. But it turns out that there are nuances to the interpretation of this data. To show this we look at JP Morgan. Every month we calculate deliveries to the agencies by seller from loan level data. We can parse this in a number of ways but below find deliveries from JP Morgan to the two GSE’s Fannie Mae and Freddie Mac, broken down by loan age. You can see a surge in issuance in 2019, due in large part to a drop in mortgage rates that year leading to an increase in refinance activity. However, interestingly, there is also an increase in issuance for loans greater than 3 months old, which are seasoned loans held its balance sheet. So it appears that at least part of the $50 billion increase in MBS holdings was a swap from loans to securities. The exercise serves to point out the complexities in the mortgage market that are always there, which can only be enhanced by the uncertainty associated with the Covid-19 crisis. Once again, access to digital tools and big data sets are clearly essential in setting strategies in the current environment. |
Archives
July 2024
Tags
All
|
RECURSION |
|
Copyright © 2022 Recursion, Co. All rights reserved.


 RSS Feed
