|
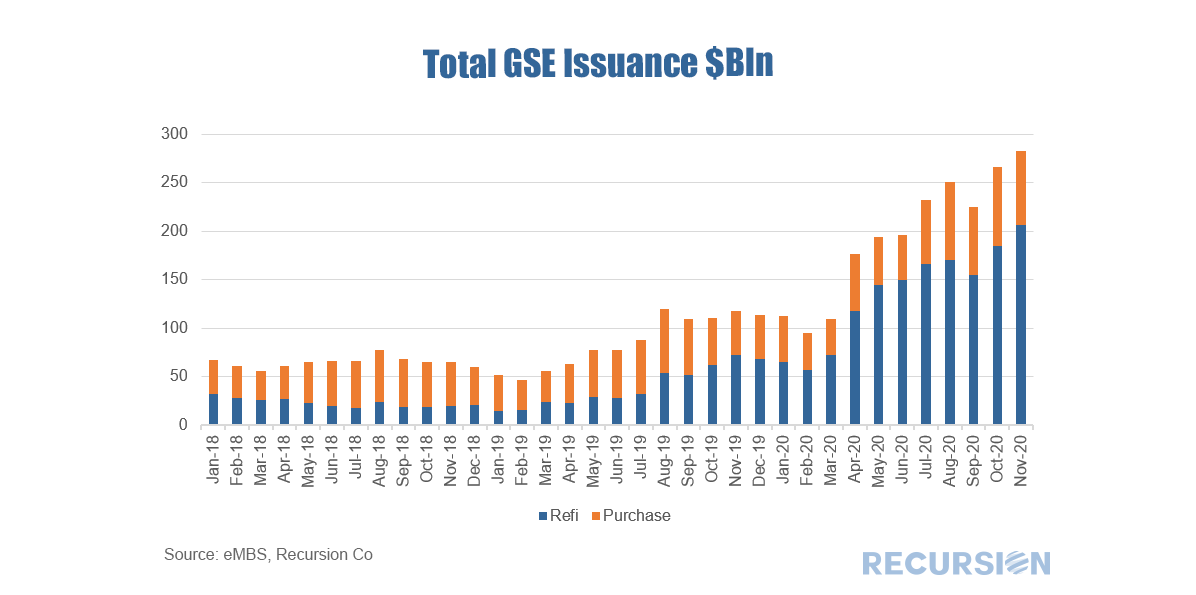
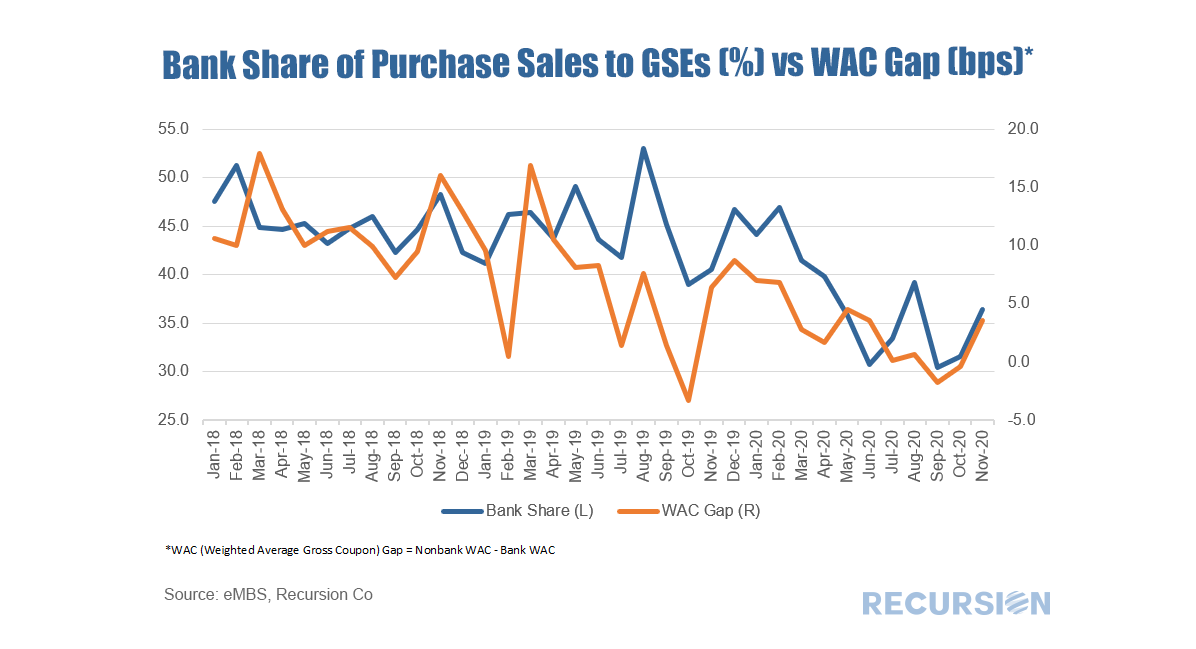
We received complete GSE data for November late last week and as always there is a lot to churn on. Another record high of issuance was achieved, although this was entirely due to a surge in refi deliveries (+$16 Bln from October) while purchase deliveries declined slightly (-$7 Bln). Lack of supply and softer seasonal demand appear to be weighing on purchase volumes. A long-term trend in these comments is the trend decline in the bank share of deliveries to the GSE’s[1]. We have commented that the Covid-19 pandemic has played to the natural technological advantage of nonbanks, while eroding the value of the bank branch networks, particularly for purchase mortgages. Interestingly, a little bit of a reverse trade can be seen the last couple of months, at least in purchase mortgages. The chart below looks at the bank share, graphed against the gap in the weighted average coupon between nonbanks and banks (“WAC Gap”). There is a distinct correlation between these two series, although considerable noise is also apparent. Many factors drive market share including underwriting characteristics and product types, but the basic relationship comes across. In November, the gap in the WAC between Nonbanks and Banks increased by almost 4 basis points from October, which was attained by a 3 bp drop in the nonbank WAC being exceeded by a 7 bp drop in that of banks. In a market measured in tens of billions, a single bp has significance. The question going forward is whether the decline in the rates of banks’ offerings is supported by efficiency enhancements or simply reflects reduced profitability. The answer to this is key in determining the question of their long-term role in this market. [1] See, for example: https://www.recursionco.com/blog/besieged-banks
|
Archives
July 2024
Tags
All
|
RECURSION |
|
Copyright © 2022 Recursion, Co. All rights reserved.


 RSS Feed
