|
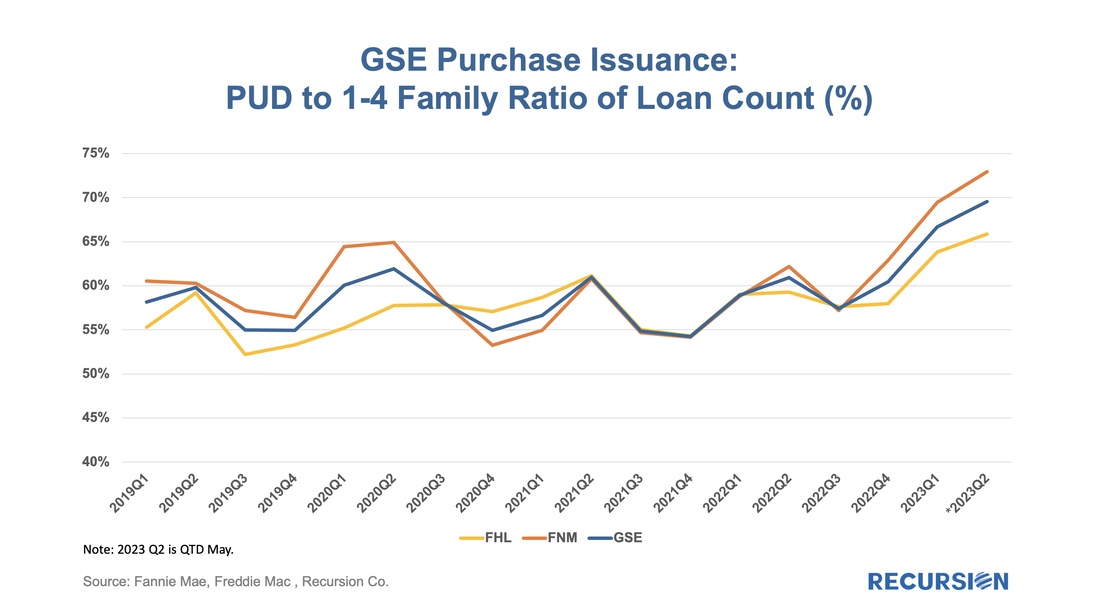
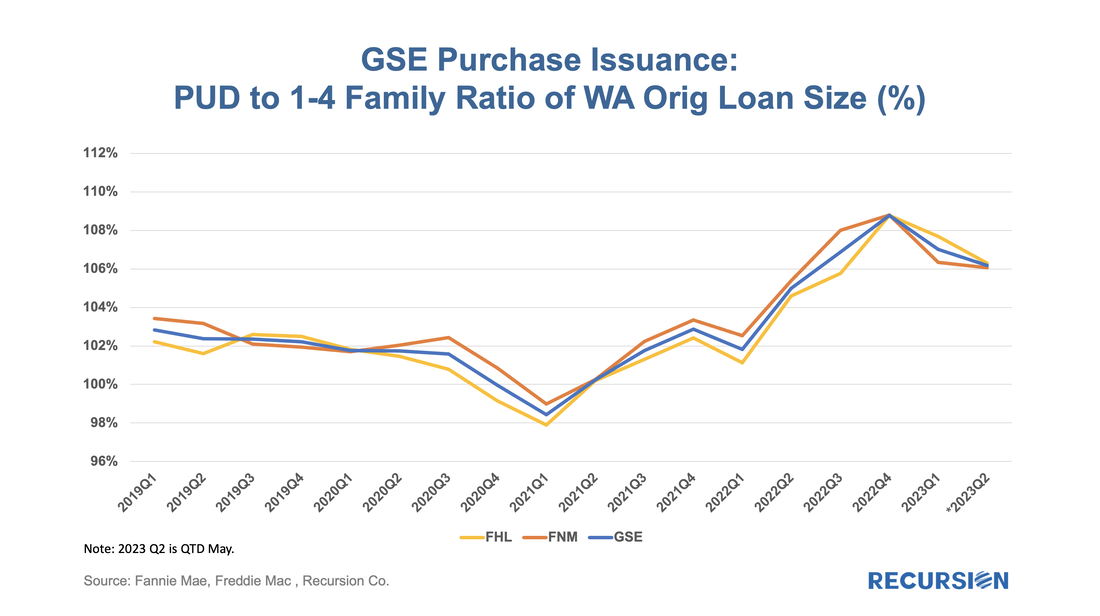
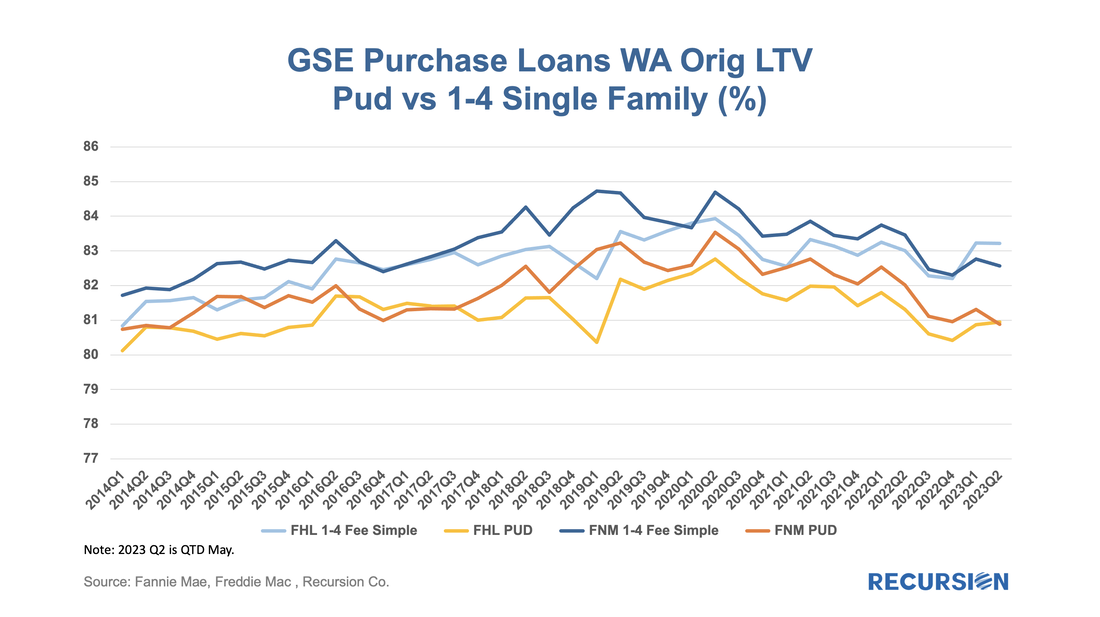
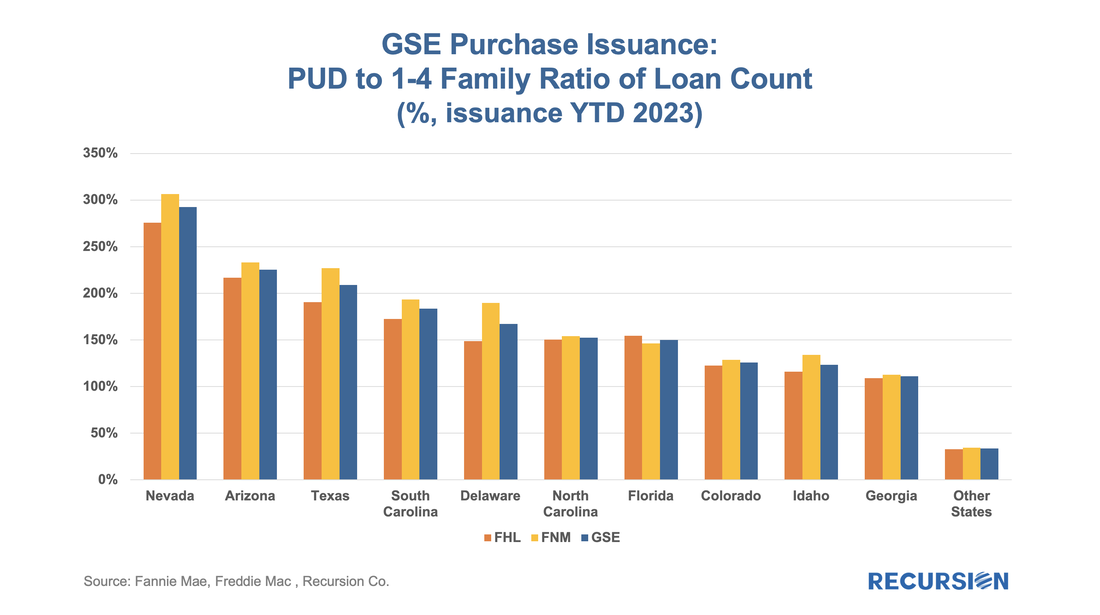
As famous investor Warren Buffett once stated, “Only when the tide goes out do you learn who has been swimming naked.” Well, it turns out that only in a declining market can you see which segments are resilient. In this case, we will look at Planned Unit Developments or PUD’s. A PUD is a planned neighborhood, generally consisting of a group of single-family homes that are bound together by a Homeowners Association (HOA). In this manner, it is like a condo, with the significant difference that the property is usually a stand-alone structure that the buyer owns along with the lot on which it is located. Details about eligibility can be found in Fannie Mae’s selling guide[1]. Below finds the ratio of purchase mortgage deliveries from PUDs to those of 1-4 unit conventional loans: As interest rates have risen, all single-family mortgage segments have been hard hit, but the PUDs have proved somewhat more resilient. Compared to their recent peaks in Q42020, 1-4 family and PUD deliveries in Q12023[2] have fallen by 63% and 55%, respectively. While the difference is moderate, it is persistent as the quarterly decline in 1-4 family home deliveries has been bigger than that for PUDs in 5 out of the 10 quarters covered during this period. The question arises about what might be behind this recent trend. One possible explanation is that loan sizes might be different. On a broad scale, PUD loan sizes were very close to those for 1-4 family properties before the pandemic but then rose in relative terms for two years before easing up moderately this year. There are many possible factors behind this pattern, but one that stands out is the difference between the average LTV of 1-4 family loans and PUD loans delivered to the GSEs: There has been a clear requirement for PUD borrowers to place a larger down payment on their properties in the last couple of years relative to 1-4 family homes. This may have to do with HOA dues, but in any case, the lower LTVs smooth the underwriting process. That takes us back to the original question about the rising PUD trend relative to 1–4-unit mortgages. Besides price another possible factor driving this trend is geography: The ten states with the highest PUD to 1-4 family home ratio are responsible for 63% of all PUD purchase deliveries this year and only 26% of all 1-4 unit deliveries. A common theme across these states is an abundance of land available for new developments along with supportive zoning regulations. One final observation is that this analysis provides an interesting perspective on our “mortgage winter” narrative whereby higher rates tend to suppress supply and demand for housing. If PUDs have a higher share of new construction vs repeat sales than 1-4 family units (as we suspect), then they should be more resilient to the higher rates as new buyers do not experience the “lock-in” impact to the same degree. The impact is unsurprisingly modest, but a good basis for which market participants can identify market opportunities across geographies. [1]https://selling-guide.fanniemae.com/Selling-Guide/Origination-thru-Closing/Subpart-B4-Underwriting-Property/Chapter-B4-2-Project-Standards/Section-B4-2-3-PUD-and-Co-op-Eligibility-Requirements/1032993721/B4-2-3-01-Eligibility-Requirements-for-Units-in-PUD-Projects-03-03-2021.htm
[2] Q2 2023 contains just two months’ worth of data. |
Archives
July 2024
Tags
All
|
RECURSION |
|
Copyright © 2022 Recursion, Co. All rights reserved.


 RSS Feed
