|
As we have noted many times, one of the best features of loan-level analysis is the ability to segment the mortgage market into components that allow for a deepening of understanding of the behavior of the various market players. In this note we look at two groups: borrowers who get an appraisal and those who are eligible to get one but do not. In previous posts we pointed out that analysis of the performance characteristics of mortgages with and without appraisal waivers cannot be accomplished by looking at loans with waives vs those without as many loans without waives are ineligible to obtain them. A robust analysis can only be conducted by looking at loans with waivers against loans that are qualified to get one. The qualification characteristics can be complex, but the main factor is LTV, which differs by loan purpose.[1] The question that naturally arises is why do some eligible borrowers not obtain a waiver when doing so would save money on the transaction? To address this issue, we look at the distribution of loan sizes for purchase loans with waivers vs those without them that are eligible. Here is the pattern of loans delivered to the GSEs YTD October 2021 by Agency: 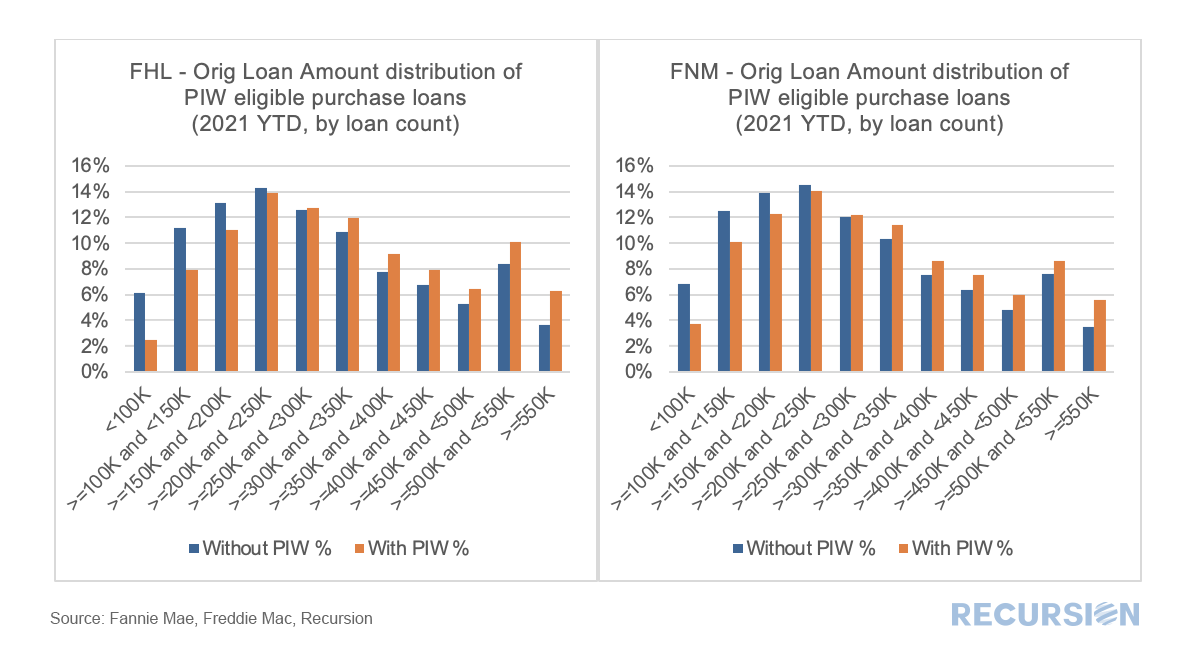 In a recent post[1] we looked at the evolution of the FHA purchase mortgage market share broken down between areas with a high percentage of Low-Moderate Income (LMI) households and those without. While the overall FHA share has generally declined since the onset of the pandemic, its share has held up in areas with a preponderance of LMI households. There are many factors behind these trends, but a natural consideration is underwriting standards. To examine this factor, we use the Recursion Matched Dataset[2], where we create a large sample of loans with characteristics from both HMDA and the Agency disclosure data. A very high share of mortgages can be matched using our proprietary algorithm over the years 2018-2020. The coverage ratio from the Matched Dataset is provided in a previous post[3]. We proceed by looking at three major underwriting characteristics for LMI and non-LMI areas for FHA and the GSE’s: Credit Score (CS), Loan-to-Value (LTV) and Debt-to-Income (DTI), Most interesting is Credit Scores: 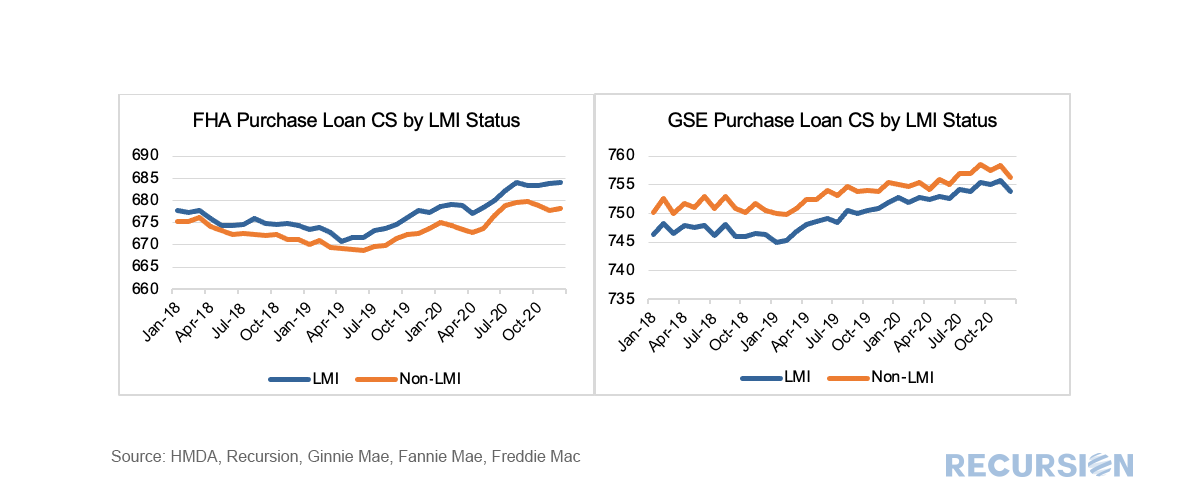 The new FHFA Acting Director Sandra Thompson has lost no time in implementing new policies designed to support homeownership with the aim of creating greater wealth equality. This is the basis of the New Housing Policy we described in a recent post[1]. At first, this involved extending foreclosure moratoriums for distressed families until the end of the year[2]. Then recently, the GSE regulator announced a change in its modification policy to broaden the eligibility for rate mods to any qualifying household that were previously only available to those with a mortgage greater than or equal to 80% of the current home valuation (Current LTV>=80)[3]. This program is designed to allow as many credit-worthy borrowers to stay in their homes as possible. The LTV limit is significant because the surge in house prices we have witnessed over the past year has meant that a relatively small share of loans should have Current LTVs greater than or equal to 80. Our loan-level data set allows us to examine this question by looking at over 25 million GSE loans. Below finds a snapshot of the total combined June books of the GSEs broken down in this manner: 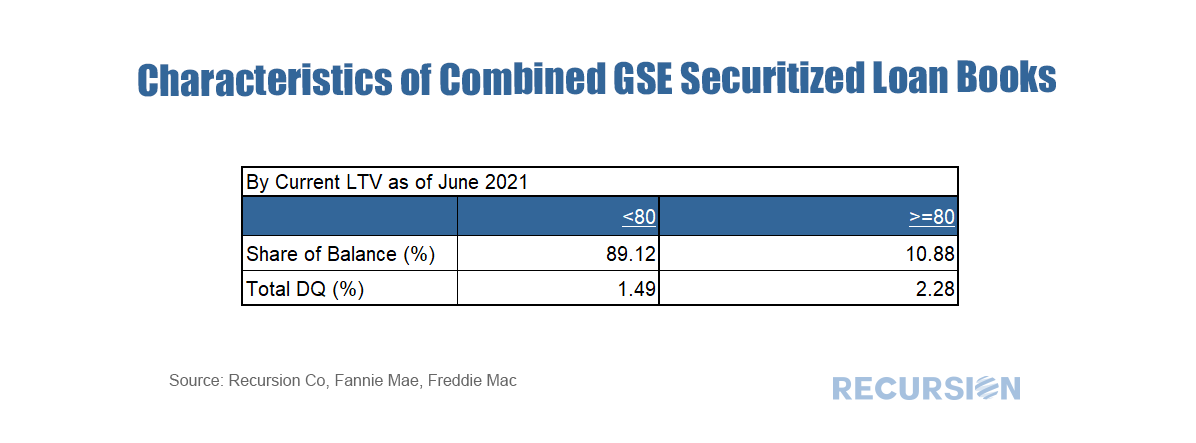 We received the first loan-level performance data for the GSE’s a few months ago, so it’s about time to see what tentative observations can be drawn from this new data set. As a popular theme for this blog is the bank/nonbank share this seems a good place to start. In general, we have noticed that nonbank DQ’s tend to be higher than those for banks, and that this distinction is correlated with the relatively more generous credit terms available in the nonbank sector. Below find a table that demonstrates this for 2018 and 2019 vintage mortgages: 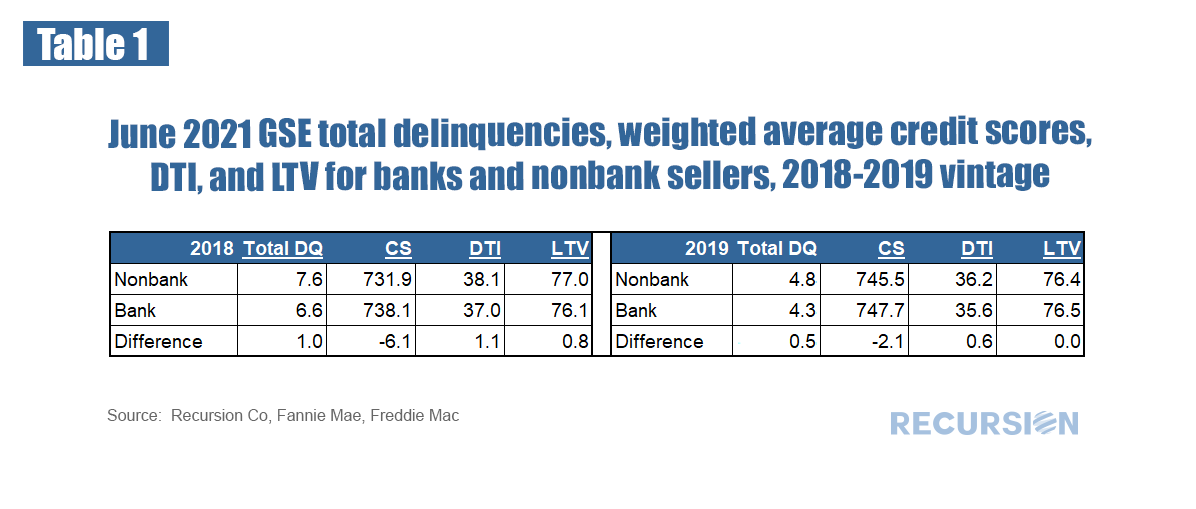 This can be summarized: 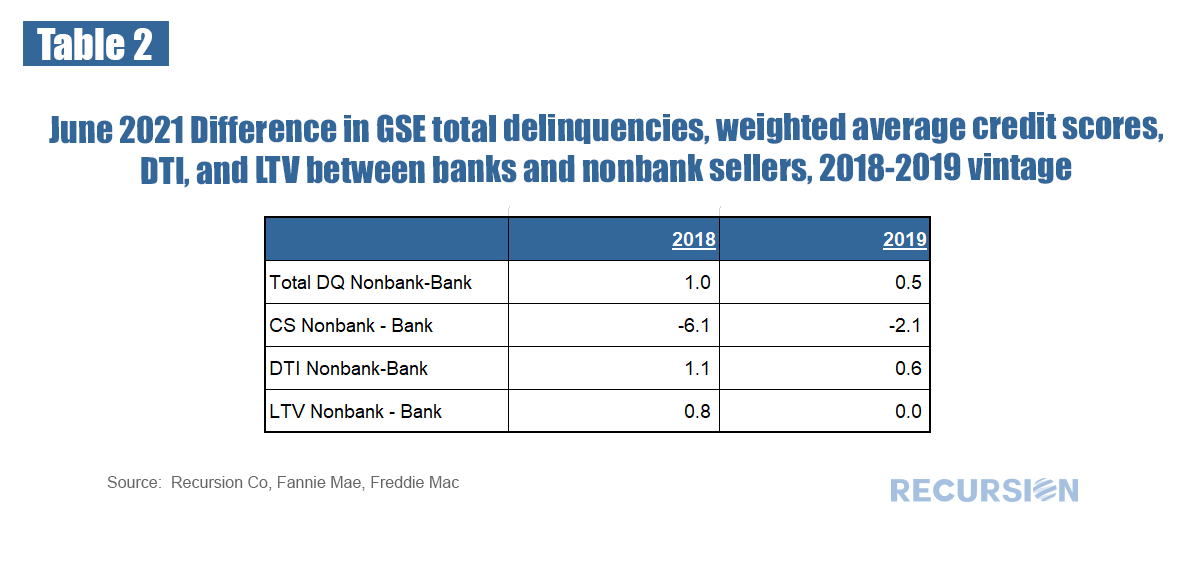 In a recent post we discussed trends in the conforming purchase market by occupancy type[1]. In this note we look at performance metrics. To begin, we look at prepayment speeds. It’s important to note that certain fees (which Fannie Mae calls LLPA’s[2] and Freddie Mac calls Credit Fees[3]) vary by occupancy type, particularly for those with high LTV’s. 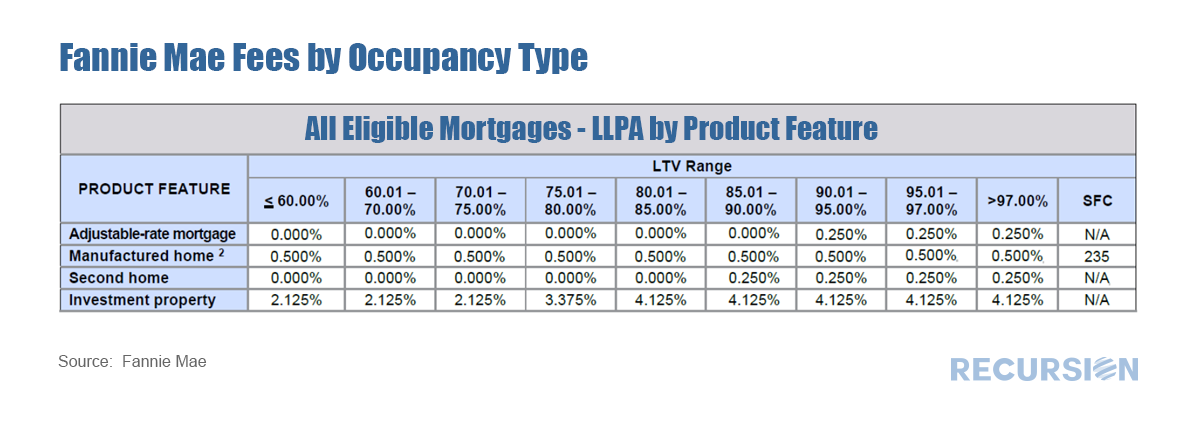 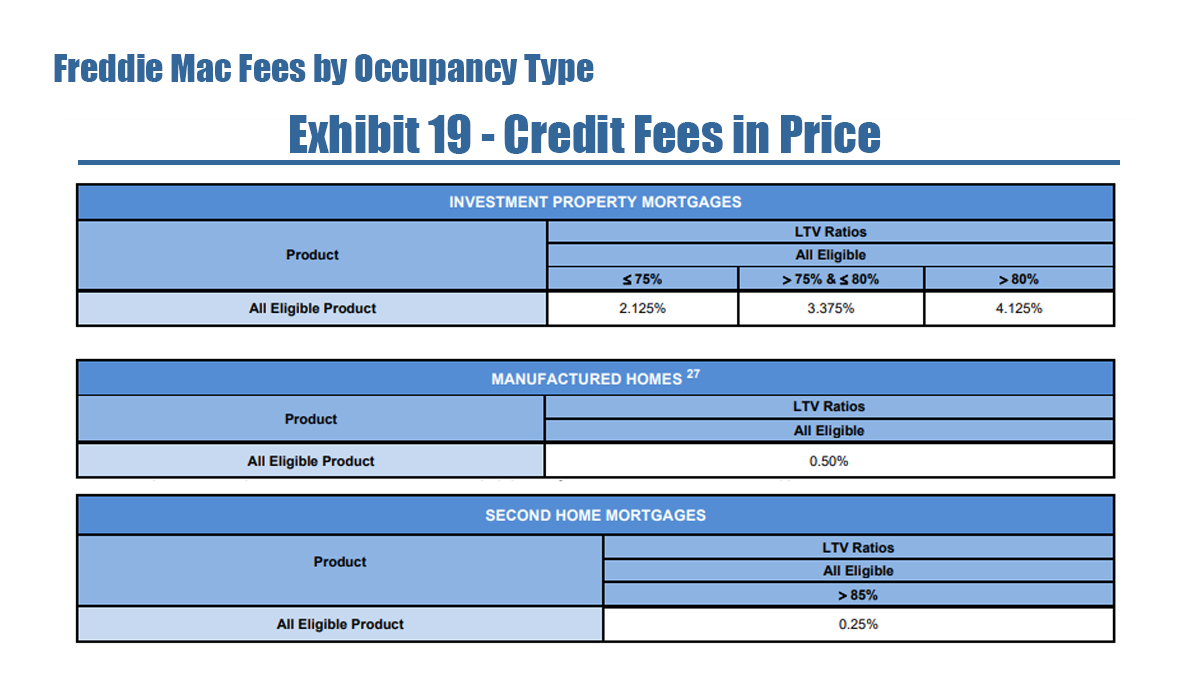  While market commentary is focused on developments such as inflation and house price increases, the key housing policy issues in the post-Covid world are financial inclusion and climate change. Our agency loan-level data provide us with many insights into market trends, but these do not contain demographic or geological details that are necessary to perform in-depth analysis in these areas. On the topic of financial inclusion, the key supplemental data set is the Home Mortgage Disclosure Act (HMDA) dataset, an annual disclosure made by lenders in support of fair lending. HMDA data contains relevant data points such as income, gender, and race. Any assessment of fair lending practices requires an analysis of how these factors influence the availability of credit. To accomplish this, Recursion has applied a proprietary matching algorithm to create a robust dataset consisting of loans with both underwriting and demographic characteristics. Over the period 2008 – 2020 the data set consists of about 20 million loans. Below finds a chart of average credit scores by race (as measured by race of the first borrower) over the 2008 – 2020 period from this matched data set: 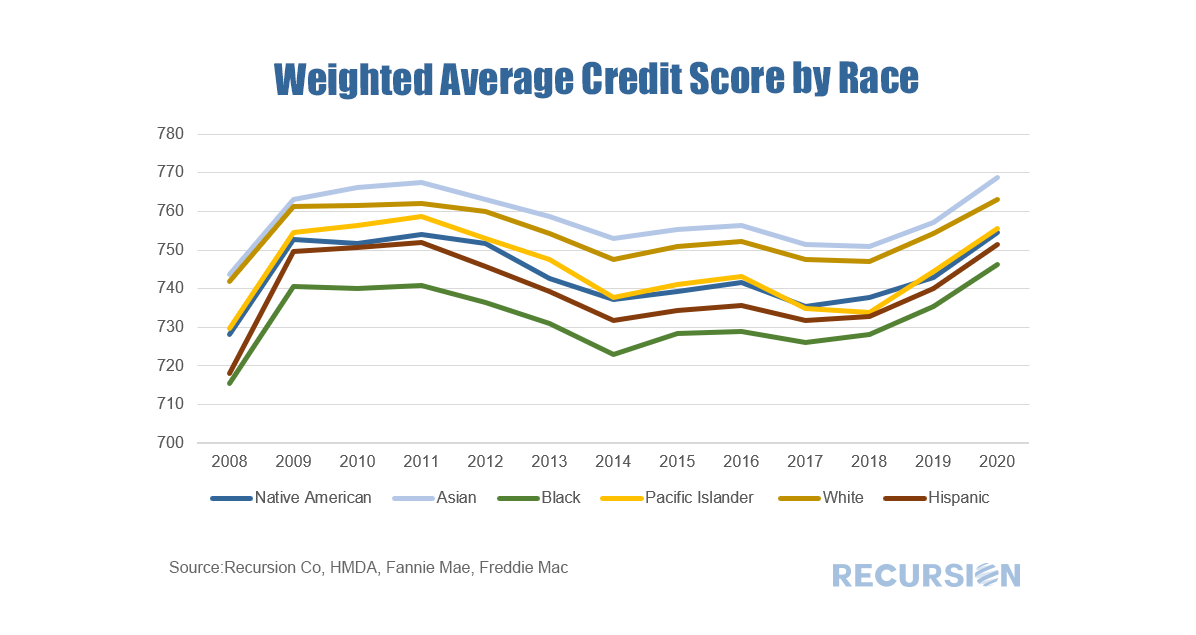 The increase in the number of cashout refis has led to some concerns about the implications for the quality of household balance sheets, similar to what occurred in the run-up to the Global Financial Crisis[1]. At that time, many homeowners were tempted to use their houses as a “piggy bank” as the national savings rate hit all-time lows. In the runup to the Global Financial Crisis, the national savings rate hit a sixty-year low of 2.2% while over the 2016-2019 period the rate averaged a much healthier 7.6%[2]. It is useful to scale the magnitude of assets being cashed out and Freddie Mac releases a very useful file documenting this quarterly for their book of business back to 1994[3]. In the fourth quarter of 2020, the amount cashed out reached $48.4 billion, about 58% of the $84.0 billion peak attained in the second quarter of 2006. As a share of household net worth, the most recent data point is 3.7%, well below the peak of 12.7% reached in Q2 2006. 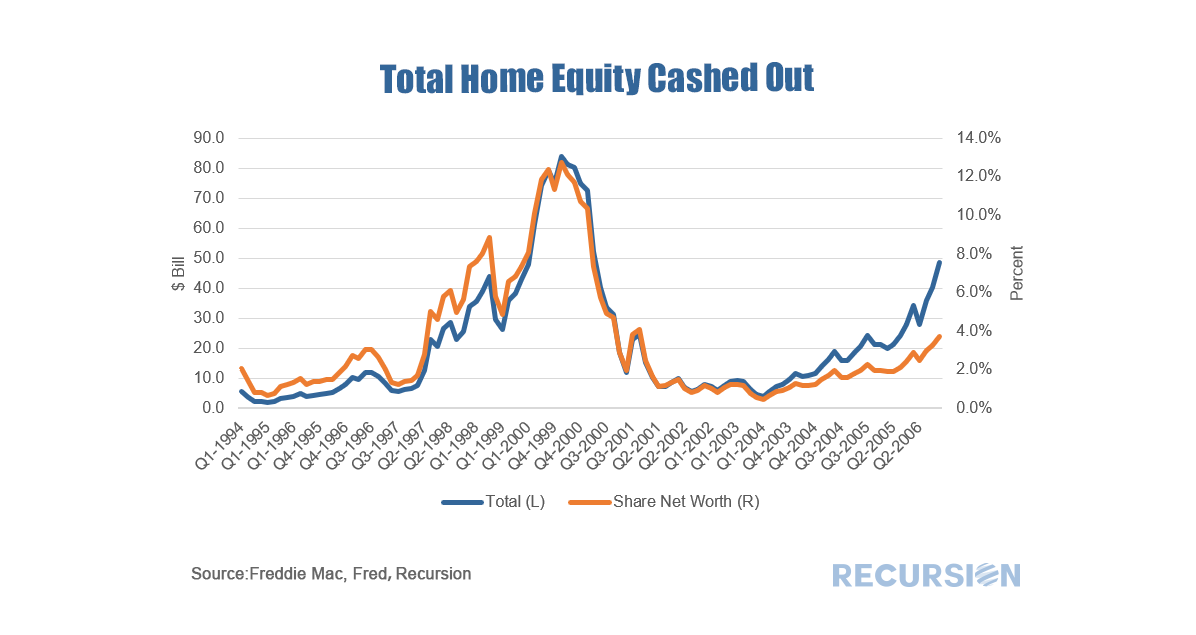 It’s useful along these lines to ask about the credit profile of cashouts compared to other refinancings. Freddie Mac didn’t report cashout refi separately until 2008 Q3, but the following useful picture can be obtained. 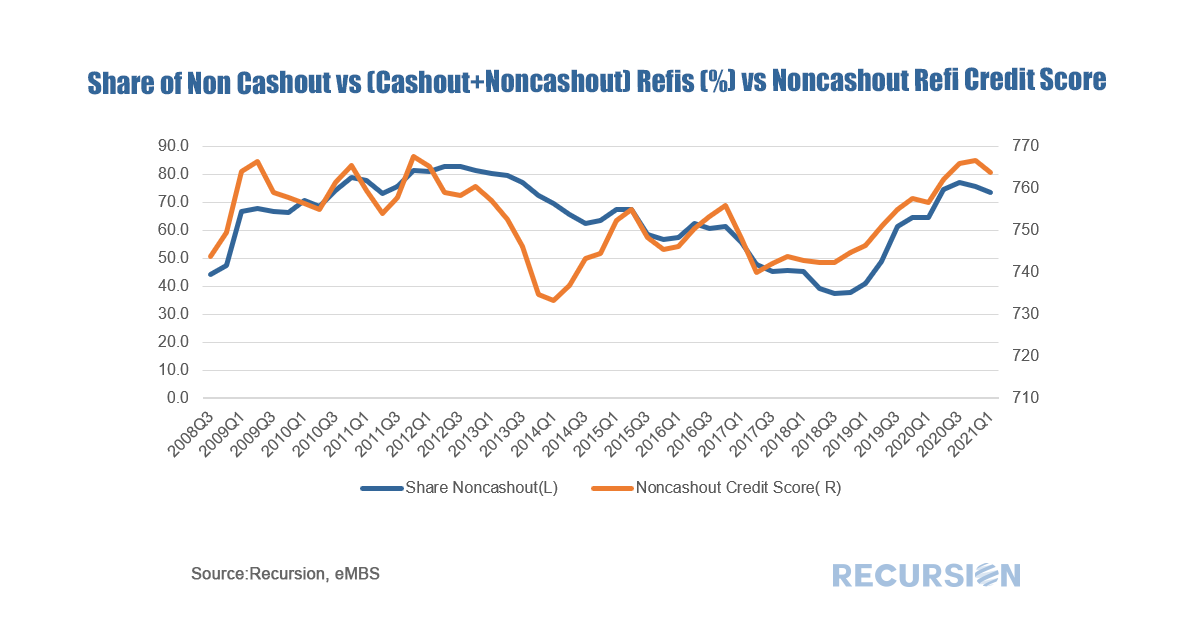 In general, lenders tend to “lean against the wind” by loosening credit conditions when demand for credit declines, and vice versa. Interestingly, it appears that the share of noncashout loans follows a pattern in which the share rises when credit in general is tightened. At the present time, the average FICO score in March for noncashouts was a tight 764, vs 753 for cashouts. It is difficult to pin the rise in equity cashouts in the current cycle to loosening credit conditions. Of course, the proof is in performance, and now that we have loan-level DQs for the GSE’s beginning last month, we can look at this broken down by loan purpose for the Freddie Mac book: 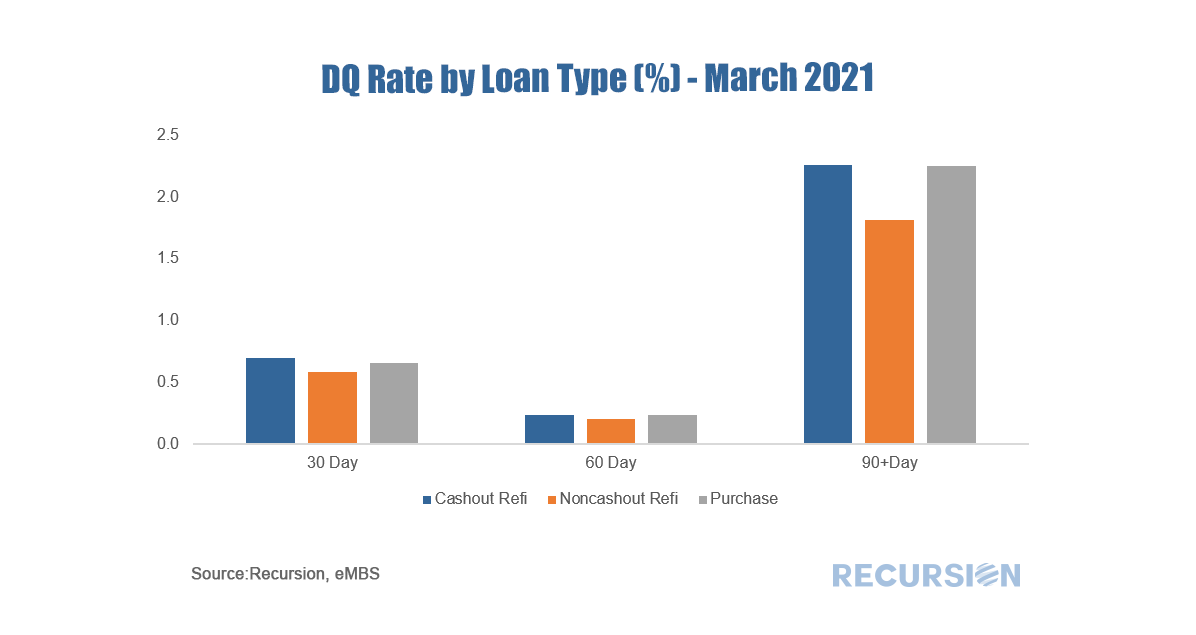 The performance of cashouts is mildly worse than that for noncashouts, but more in line with purchase mortgages. These statistics will bear watching in future months, particularly as forbearance programs begin to expire towards the end of the year. In a recent post, we discussed the relative performance of loans with property inspection waivers vs those with traditional appraisals that qualified for a waiver[1]. We commented that the observed out-performance of loans with waivers as measured by lower total delinquency rates (DQs) was likely influenced by relatively tighter lending standards (eg higher credit scores, lower DTI) for these loans compared to eligible loans that received a traditional waiver. A fully rigorous examination of this issue would be an extensive undertaking outside the scope of these brief posts. But let’s do a quick example as a demonstration of what our tools can produce along these lines. To make for an apple-to-apple comparison, below find two grids containing the difference between the total delinquency rates for purchase loans with PIWs compared to those that are eligible but obtain a traditional appraisal. The first is for loans originated in 2019 and the second is for those originated in 2020:  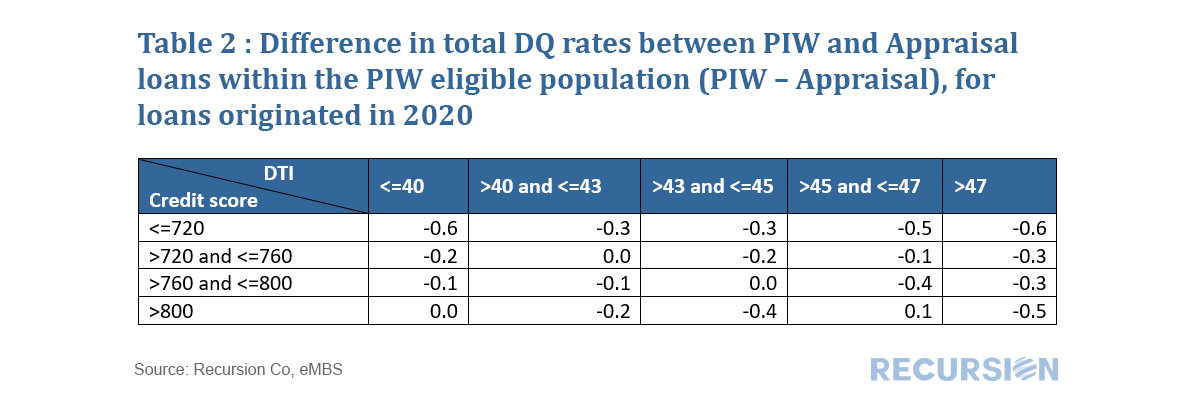 We find that PIW’s are more extensively used in 2020 than in 2019. In addition, in 2019 the range of PIW takeup across cells was 8%-13%, while for 2020 it was 14%-28%. In both cases, takeup tends to rise with credit score. Lenders appear to be more willing to allow a waiver for borrowers with better credit. 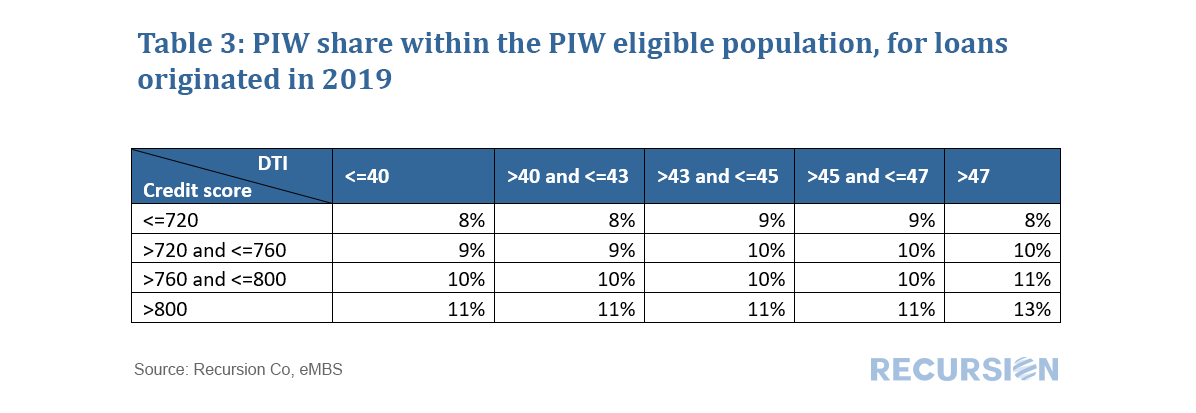 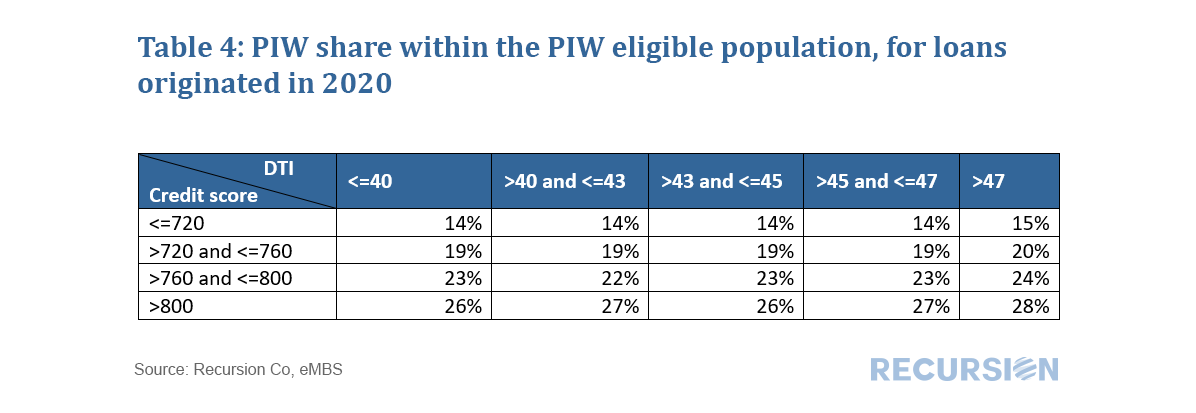 For 2019, there are a number of outliers, but there is no clear pattern across the grid. Many lenders were just beginning to implement their waiver programs that year. By 2020, PIWs became a standard part of the toolkit. For most of the center of the grid, loans with waivers very slightly outperform those eligible loans using appraisals. Bigger outperformance can be seen, however, along the edges, i.e. loans with credit scores less than 720, and DTIs greater than 47. It appears it is not the waiver itself that leads to outperformance, but likely that underwriters are more careful and pay more attention in general to these riskier classes of loans. Further work would look at performance across the largest servicers, and by state. |
Archives
February 2024
Tags
All
|
 RSS Feed
RECURSION |
|

Copyright © 2022 Recursion, Co. All rights reserved.