|
The preliminary HMDA data came out last week, and we have it fully processed and available on our Recursion HMDA Analyzer. While always notable, this release has been particularly eagerly awaited as it represents the first complete view of market conditions in “Mortgage Winter”, the extraordinary period of sustained high house prices and mortgage rates. Not surprisingly, volumes are down compared to 2022, more so for balances than loan counts: 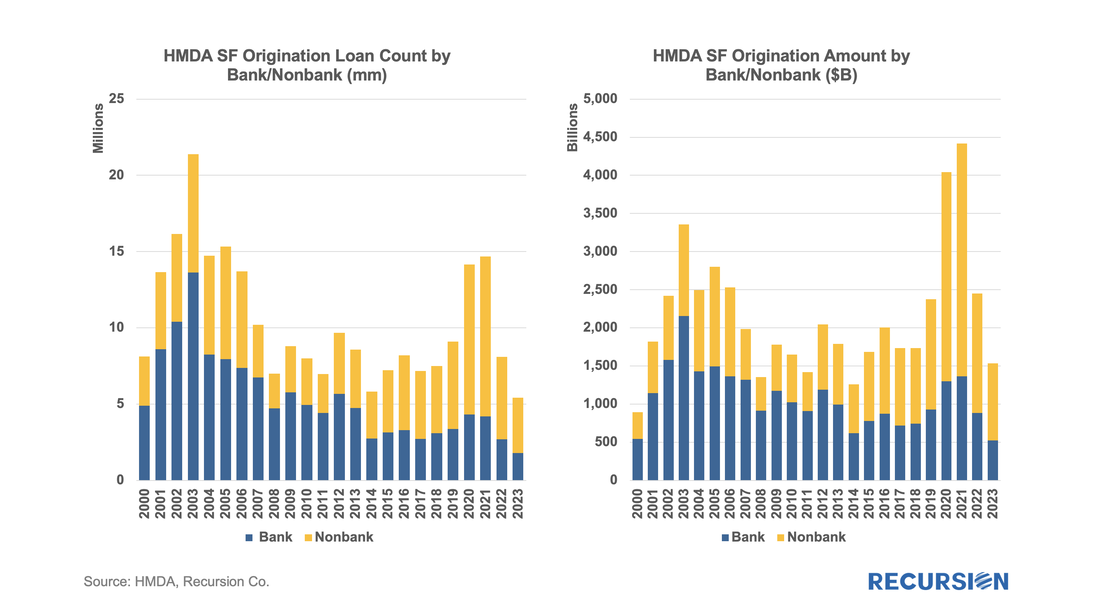 In a recent post, we discussed the impact of the COVID-19 pandemic on the mortgage market[1]. We noted that there has been a trend toward higher median credit scores in Agency mortgage deliveries since 2020 due to policy stimulus and asset price appreciation. In addition, there was a jump in median bank credit scores in early 2022, accompanied by a drop in the bank share relative to nonbanks of about 5%. This is not negligible, and the share decline has persisted over the past year. We attribute this to the shock of the collapse of four banks, notably Silicon Valley Bank (SVB), during this time. A more thorough assessment of the impact the bank shock had on the mortgage market requires access to the financial statements of a range of banks. This data is available via the Bank Call Reports. Data are released quarterly by the FDIC and made available through the FFIEC[2] with trends discussed in the FDIC Quarterly[3]. This note is meant to be a technical description of the data infrastructure we have built to support this sort of analysis by tying together mortgage production data with bank financial information from the Call Reports. The Recursion Call Report Analyzer The Call Report data is readily accessible, and we like many others have for some time pulled data down for individual institutions for use in various studies. If you want to look at the whole system, however, we are looking at well over 3,800 datapoints covering some 4,600 institutions. This is not big data like the Agency loan level disclosures or HMDA data, however, normalization of the dataset takes considerable subject expertise, as banks report different forms with different datapoints. Since we are interested in applications to the mortgage market, we start by linking institution names to the consistent naming database we have built in the Agency mortgage space. That allows us to make quick inferences into the mortgage world from bank shocks. In next step, we designed a front-end system (the Analyzer) that allows users to pull down data for designated characteristics for subsets of banks using a graphic interface without programming. To demonstrate the application of this tool, we look at some aggregate figures with a breakdown for the Big 4 Banks: JP Morgan, Wells Fargo, Citi and Bank of America. These banks were not the source of the turmoil last Spring but are of general interest. The Overall Bank Picture First, we break down the banks into three buckets: large (assets over $1 trillion), medium ($100 billion to $1 trillion), and small (under $100 billion) using the total assets of them obtained from Bank Call Reports. Then we analyze them through the origination data from two traditional Recursion tools, HMDA Analyzer and Cohort Analyzer (for agency loan level disclosure). Below find charts of the distributions from each source for conforming mortgages by loan count back to 2019: 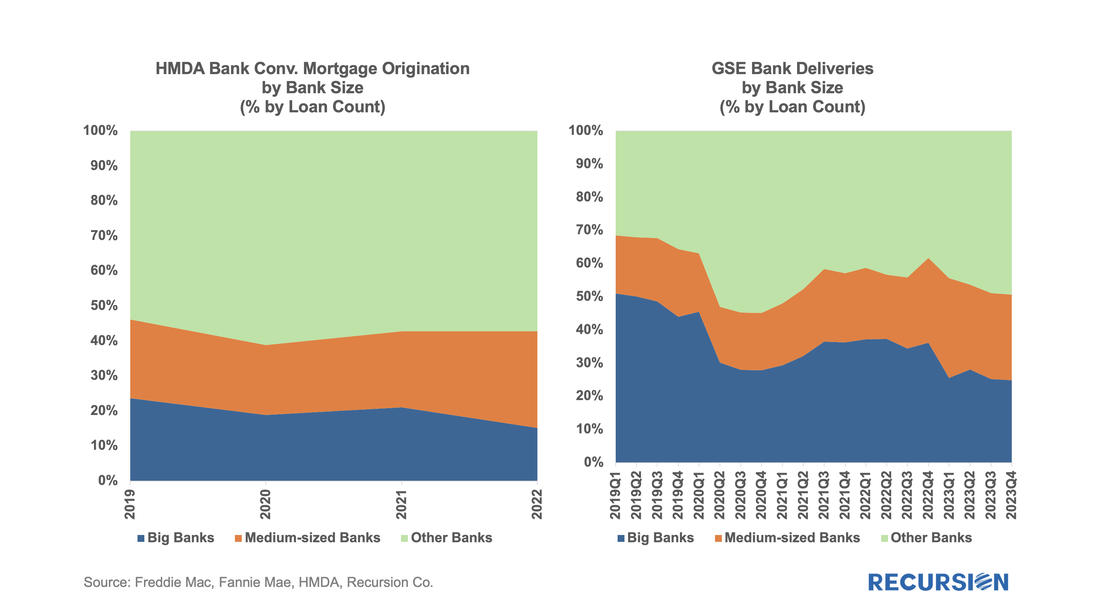 Note that the HMDA data ends in 2022 as 2023 HMDA has not been released yet. In both cases, we see a trend decline in the share of the Big 4 banks. There are a couple of observations that are notable here. First, the share of mortgage activity of the Big 4 institutions with regard to mortgage activity is in decline. (Originations by 9% from 2019 to 2022, deliveries by 22% from 2019 to 2023). It seems that the bulk of declines in the bank share of deliveries in 2023, cited in the earlier note, was concentrated in bigger banks. Below find a table of the share of deliveries of the Big 4 Banks along with the median credit score quarterly since 2021: 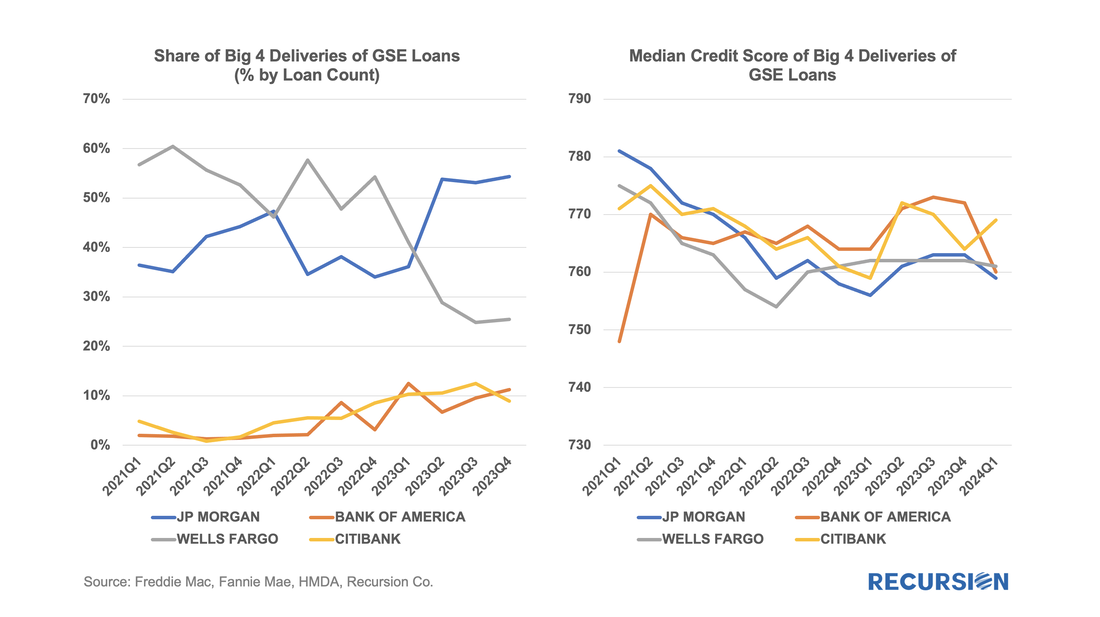 We get a lot of requests at Recursion, the bulk of which never make it to these posts, but one that struck home recently was from a regulator who asked what we know about Lahaina. Given the scope of this tragedy, we thought it worth the effort to talk about what we do and don’t have. Specific to that location, the answer is relatively limited. The Agency disclosure data is provided at the state level. The population of Lahaina was 12,700 as of the 2020 Census, out of a population of the Island (County) of Maui of 164,000 and 1.4 million for the state of Hawaii overall. So, this level of detail seems unlikely to be sufficiently granular to provide a basis for analysis. However, it seems we can take a bottom-up approach that may yield something of value. This would be based on the HMDA data. HMDA data has the advantage of granularity down to the census tract level. Out of over 84,000 Census Tracts, we can identify 6 for Lahaina. We can then pull-down originations from HMDA: 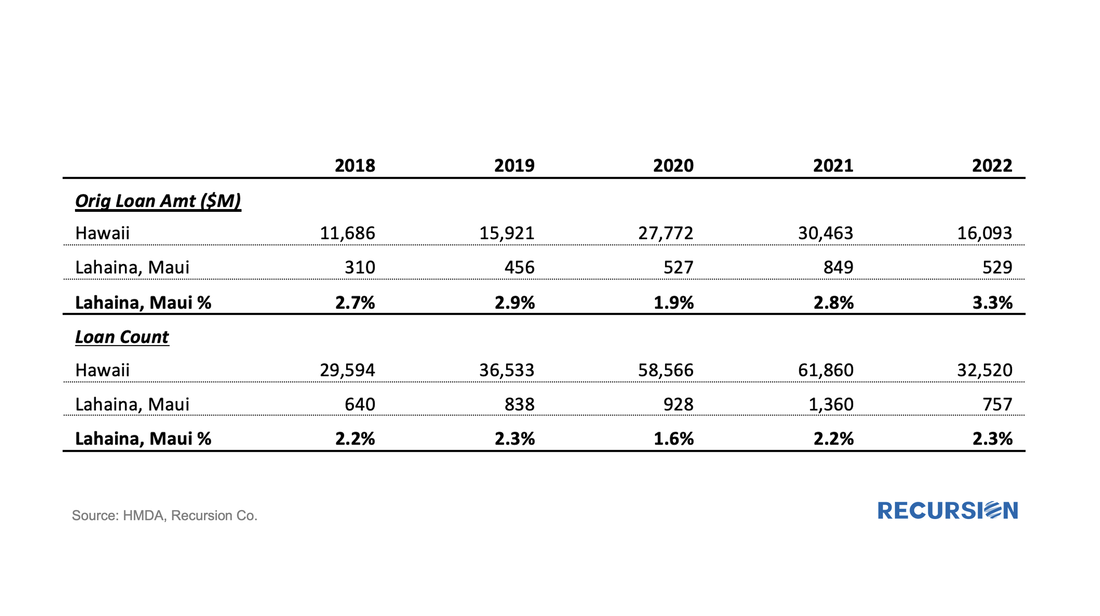 The release of the Agency performance data in early May provided confirmation that the dip in Early Payment Defaults[1] we have witnessed over the last three months ended a 16-month long uptrend in this statistic for FHA loans. A similar but far more muted pattern can be seen for VA and conventional mortgages. In a previous post, we speculated that the uptrend was correlated with the higher inflationary trend observed since early 2021[2]. Below please find an update of the chart: 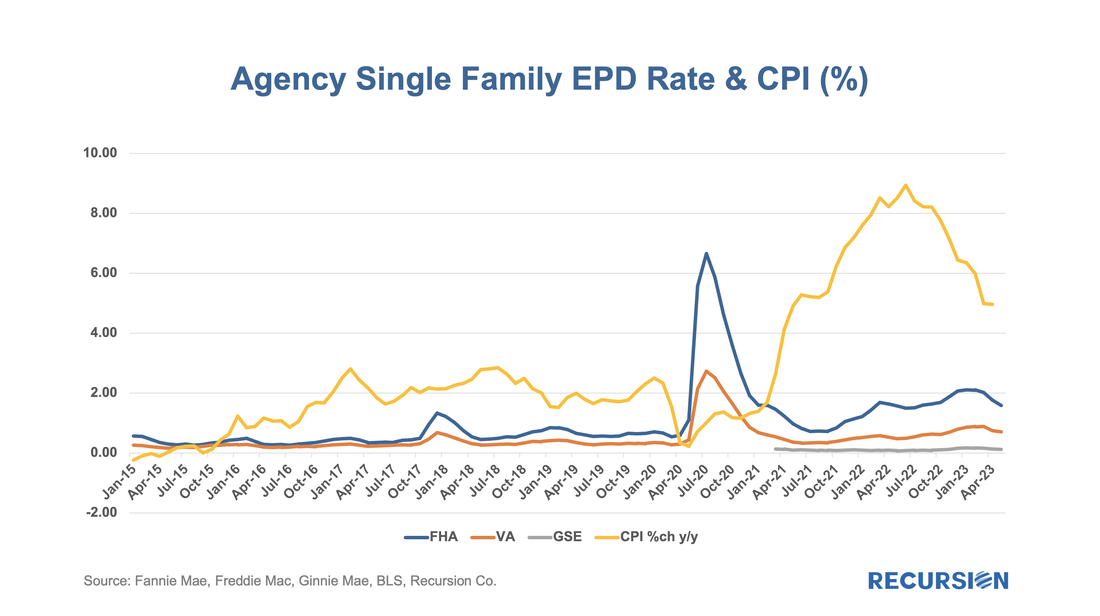 In a previous note, we looked at mortgage trends derived from the recent release of 2022 HMDA data[1]. Of course, HMDA is a prime data source for analysts and policymakers who seek to understand how social and economic trends interact. The most discussed issue is the distribution of originations by race. Below find a bar chart for the share of originations by race annually from 2004-2022 by loan count:
The cherry blossoms are blooming, which means it’s time for the HMDA preliminary data set to be released. The dataset provides a social underpinning to the nation’s mortgage market and enhances our understanding of the behavior of borrowers and lenders. The 2022 dataset has been particularly eagerly awaited, as we get our view on the new world of high inflation and mortgage rates for the first time in decades. We start with origination volumes and get not just confirmation of the onset of mortgage winter, but some breakdown of its characteristics.
In a recent post, we discussed the attributes of manufactured housing data that came with the final 2021 HMDA release in July[1], which were not available in the preliminary release. Another important data point from this final release is the conforming flag, identifying which loans satisfy the requirements for delivery to Fannie Mae and Freddie Mac. Obviously, any loan sold to a GSE is conforming, so its main use is to enable analysts to examine these loans which are held on bank balance sheets. The lag between the preliminary and final releases of HMDA data can be four months or longer, so it would be useful to be able to identify these loans right after the preliminary release. One way to approach this is to flag non-government loans with balances above the conforming limits as “jumbo”. How does Recursion’s “Jumbo” flag compared with HMDA’s Conforming flag? If the information is perfect, “Jumbo” loans should be all the loans that are not “Conforming”. However, the exact original balance of a mortgage is not provided by HMDA to protect privacy. For those loans close to the conforming boundary, our program can misjudge which category to assign. Given all that, going back to 2018, there is still a very strong negative connection between the two measures:  With mortgage rates near 40-year highs, there has been a pronounced collapse in refinance activity reflected in agency loan originations:  |
Archives
February 2024
Tags
All
|
 RSS Feed
RECURSION |
|

Copyright © 2022 Recursion, Co. All rights reserved.