|
In a recent post, we summarized the main market indicators from 2023 HMDA[1]. Besides offering a wider view of the mortgage market than contained in the Agency disclosures, HMDA contains a wealth of information about borrower characteristics, harking back to its original purpose of ensuring credit availability across populations. This note provides a look at some of the most-followed characteristics. We start with the race of the borrower. This type of analysis is rather nuanced as HMDA allows for information for up to two borrowers per loan file, with demographic information available for both. The chart below shows the distribution of new conventional and FHA mortgages by the race of the first race category reported by the first borrower only. 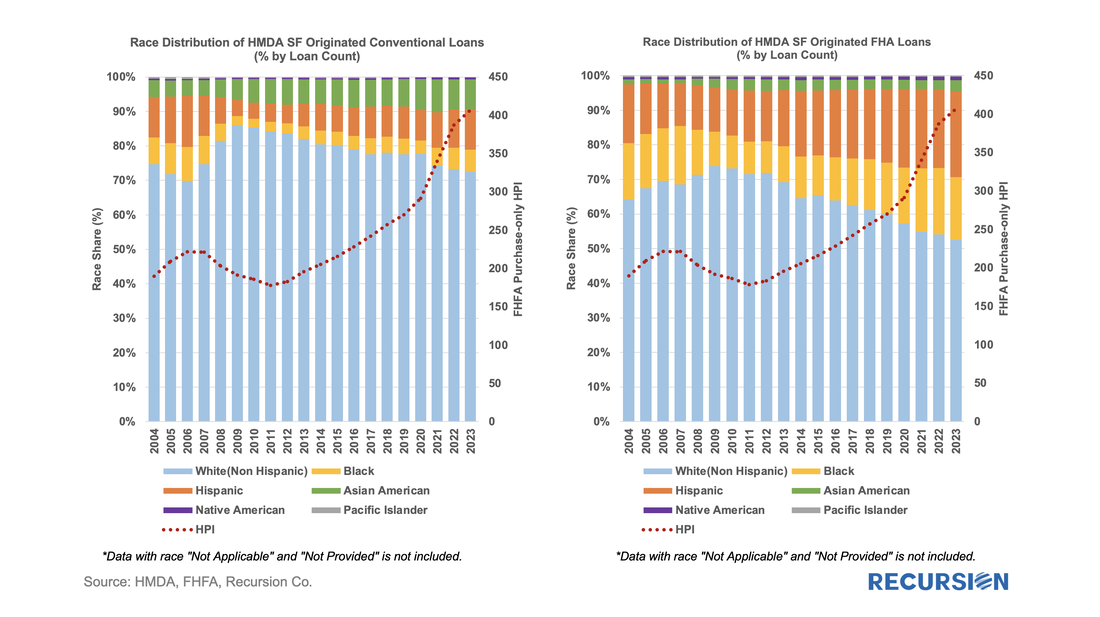 A few salient points can be immediately inferred. First, we can see that the minority share of mortgage recipients has risen steadily over the past 14 years for both loan types. 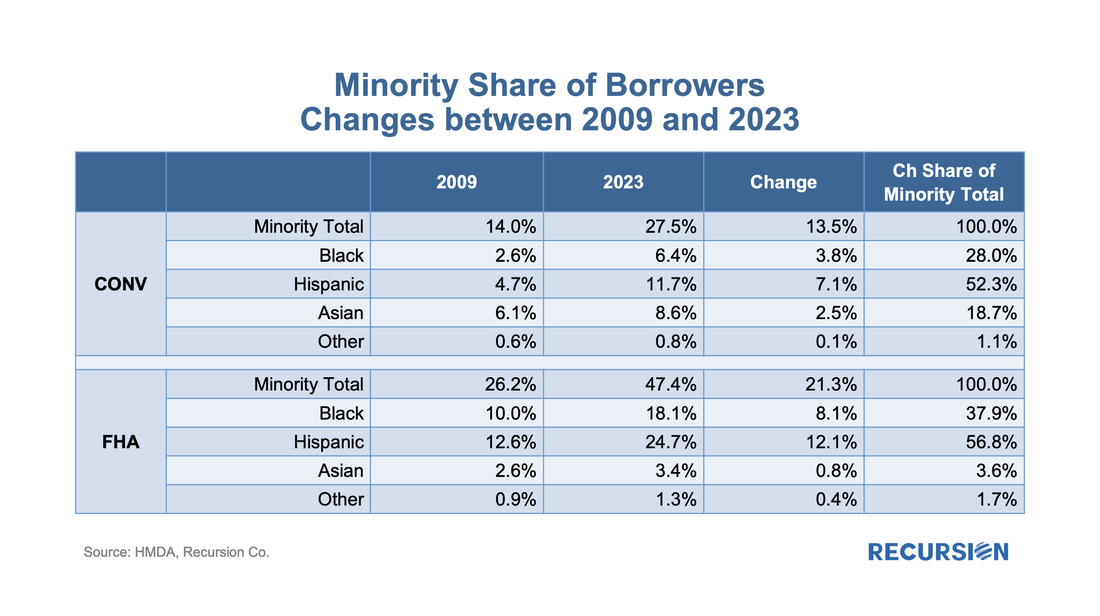 FHA continues to have a higher minority share than conventional, with minority borrowers accounting for almost half (47%) of new loans last year. That said, the share of minority borrowers obtaining conventional loans almost doubled over the 2009-2023 period to 28%, slightly below the 30% peak attained in 2006. In terms of breakdowns by race, the increase in the share of loans going to Hispanic borrowers led minority in both the conforming and FHA markets. Asian borrowers remain more significant to conventional than to FHA. There are many factors that account for these trends, including population growth in each category, policy measures taken to support minority ownership, and overall market conditions. It’s interesting to note that there is a distinct correlation between minority share and house prices in both programs. In the mid-2000, this ended badly as a disproportionate share of minority borrowers were trapped in toxic loans that led to foreclosures when the market collapsed. These concerns do not automatically carry over to the present as credit conditions are much more conservative, and policy is designed to keep distressed borrowers in their homes to the greatest extent possible. Next, we turn to gender. Here is the share of two-borrower loans where the lead borrower identifies as female: 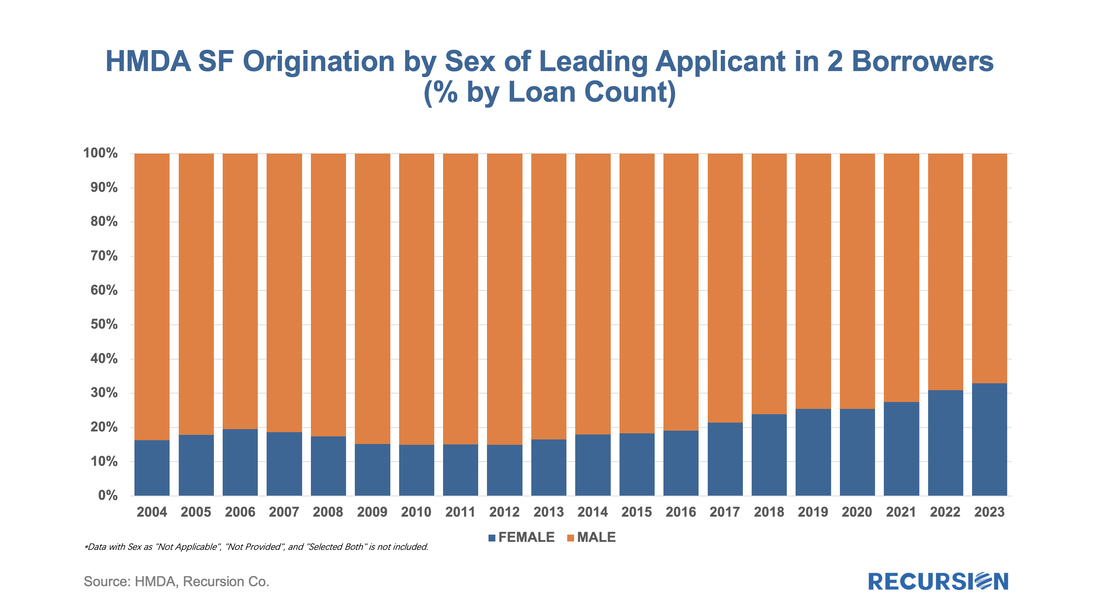 In 2023, the female share rose for the 10th time in 11 years, more than doubling from 14.9% in 2012 to 32.9% last year. HMDA also contains borrower income information, but a detailed analysis awaits the arrival of MSA-level median income data from HUD, which should be out sometime mid-year about when the final version of 2023 HMDA is released. For now, we can look at the distribution of loans by income bucket for the past three years: 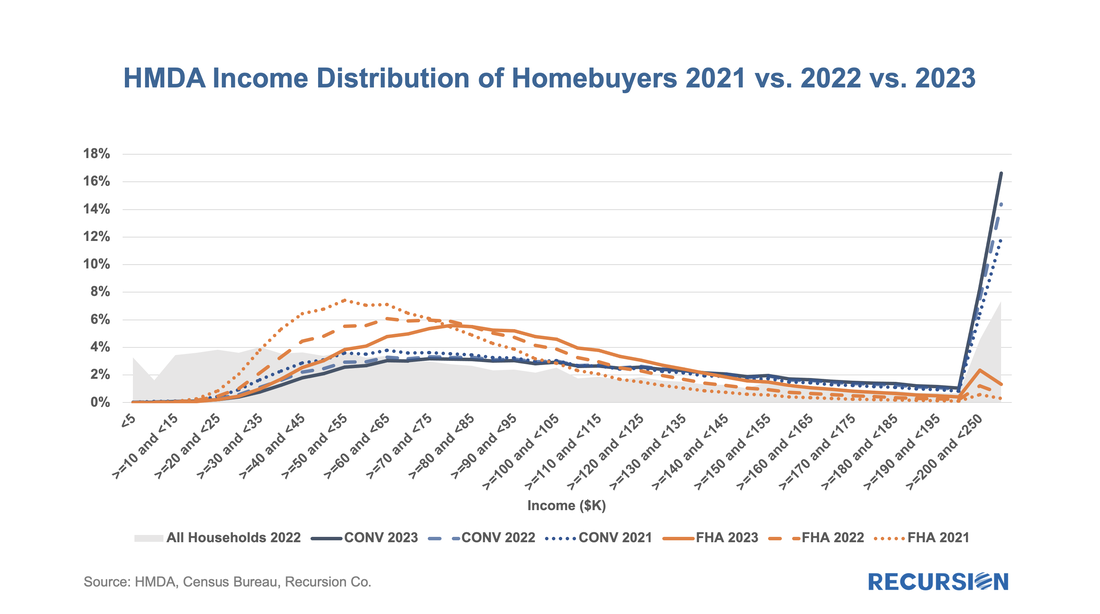 For both conventional and FHA loans, we have witnessed an increase in the weight of the distribution at the right tail, at the expense of the hump in middle-income brackets. This is particularly true for conforming loans where the share of incomes in the greater than or equal to $250 bucket jumped from 11.9% in 2021 to 16.6% in 2023. In the next blog, we will look at manufactured housing, a topic receiving increased policy scrutiny in the current era of unaffordable housing. This rich and robust dataset can accomplish much more. Feel free to contact us with specific questions. On April 11, NPR cited Recursion data in a story about VA policies designed to assist distressed borrowers[1]. Last year, VA terminated its forbearance program, leaving borrowers vulnerable to foreclosure. In November, VA initiated a foreclosure moratorium, and on April 10, the Veterans Affairs Servicing Purchase (VASP) program was announced[2]. Recursion data was cited by the reporters to show that interest rates of newly modified VA mortgages are higher than those currently in the forbearance program. 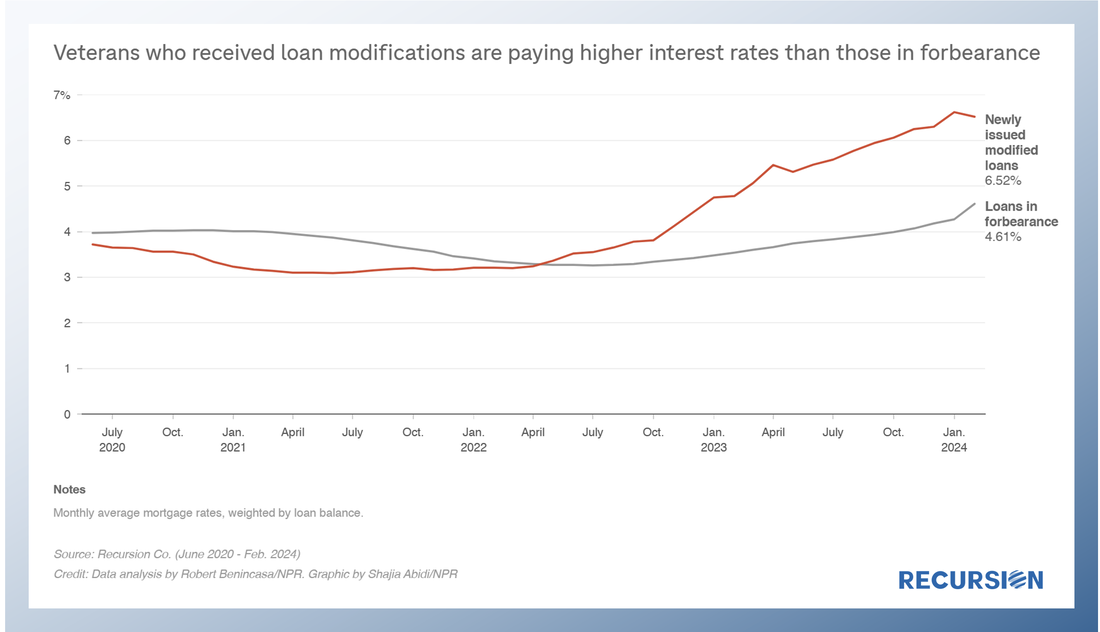 A little while ago, we wrote about DPAs and noted that there are distinct differences in how these are reported between the GSEs and FHA[1]. Subsequently, we looked into the issuers of these FHA DPA loans and noted that DPA usage has been broadening to include a growing set of lenders in recent years[2]. We now turn to the GSEs. We noted in our earlier reports that while there is no DPA flag for the Enterprises, we can derive some information about their use from the fact that DPAs are only allowed through their specified second lien programs. This leads us naturally to broaden our investigation to consider those cases where new loans are delivered in tandem: a first or primary mortgage along with a second lien or “piggyback” mortgage. The Enterprises refer to these as “secondary” mortgages. The question of course is do we have the information necessary to assess the scope and performance of loans with accompanying seconds? Given that the GSEs disclose the CLTV as well as the OLTV of a loan, if the former is higher than the latter, we can consider it as a piggybacked loan. Grist for the Recursion mill. To start, we limit ourselves to purchase loans, and we look at the share of deliveries with accompanying second liens by agency: 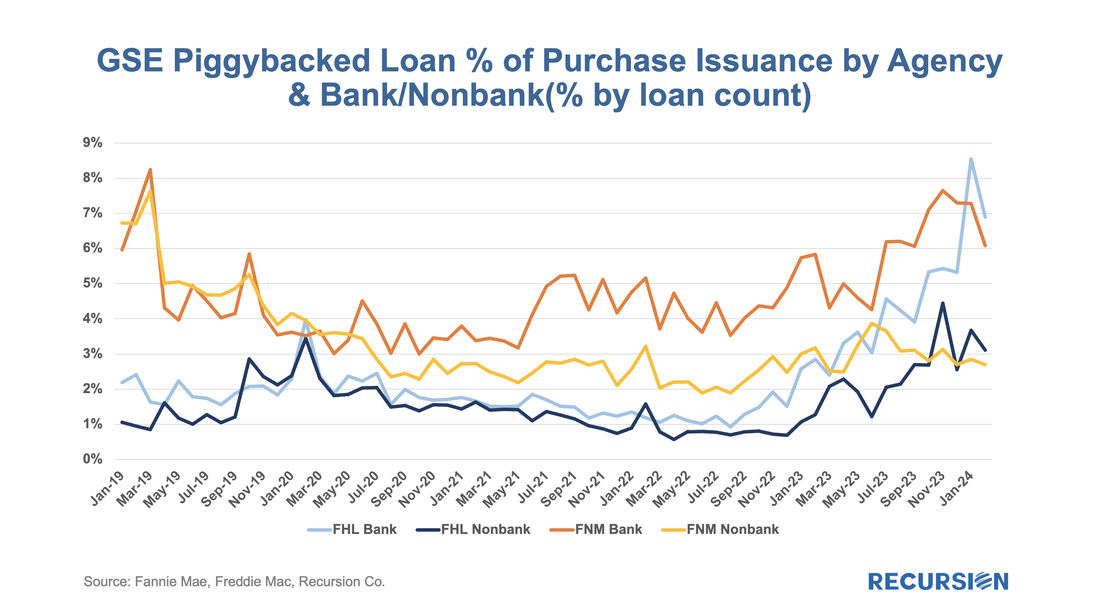 The preliminary HMDA data came out last week, and we have it fully processed and available on our Recursion HMDA Analyzer. While always notable, this release has been particularly eagerly awaited as it represents the first complete view of market conditions in “Mortgage Winter”, the extraordinary period of sustained high house prices and mortgage rates. Not surprisingly, volumes are down compared to 2022, more so for balances than loan counts: 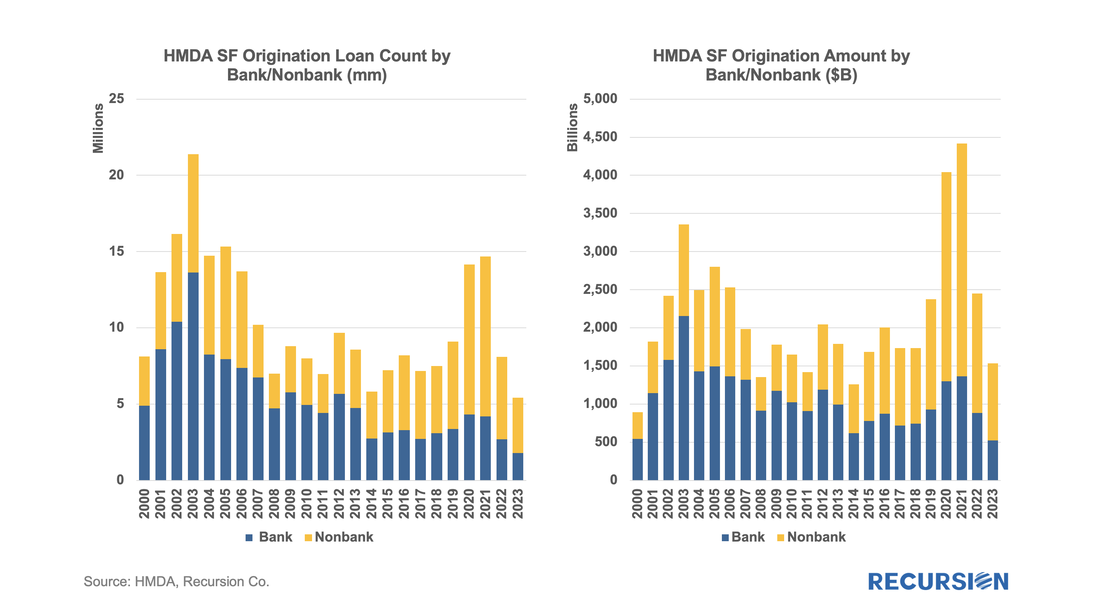 In a recent post, we discussed the impact of the COVID-19 pandemic on the mortgage market[1]. We noted that there has been a trend toward higher median credit scores in Agency mortgage deliveries since 2020 due to policy stimulus and asset price appreciation. In addition, there was a jump in median bank credit scores in early 2022, accompanied by a drop in the bank share relative to nonbanks of about 5%. This is not negligible, and the share decline has persisted over the past year. We attribute this to the shock of the collapse of four banks, notably Silicon Valley Bank (SVB), during this time. A more thorough assessment of the impact the bank shock had on the mortgage market requires access to the financial statements of a range of banks. This data is available via the Bank Call Reports. Data are released quarterly by the FDIC and made available through the FFIEC[2] with trends discussed in the FDIC Quarterly[3]. This note is meant to be a technical description of the data infrastructure we have built to support this sort of analysis by tying together mortgage production data with bank financial information from the Call Reports. The Recursion Call Report Analyzer The Call Report data is readily accessible, and we like many others have for some time pulled data down for individual institutions for use in various studies. If you want to look at the whole system, however, we are looking at well over 3,800 datapoints covering some 4,600 institutions. This is not big data like the Agency loan level disclosures or HMDA data, however, normalization of the dataset takes considerable subject expertise, as banks report different forms with different datapoints. Since we are interested in applications to the mortgage market, we start by linking institution names to the consistent naming database we have built in the Agency mortgage space. That allows us to make quick inferences into the mortgage world from bank shocks. In next step, we designed a front-end system (the Analyzer) that allows users to pull down data for designated characteristics for subsets of banks using a graphic interface without programming. To demonstrate the application of this tool, we look at some aggregate figures with a breakdown for the Big 4 Banks: JP Morgan, Wells Fargo, Citi and Bank of America. These banks were not the source of the turmoil last Spring but are of general interest. The Overall Bank Picture First, we break down the banks into three buckets: large (assets over $1 trillion), medium ($100 billion to $1 trillion), and small (under $100 billion) using the total assets of them obtained from Bank Call Reports. Then we analyze them through the origination data from two traditional Recursion tools, HMDA Analyzer and Cohort Analyzer (for agency loan level disclosure). Below find charts of the distributions from each source for conforming mortgages by loan count back to 2019: 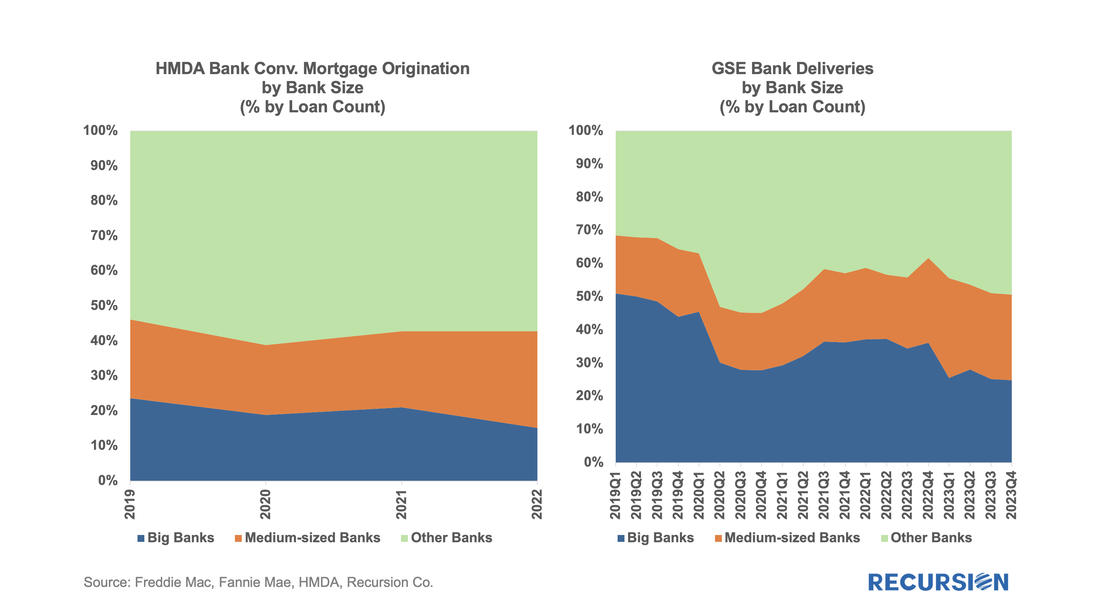 Note that the HMDA data ends in 2022 as 2023 HMDA has not been released yet. In both cases, we see a trend decline in the share of the Big 4 banks. There are a couple of observations that are notable here. First, the share of mortgage activity of the Big 4 institutions with regard to mortgage activity is in decline. (Originations by 9% from 2019 to 2022, deliveries by 22% from 2019 to 2023). It seems that the bulk of declines in the bank share of deliveries in 2023, cited in the earlier note, was concentrated in bigger banks. Below find a table of the share of deliveries of the Big 4 Banks along with the median credit score quarterly since 2021: 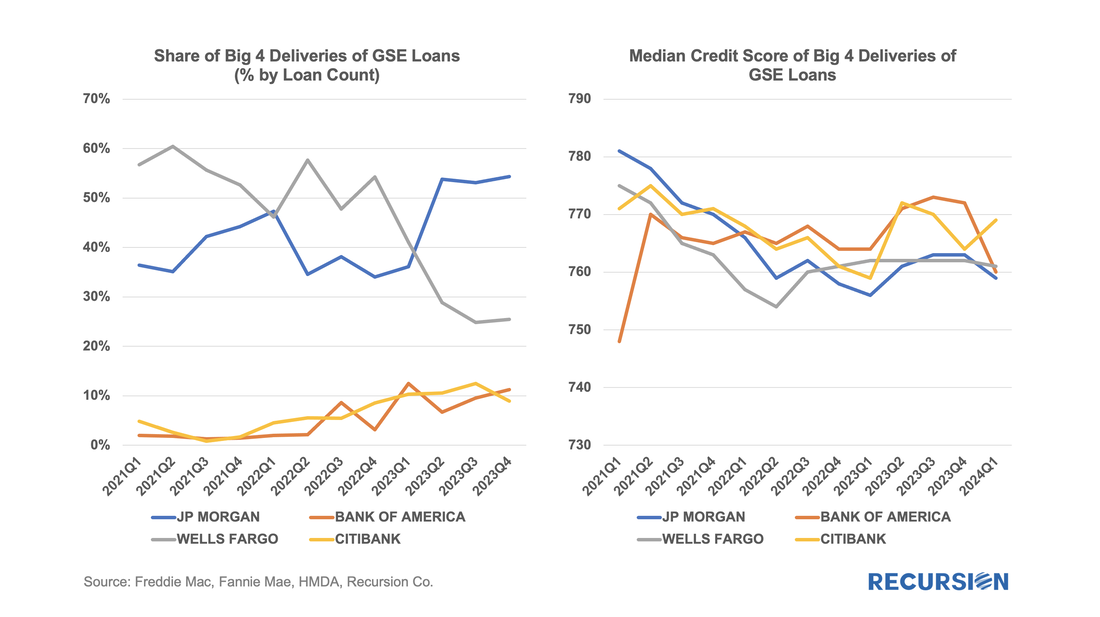 New York, NY March.13th 2024: Beginning February 27, 2024, Recursion began providing the CRE Finance Council (CREFC) with Agency CMBS issuance data to help keep its members informed about trends in the multifamily mortgage market. Recursion is pleased that CREFC recognizes it as a trusted source for accurate and timely data. Recursion covers all agency CMBS securities, including pools, CMOs, and other products with more complex structures that connect the dots between multifamily originations and securitization processes.”  Mortgage Servicing Right (MSR) owners can sell excess servicing fees (ESF) when pricing is supportive or when they need cash. The securitization vehicle for this activity is Agency ESF strips without a Principal-only (PO) component, which are disclosed by Fannie Mae and Freddie Mac. In recent years, issuance of cash strips has been rare, and most strips issued by the GSEs are ESF strips. The following chart shows the amount of ESF securitized each year --- as we can see here Fannie Mae had no activity in such deals in 2020 and 2021 but came back into the market in 2022. To close the gap with Freddie Mac Fannie Mae enhanced its related data disclosures at the beginning of 2023[1]. Fannie Mae’s market position improved from 0% in 2021 to 5.5% in 2022 and to 29.3% in 2023 and 25.8% in the first two months of 2024. 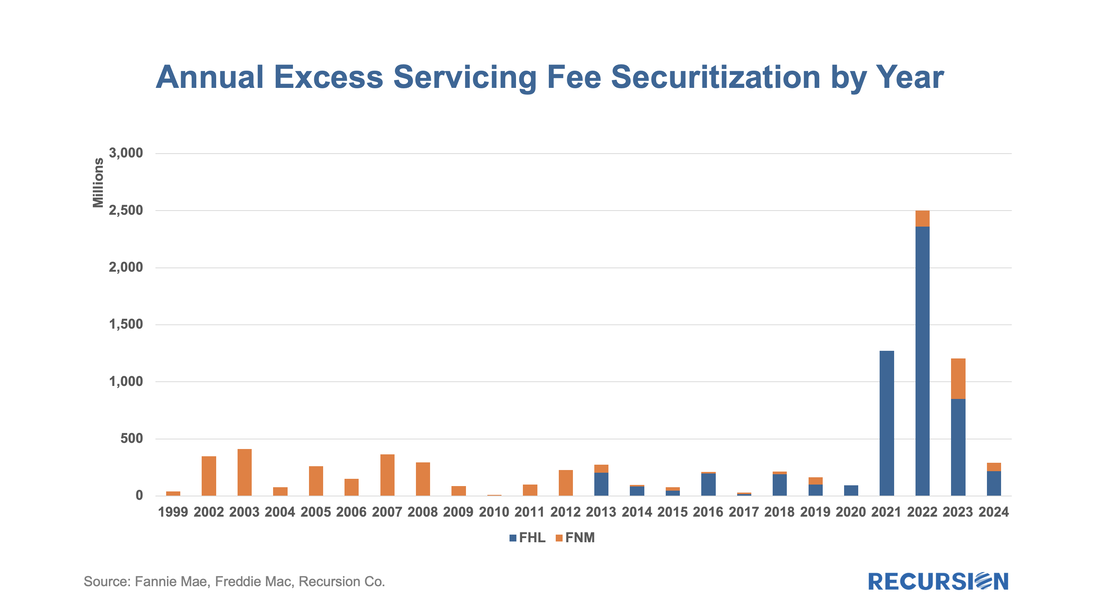 In a recent post, we reviewed the market for mortgages with down payment assistance features[1]. We noted that our loan-level data for FHA showed a rate that was about half of that reported by the FHA Portfolio Snapshot database. Since the agency disclosures are at the loan level, we use this dataset to do a deep dive into which servicers are most active with this product and what loan performance looks like across institutions. Unlike the previous note, which covered all deliveries, here we focus on the market for new purchase mortgages. Below find a table of the DPA usage for the top ten FHA purchase mortgage issuers in 2023, along with summary statistics for 2022 and 2021: 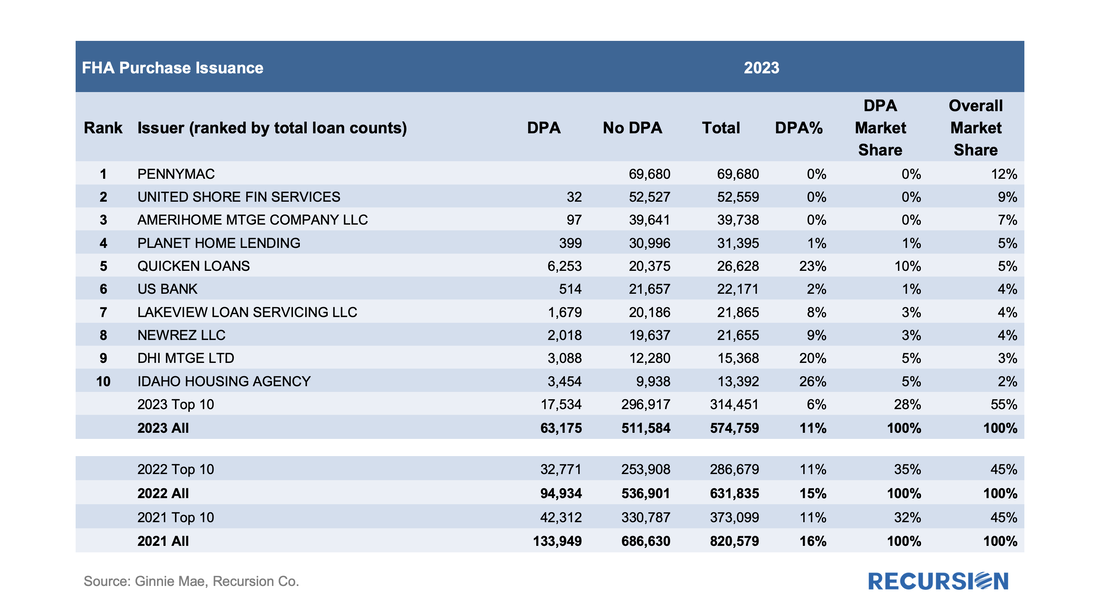 |
Archives
February 2024
Tags
All
|
 RSS Feed
RECURSION |
|

Copyright © 2022 Recursion, Co. All rights reserved.