|
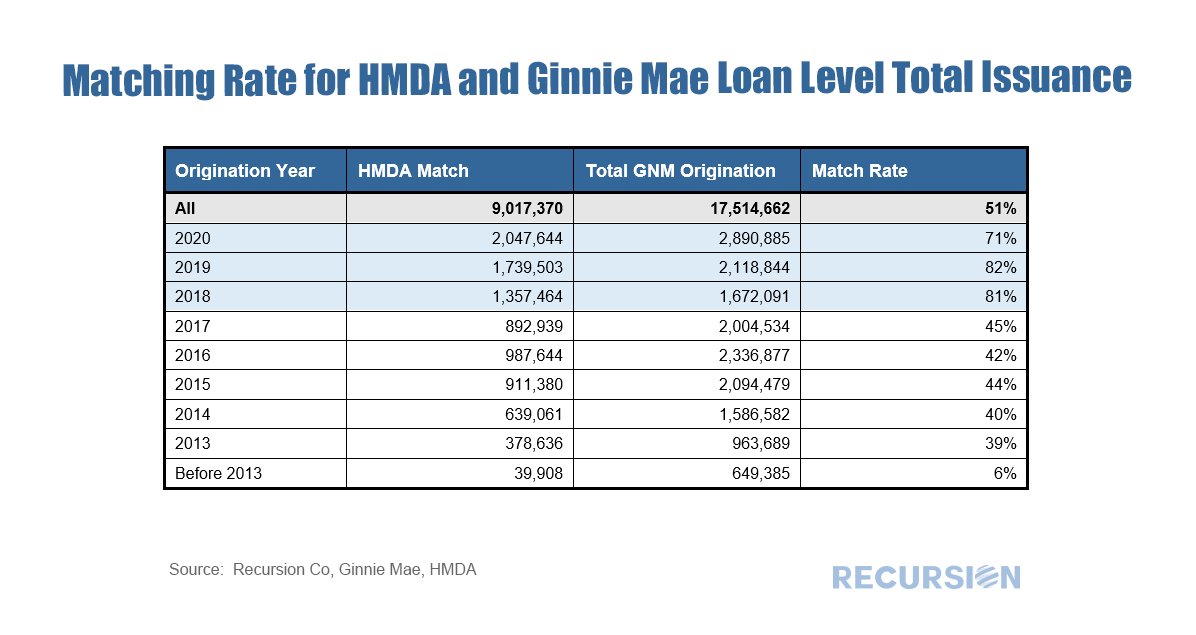
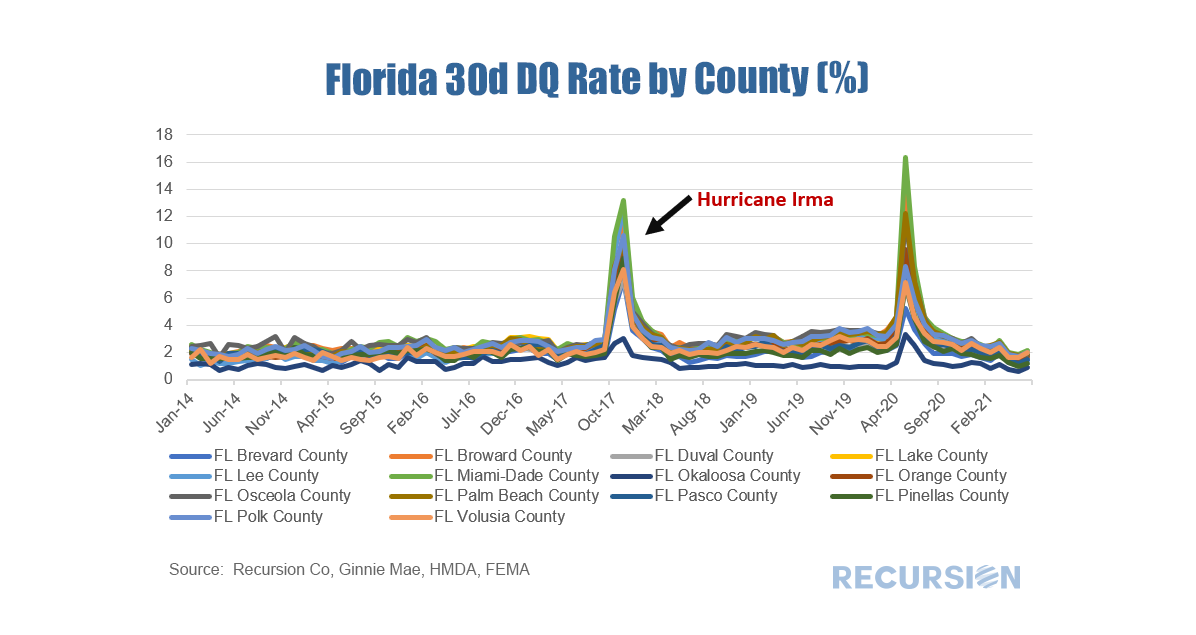
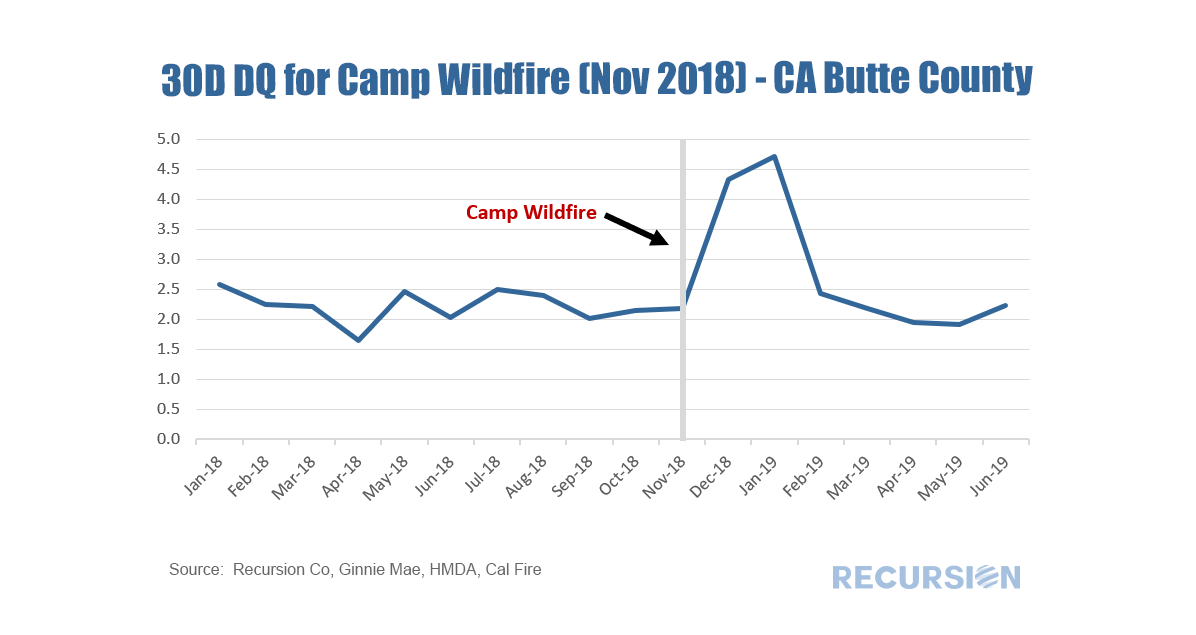
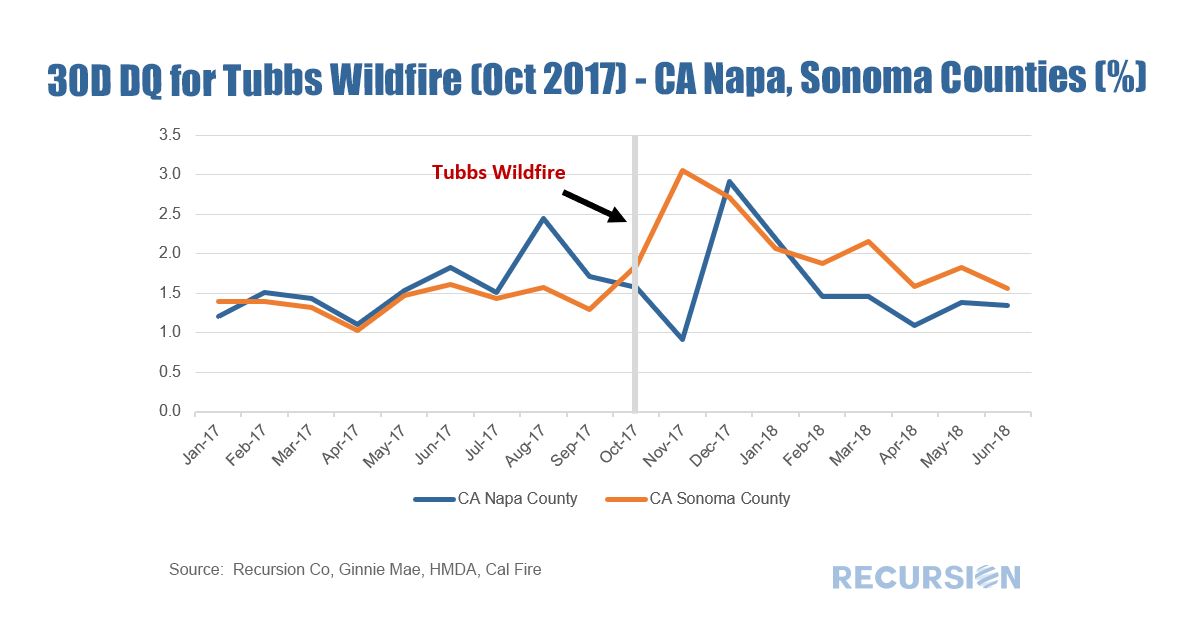
In a previous post, we mentioned the Recursion Matched data set[1], which uses a proprietary algorithm to match the loans provided in the monthly Agency loan tapes, with HMDA data. This allows for a broad analysis of loan performance (delinquency and prepayment rates) in terms of both underwriting standards (credit score, DTI, LTV) with demographic and household economic characteristics (income, race, gender, etc). We are always working to improve our algorithm, below find the match rates for Ginnie Mae loans over the 2013-2020 period. HMDA has released more characteristics in recent years, allowing for a greater matching rate. An important distinction between the two datasets is geographic coverage. The Agency loan tapes provide data only at the state level, while HMDA goes down to census tracts. The Matched data set then allows us to assess performance at a local level, which provides a lens on the impact of natural disasters on loan performance. There are a couple of approaches that can be taken here. First, we look at the performance of loans as measured by 30-day delinquency rates for 14 largest counties in Florida since 2014: The spike in 2017 was from Hurricane Irma, whose effects over this period were exceeded only by the Covid-19 pandemic last year. Another approach is to look at specific events. In this case we look at two major California wildfires, Camp Wildfire in 2018, and the Tubbs Wildfire in 2017. This just scratches the surface of what is possible here. With the ability to dig down deeper into the census tract level, we can perform further analysis breaking this down by income, and other socio-economic characteristics. |
Archives
February 2024
Tags
All
|
RECURSION |
|
Copyright © 2022 Recursion, Co. All rights reserved.


 RSS Feed
