|
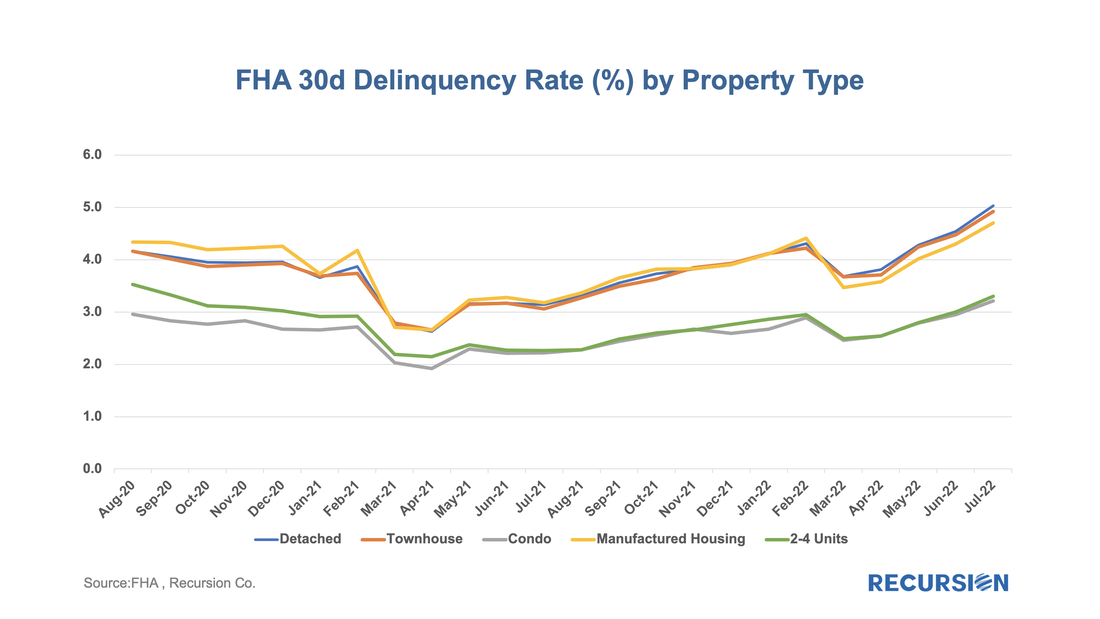
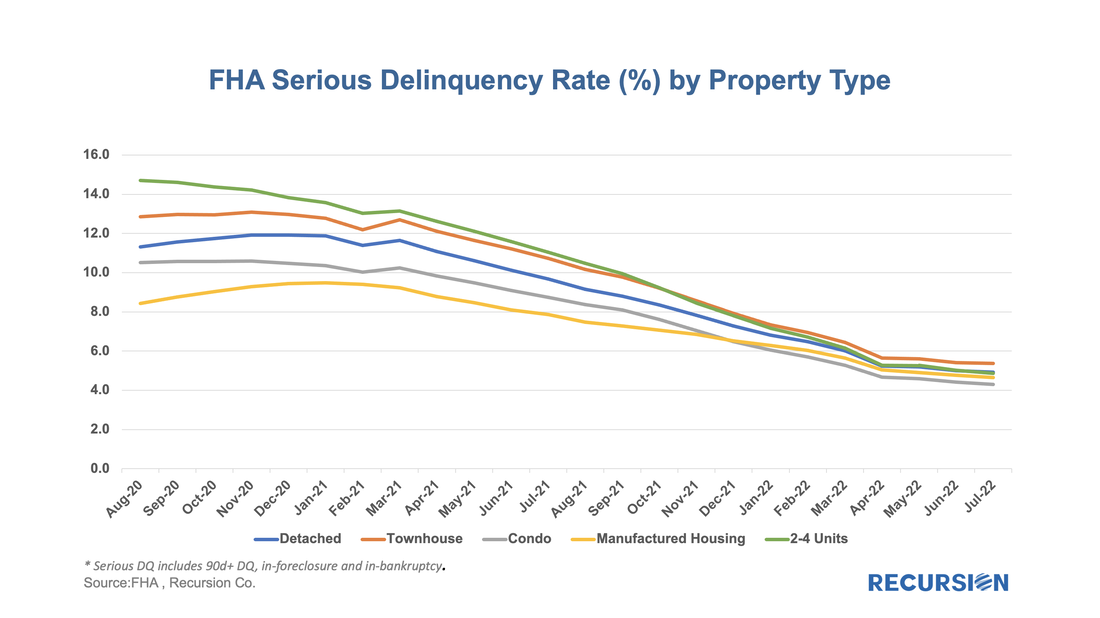
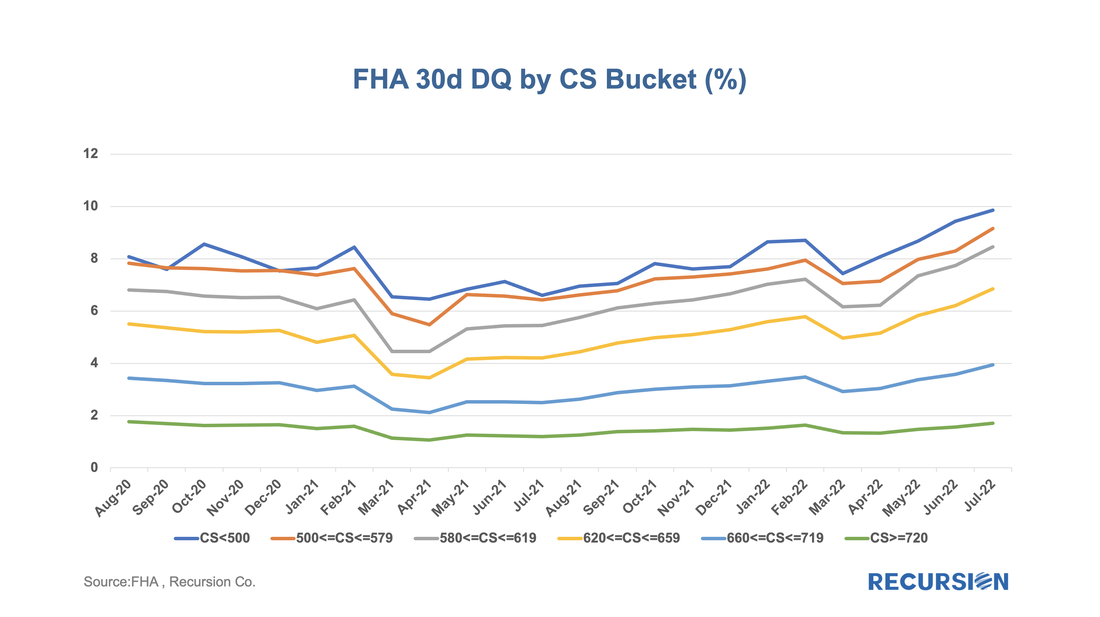
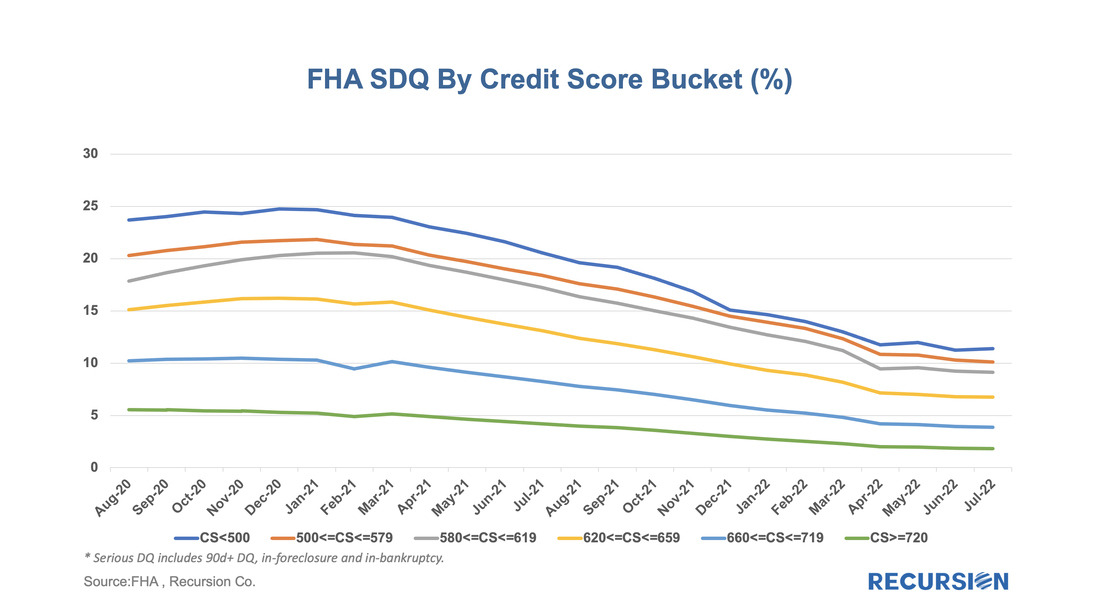
In a recent post, we discussed the utility of the FHA Performance dataset in tracking borrower stress in the housing market[1]. Here we look at other interesting market perspectives that can be obtained from this release. First, we look at property type. This breakdown is not available in the GNM loan-level disclosures, so this is a new view. Here we have 30-day DQ rates broken down over five categories: What stands out the most here is that you can collect the categories into two groups: a lower-DQ group consisting of Condos and 2-4 unit structures, and a higher-DQ group consisting of detached houses, townhouses, and manufactured housing. More research needs to be conducted to explain this phenomenon. A quite different picture can be seen for borrowers in a state of serious delinquency: In this case, we’ve seen a steady convergence of distress rates in a period of the overall decline. The rise in short-term delinquencies since early this year has yet to show up in this statistic, which continues to post modest declines across all categories. It will be interesting to see if this distinction persists. The second new perspective is that of performance by credit score bucket. Here is the pattern for 30-day DQ: As might be expected, the recent increase in short-term delinquencies has been seen in the lower credit score cohorts. Here is the same chart for SDQ’s: This, of course, is the “new” information that provides insights Ginnie Mae loan-level disclosure data does not cover well. Again, the improving trend is flattening, but as of the end of July, no visible sign of worsening could yet be seen. As the cycle unfolds, good metrics of distress are important in assessing the level of stress in the mortgage market. Recursion is a preeminent provider of data and analytics in the mortgage industry. Please contact us if you have any questions about the underlying data referenced in this article. |
Archives
February 2024
Tags
All
|
RECURSION |
|
Copyright © 2022 Recursion, Co. All rights reserved.


 RSS Feed
