|
Credit provision is one of the great areas of concern addressed by the New Housing Policy. In a previous post[1], we mentioned that we have integrated HUD LMI Neighborhood information with our tools. We can view aggregate credit creation through Cohort Analyzer, and its composition through HMDA Analyzer. 2020 marked an unprecedented year for mortgage production as the pandemic sparked aggressive moves by the Federal Reserve driving mortgage rates to record lows, coupled with a flight of households away from density towards more sparsely populated areas. Trends in the major programs by loan count can be seen here: 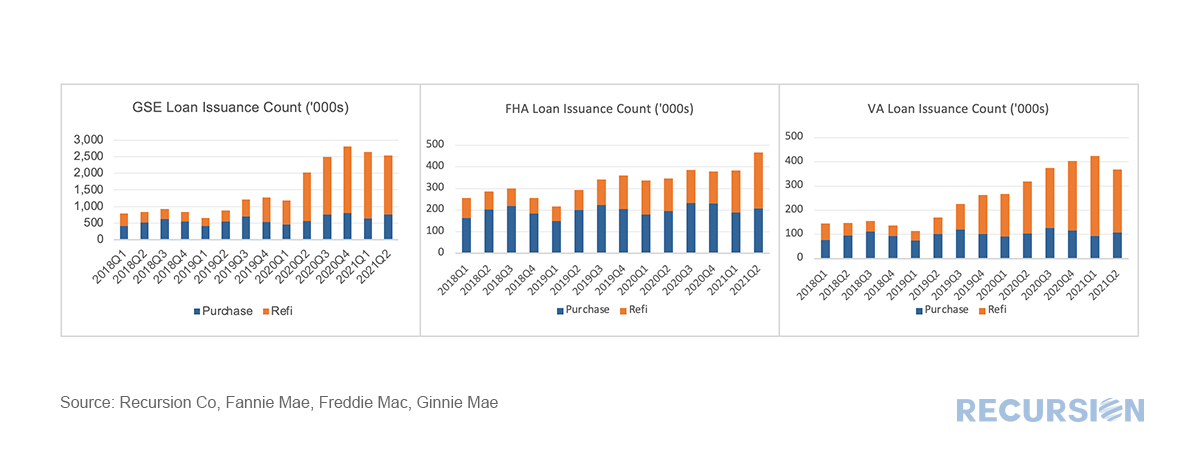 *This chart can be duplicated using the above two queries
The matched dataset continues to pay dividends (sorry no buy-backs). This time we take a look at appraisal waivers. The very straightforward question based on the new data is to ask if there are differences in the rate of PIW take-up among eligible loans between areas with a higher share of low to moderate income people and those with a lower share. Our breakpoint is areas with LMI>=51(Low-or Moderate-Income Areas) and LMI<51 (Not Low-or Moderate-Income Areas), and we look here at just purchase loans. Before we begin, as this query is focused entirely on GSE loans, we felt it necessary to put the bots into overdrive to improve the match rate between HMDA and the GSE loan tapes and for those keeping track the updated match rate is: 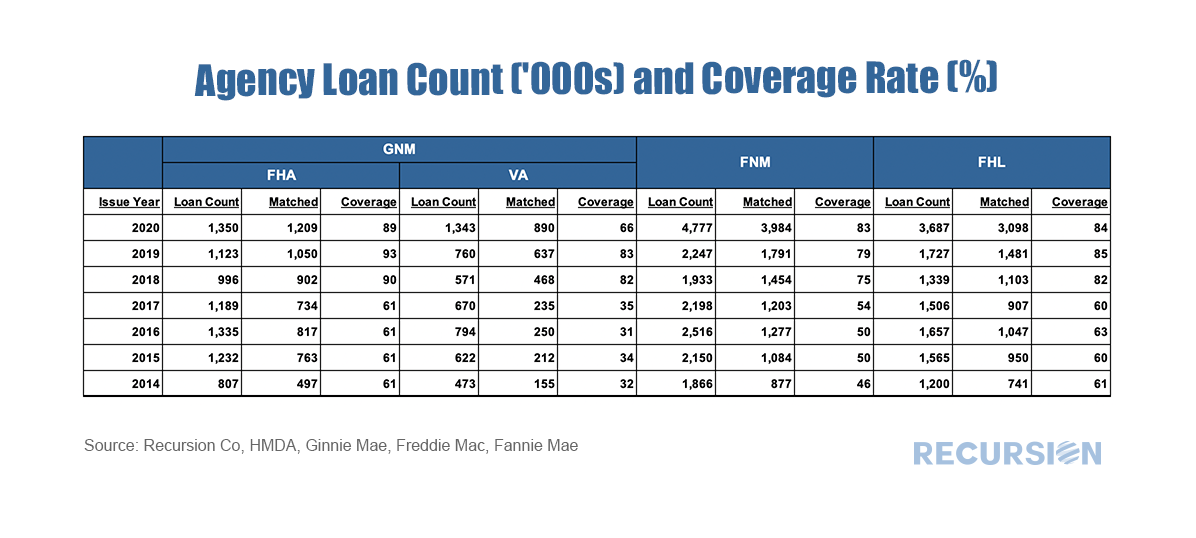 Our proprietary matching algorithm continues to chug along and our match rates between the Agency loan tapes and HMDA continue to improve. Here is an up-to-date summary table: 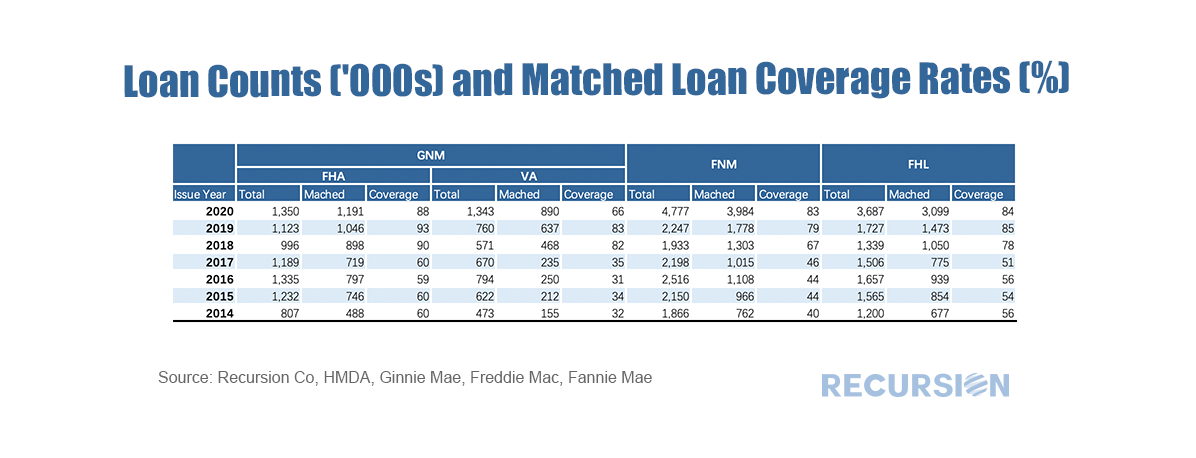 As we accumulate more data at a fine local level, the opportunities to evaluate policies derived from insights into lender, borrower and supervisor behavior grow massively. Our recent post looking at the potential impact of FHFA’s new rate mod policy[1] is our most recent example of the application of digital tools in the policy space, but as noted previously[2], the new policy framework is designed to focus on wealth creation and housing sustainability at the local level. To look at this issue, we need to have data at hand that tells us which local areas have a preponderance of low-income borrowers on which we can overlay the HMDA data set, which reports census tract level indicators related to the policy issue at hand. It turns out that the income data can be found in the American Community Survey (ACS)[3]. A key facet of this survey is information regarding the share of every census tract where low and moderate income (LMI) people comprise less than or equal to 51% of the total population. This data is available through the HUD Exchange[4]. With that, we now have a robust tool for analysis. An immediate challenge in this regard is to come up with specific queries out of the myriad of possibilities that demonstrate their power. Below finds a chart that provides a big-picture view of lender behavior in LMI neighborhoods broken down between banks and nonbanks[5]. Specifically, we look at the trend in purchases from third-party originators of both FHA and conventional loans: 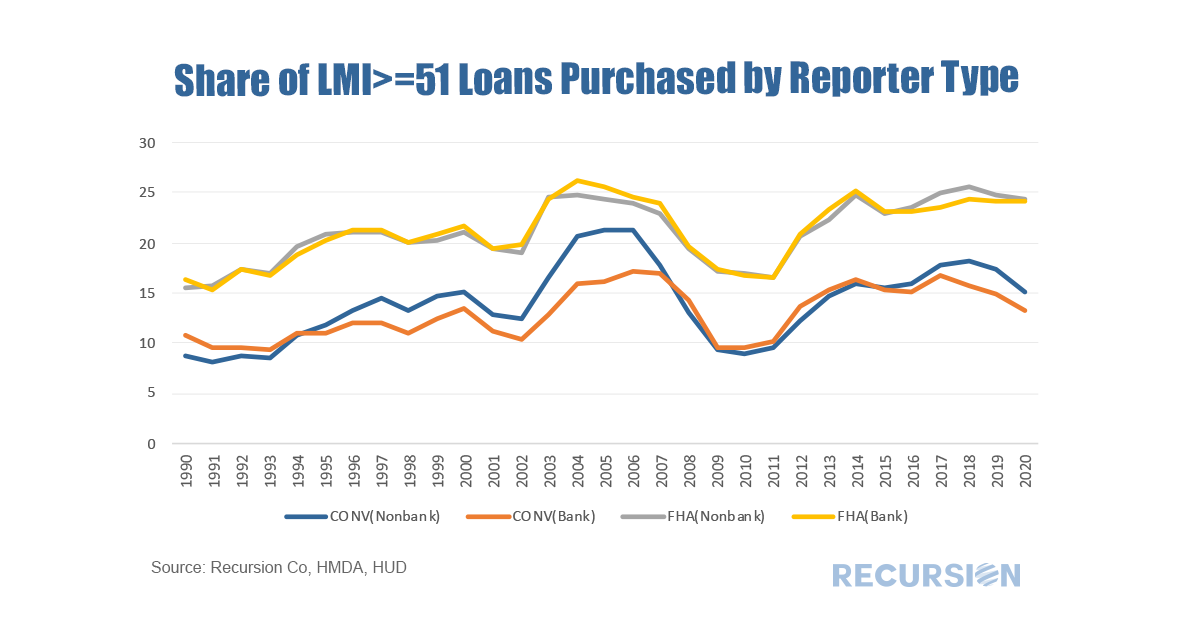 In a previous post, we mentioned the Recursion Matched data set[1], which uses a proprietary algorithm to match the loans provided in the monthly Agency loan tapes, with HMDA data. This allows for a broad analysis of loan performance (delinquency and prepayment rates) in terms of both underwriting standards (credit score, DTI, LTV) with demographic and household economic characteristics (income, race, gender, etc). We are always working to improve our algorithm, below find the match rates for Ginnie Mae loans over the 2013-2020 period. HMDA has released more characteristics in recent years, allowing for a greater matching rate. 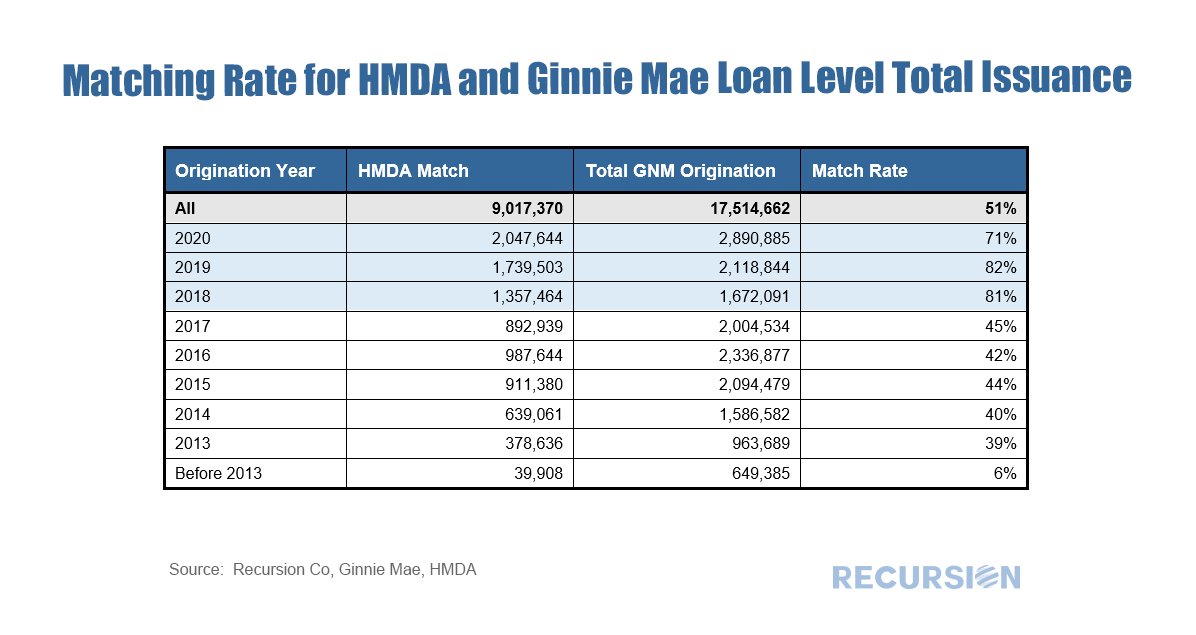 While market commentary is focused on developments such as inflation and house price increases, the key housing policy issues in the post-Covid world are financial inclusion and climate change. Our agency loan-level data provide us with many insights into market trends, but these do not contain demographic or geological details that are necessary to perform in-depth analysis in these areas. On the topic of financial inclusion, the key supplemental data set is the Home Mortgage Disclosure Act (HMDA) dataset, an annual disclosure made by lenders in support of fair lending. HMDA data contains relevant data points such as income, gender, and race. Any assessment of fair lending practices requires an analysis of how these factors influence the availability of credit. To accomplish this, Recursion has applied a proprietary matching algorithm to create a robust dataset consisting of loans with both underwriting and demographic characteristics. Over the period 2008 – 2020 the data set consists of about 20 million loans. Below finds a chart of average credit scores by race (as measured by race of the first borrower) over the 2008 – 2020 period from this matched data set: 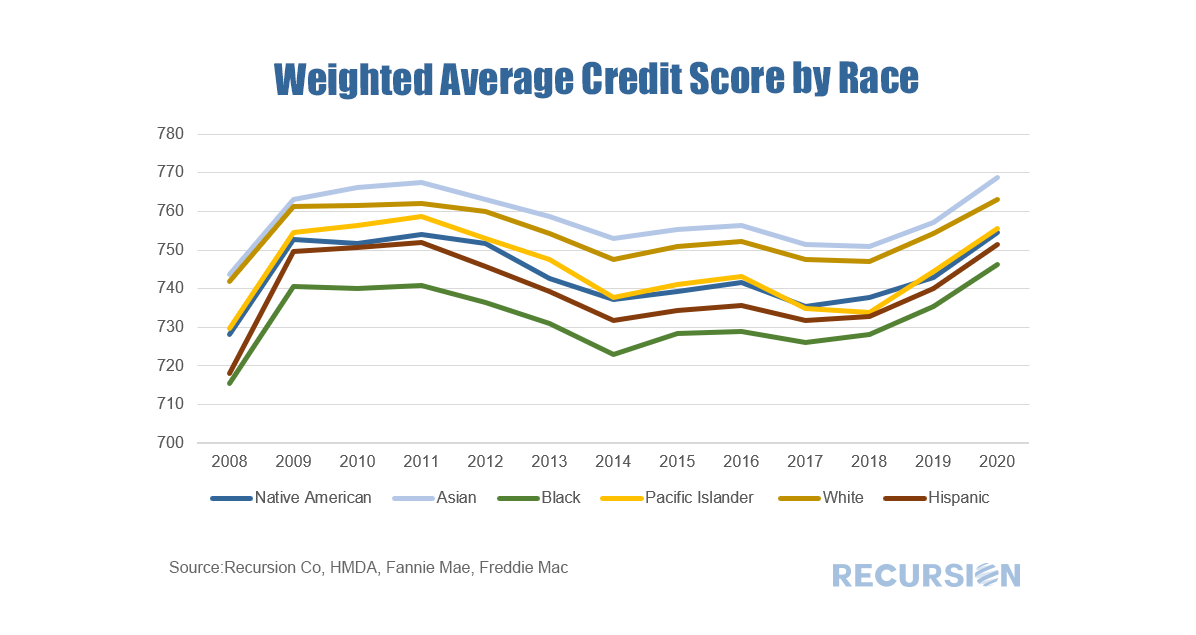 Last August we reported that we had downloaded 2019 HMDA and detailed queries were accessible to our clients via HMDA Analyzer[1]. Recently, the CFPB provided a preliminary release of 2020 data, with information from smaller reporters coming a bit later in the year. Nevertheless, the new data is available on HMDA Analyzer and several insights can already be gained. 1. Total Origination loan count grew to its highest level since the runup to the Global Financial Crisis, driven by a surge in refinancings: 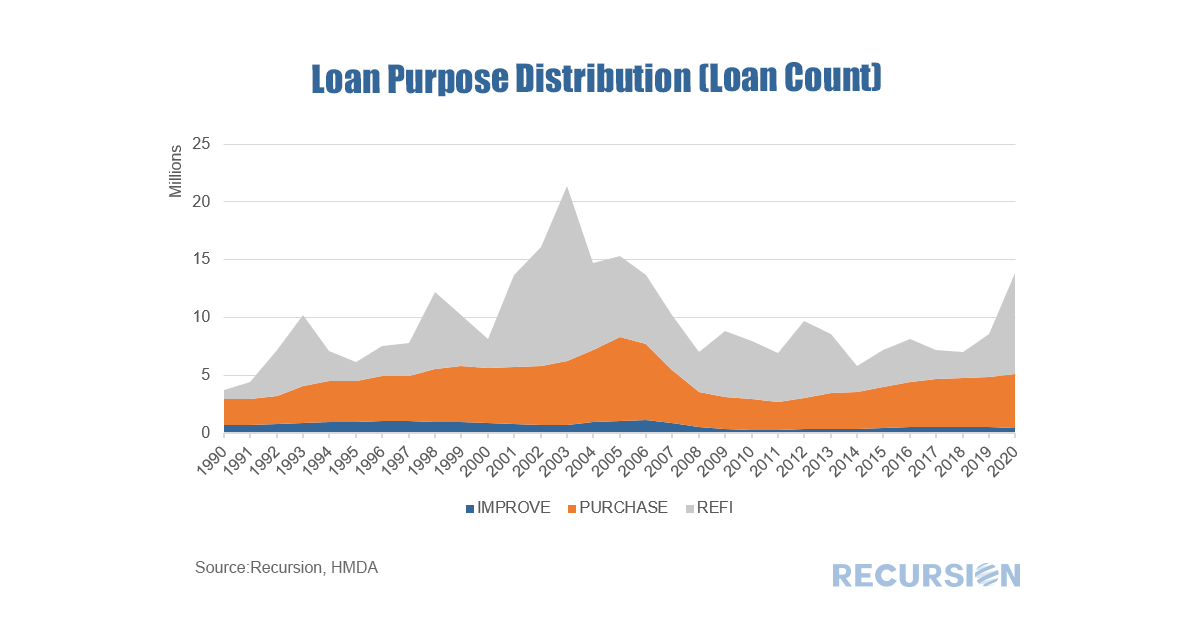 2. Nonbanks Rule – Covid 19 accelerated the long-term trend increase in nonbank lending share: 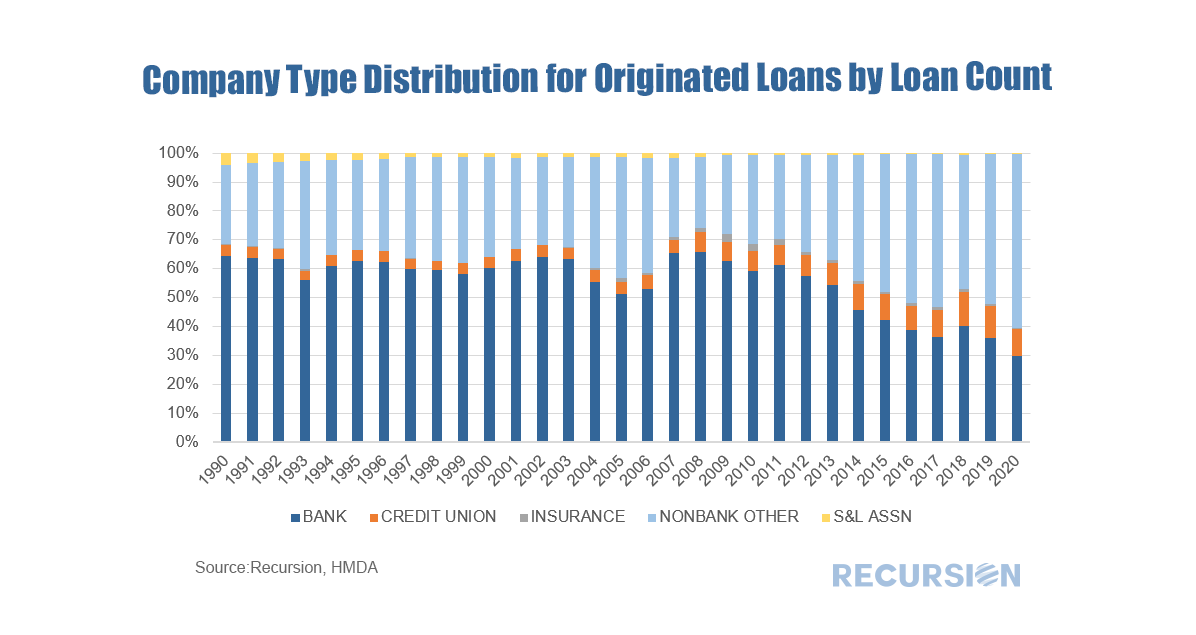 3. The held on book share collapsed, as banks preferred to hold mortgage risk in the form of MBS to avoid the potential for credit losses: 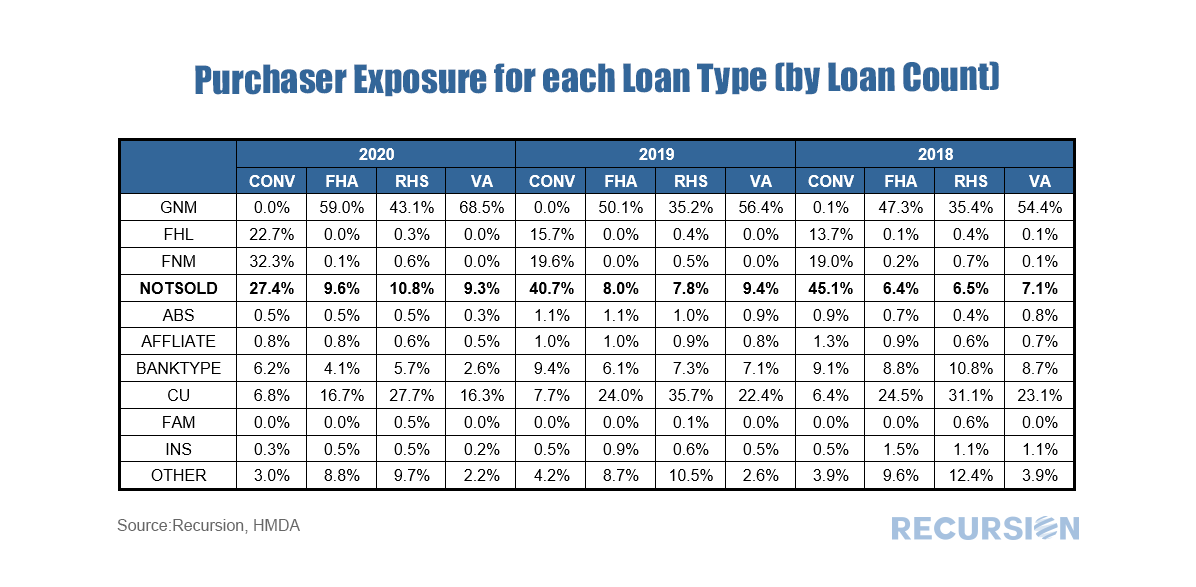 Much more can be found through with just a few clicks of the button. The millennial generation has reached peak home buying age, covering a range of about 25-40 years old. Just this year this cohort at 72.1 million passed the baby boom generation in sheer size[1] although this is a bit less than the 78.8 million peak reached by boomers in the late 90’s[2]. Millennial presence or lack of it in the housing market has been the subject of voluminous commentary, ranging from extreme optimism derived from the magnitude of the population bulge to caution related to affordability and impediments to building savings stemming from student loan debt[3] and high rental and child care costs[4]. What can big data tell us about this? A 2018 study by the Federal Reserve showed that Millennials had lower incomes and assets and higher debt than previous cohorts at a similar age[5]. Our data sets can provide some useful, but far from conclusive, insights into these trends since the onset of the Covid-19 pandemic. Covid-19 is both a cyclical and structural shock. On the cyclical side mortgage rates have fallen to record lows as the Federal Reserve responded quickly and decisively to the health crisis. On the structural side, residents of urban areas have picked up and fled to less dense locations, resulting in a sharp increase in house prices nationally. According to Redfin these price gains have been led by those in rural and suburban areas, rendering these areas less affordable, while urban areas remain out of reach for most. 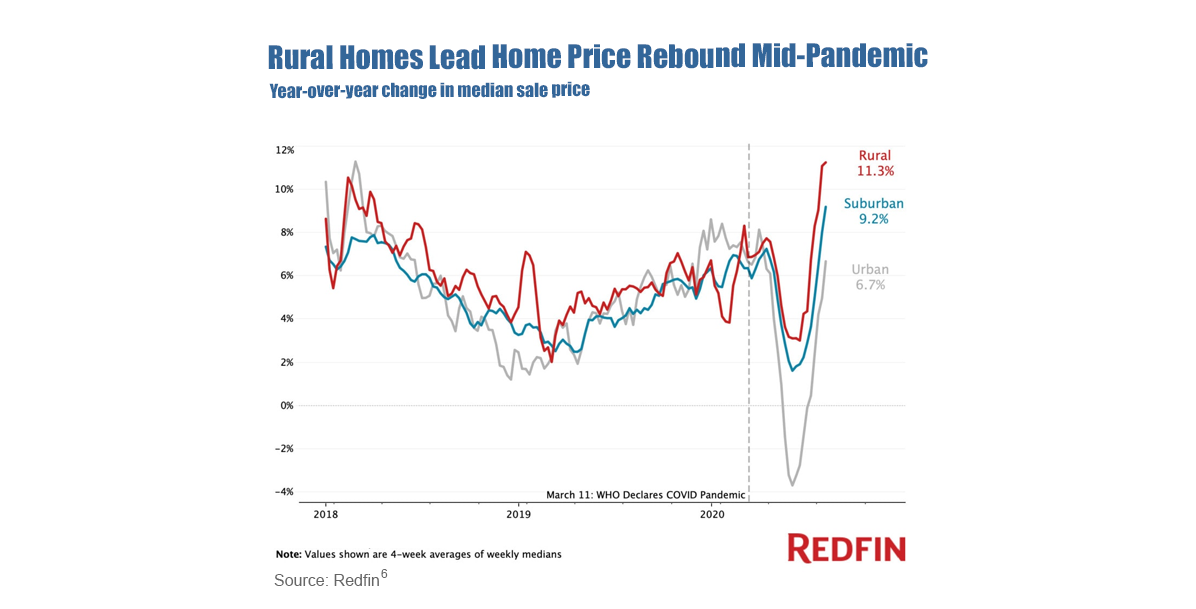 |
Archives
February 2024
Tags
All
|
 RSS Feed
RECURSION |
|

Copyright © 2022 Recursion, Co. All rights reserved.