|
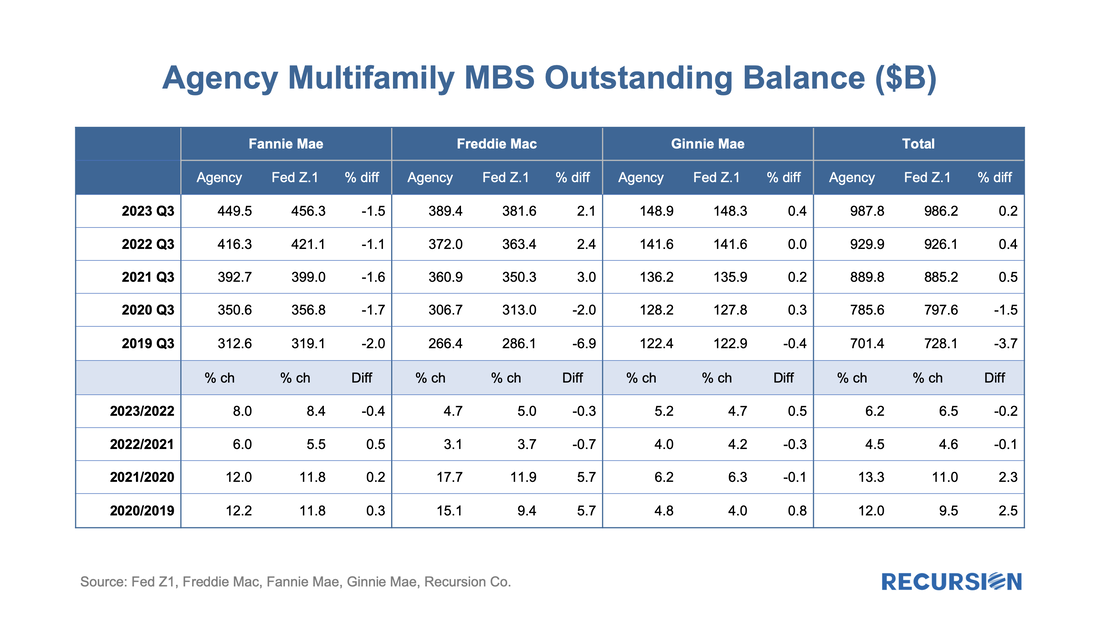
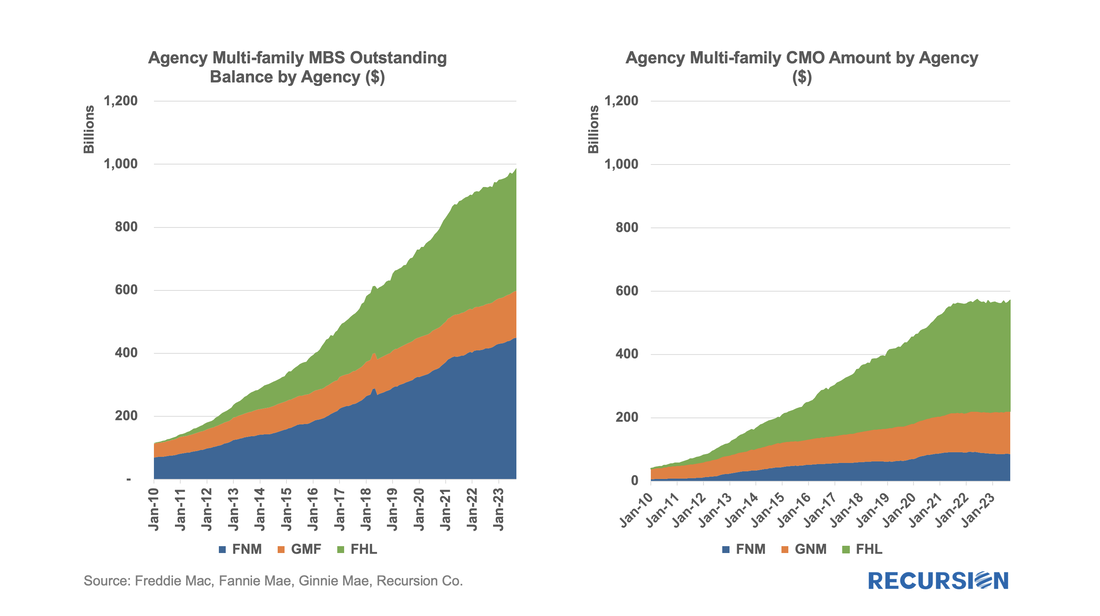
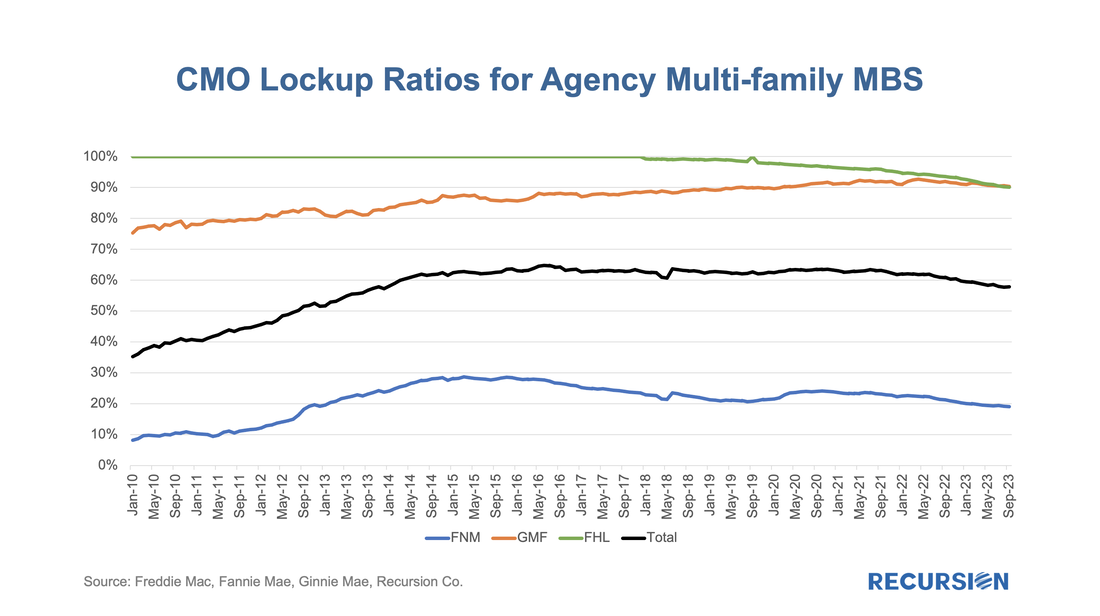
The single-family agency MBS market benefits from a set of consistent standards that allows traders and analysts to make straightforward judgments about relative value between securities. This is particularly the case for the conforming mortgage market since the single security UMBS market was launched in June 2019. The result is a market that is very liquid, supporting homeownership and affordability. There is a very different situation in the multifamily space. The programs are very distinct across, and even within Agencies. This is particularly the case for the Ginnie Mae program, which consists of construction loans that are lines of credit that are drawn upon, and then converted to project loans. The two largest programs within the GSE multifamily space are the Fannie Mae DUS program[1], where losses are shared between Fannie Mae and the underwriting banks, and the Freddie K-deals, where losses are shared with investors[2]. Both Agencies have numerous smaller programs as well with their own distinct characteristics. In the single-family space, the unit of analysis is the mortgage. These are pooled, and pools and loans are sometimes, in turn, aggregated into CMOs (We classify highly-structured deals such as Freddie K, Q, ML, SB, etc., as CMOs, too). Investors have a complete picture of activity in this market. In the multifamily space, however, the picture is murkier. There are two reasons for this. First is the multitude of different programs across the Agencies as cited above. The second is that a consistent data set for multifamily loans across the three agencies is not easily produced, as loans are typically securitized into pools, however, Freddie tends to securitize loans directly into structures more like CMOs, such as Freddie K, Q, SBL programs[3]. A year ago, we posted a note that described our bottom-up approach to sizing the multifamily market and validated this by comparing our calculation to similar figures obtained from the Federal Reserve Z.1 report. We are pleased to report that this approach continues to provide an accurate picture of total market size as our figures for the third quarter have consistently aligned within a margin of 0.5% for the past three years. The total outstanding balance grew by 6.2% in Q3 2023 over the same period of 2022 (Recursion’s figure), a modest acceleration from 4.5% the prior year. This is consistent with the continued solid demand for rental housing given the lack of available supply of affordable owner-occupied units. Contrasting approaches An important technical point is that compiling this data from the agency websites is a challenging task due to the lack of consistency in formats between agencies and within agencies over time. As a consequence, market participants tend to look at CMO (including Freddie K, Q, ML, SB, etc.) production rather than loan production to assess market developments. This is because the CMO data is more readily available from the trustee websites compared to the Agency data and is also easier to manipulate. However, this has never been an adequate approach and is growing even more inadequate over time. Below find charts of MF loans and CMOs by Agency: These are not the same. Another way to look at this is the CMO securitization rate by agency: On an aggregate basis, at present CMOs account for just 60% of the total market, down from a recent peak of 65% in 2016. In general, CMO rates tend to decline as interest rates rise as there are fewer premium bonds that are eligible to be used as collateral. This seems to be particularly important for Fannie Mae CMOs as the securitization rate has declined by 5 points to 19% over the past three years. What else is implied here? Above, we have pointed out the clear shortcomings of using CMO data for market analysis: namely, the inability to determine the effect of policy changes on Agency multifamily mortgage supply using this data. A key policy lever that FHFA utilizes in the multifamily market is the imposition of market caps on Fannie Mae and Freddie Mac[4]. CMO issuance cannot be used as a proxy for evaluating how close the GSEs are to their caps. Towards a new analytical framework A key aspect of housing policy that gets too little attention is data disclosure. We think of changes in fees and underwriting regulations and treatment of mortgage assets on bank balance sheets and even appraisal techniques as important considerations investors need to consider when assessing opportunities in mortgages. The data disclosures we currently enjoy largely fell out of the experience of the Global Financial Crisis when it became clear that pool-level information was insufficient to allow investors to make confident allocation decisions in this market. Many enhancements have occurred in the regime of loan-level disclosures we currently benefit from, but a new set of policy concerns is now testing this approach, namely challenges related to what we term “ESG” (Environmental, Social and Governance) issues. The real estate sector is a prime area for the application of ESG policies such as access to credit and support for construction and rehabilitation projects to produce environmentally friendly buildings. A key characteristic of these policies is they are very much directed at the individual property level, rather than across the broad market. The GSEs’ ESG disclosures provided to date have been at the pool level, which are unlikely to provide the information that investors will need to adequately address these issues. In the single-family space this needed transformation is challenged by privacy considerations. This is a topic left for future discussion. However, the door is open in the multifamily market, where disclosures already incorporate important property-level information, including addresses. The availability of this information implies that the way forward is to have the basic unit of analysis be the property, rather than the loan. This adds several technical issues to be addressed including the cleaning and consistency of property files across agencies and matching physical and financial data. We are well along in the process of developing this approach and are confident our new tools will provide lenders and investors with unique information to enhance their businesses in the multifamily space. In the coming weeks and months, we will be releasing some of our early results. In the meantime, please reach out if you would like to learn more. [1] https://capitalmarkets.fanniemae.com/media/7586/display
[2] https://mf.freddiemac.com/investors/k-deals [3]https://www.recursionco.com/blog/a-bottom-up-methodology-to-computing-the-size-of-the-agency-single-family-and-multi-family-cmo-market [4]https://www.fhfa.gov/Media/PublicAffairs/PublicAffairsDocuments/2024-Multifamily-Caps-Fact-Sheet.pdf |
Archives
February 2024
Tags
All
|
RECURSION |
|
Copyright © 2022 Recursion, Co. All rights reserved.


 RSS Feed
