|
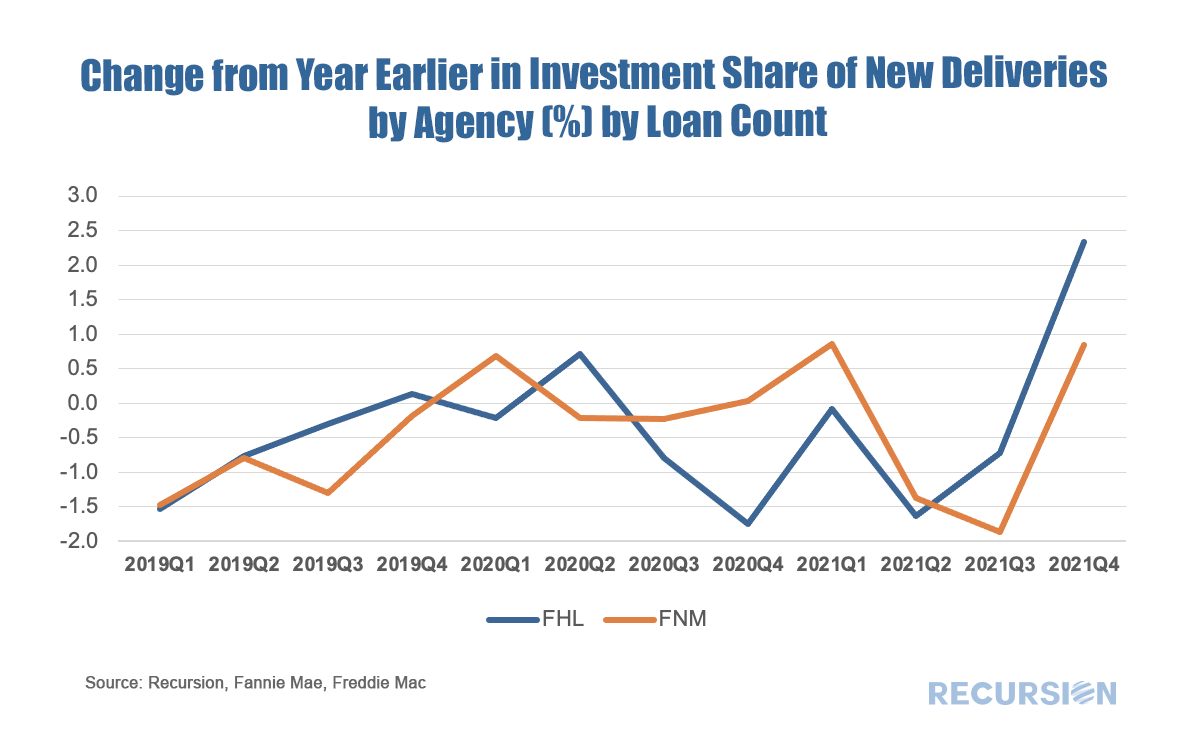
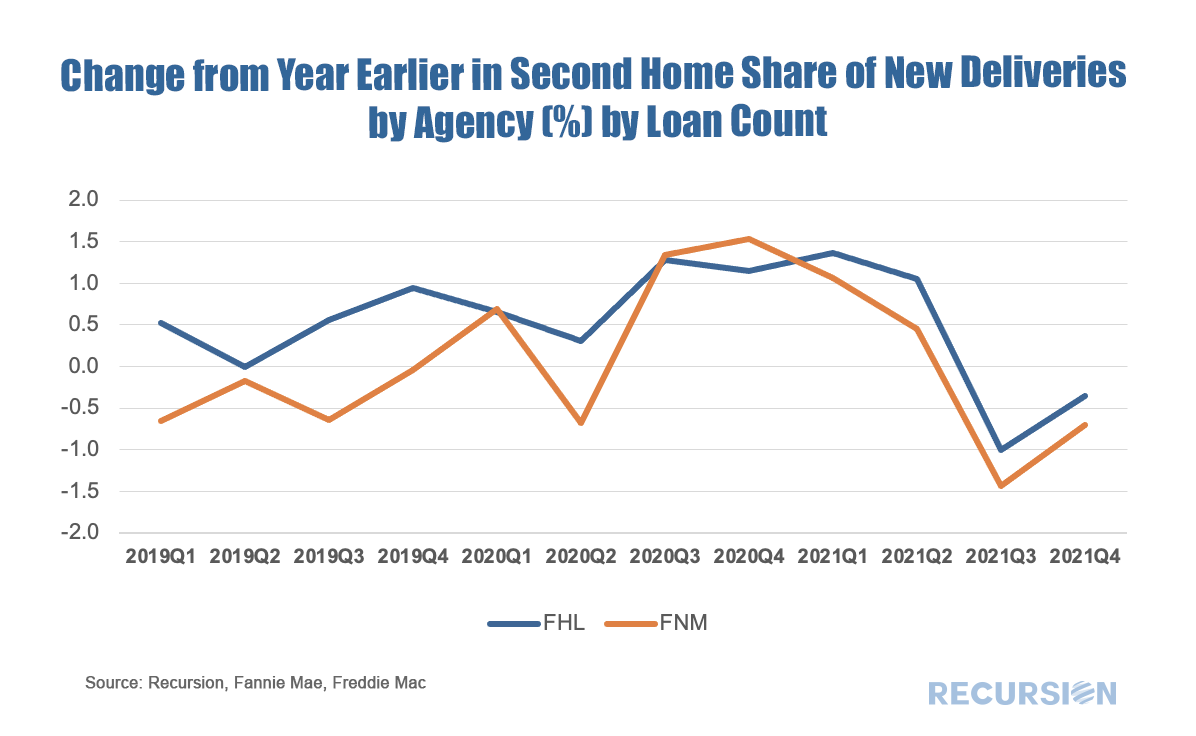
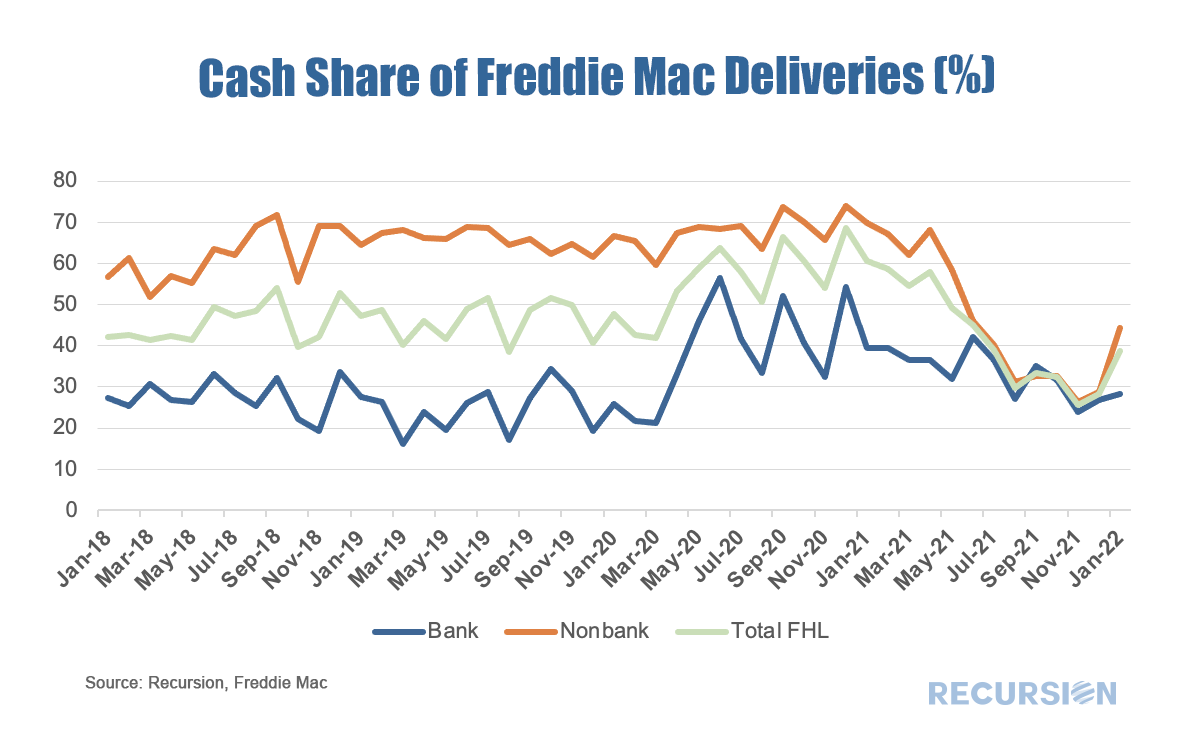
In a recent post, we discussed the market impact that arose from the imposition, and subsequent reversal, of limits on deliveries of NOO (non owner-occupied) residences, as well as on deliveries via the cash window, to the GSEs[1]. In summary, it discussed how the imposition of limits resulted in declines in the share of the NOO categories in the summer, with some rebound in evidence in Q3 when these were rescinded. In this exercise, we look at the change in the share of purchase mortgage deliveries to both Enterprises from the same quarter in the prior year. This is done to eliminate the seasonal pattern that is in evidence in these shares that derive from the fact that owner-occupied purchases tend to have a strong seasonal pattern (peak in the spring) while the NOO categories do not. If the suspension of the constraints in September 2021 were binding, we would expect to see a jump in the share in the NOO categories in Q4. This is certainly the case for investment properties: After being below the same quarter of the prior year in the middle two quarters of 2021, the share of investment properties out of all deliveries rose by 0.8% in Q4 for Fannie Mae and 2.3% for Freddie Mac from Q4 2020. The picture is not so straightforward for second homes, however: There was a slight rebound in the shares for both Enterprises in Q4 2021, but in both cases, the shares were below their levels of Q4 2020. Apparently, the caps were not particularly constraining in this case. What is interesting is the persistent moderate increase of 1.0%-1.5% in the share of second home deliveries from a year earlier over the four quarters from Q3 2020-Q2 2021. This is consistent with the view that well-off households concerned about the health impact of living in their primary residences (likely dense urban areas) purchased second homes in more sparsely populated areas to reduce this risk. It may be that this fundamental factor was playing out in Q4, but the future trend depends on the path the Covid virus takes. Finally, below find the share of all loans delivered to Freddie Mac via the cash window. Even through January issuance data is as of the 12th, as the volume is already over 60% of December 2021, we believe the cash-window usage reflects the latest trend. Before FHFA imposed the cash-window cap, non-banks’ usage of cash-window was 2-3 times of banks. After FHFA imposed the cap, non-banks had to quickly change their channel and reduce their usage to a level comparable to banks. After FHFA removed the cap, usage of the cash window for both banks and non-banks moved up however not anywhere where they were one year ago before the caps existed. This is possibly due to the fact that companies’ procedures to adjust to the cash window caps are not easily reversable. Here we have seen the cash share experience a dramatic decline in deliveries from 60% at the end of 2020 to 30% in Q4 2021. Further research is needed to provide an explanation for this sudden move. Finally, it’s fitting that FHFA’s first policy announcement for 2022 was for price adjustments to investment and jumbo loans, commencing in April[2]. In a market where home prices are being lifted in part by rising investor demand, this seems prudent from a safety and soundness standard. We should expect that the shares of loans in these categories will rise in Q1 2022 ahead of these increases, and then taper off there after. Of course, there is always room for surprise, and these trends bear close monitoring. |
Archives
February 2024
Tags
All
|
RECURSION |
|
Copyright © 2022 Recursion, Co. All rights reserved.


 RSS Feed
