|
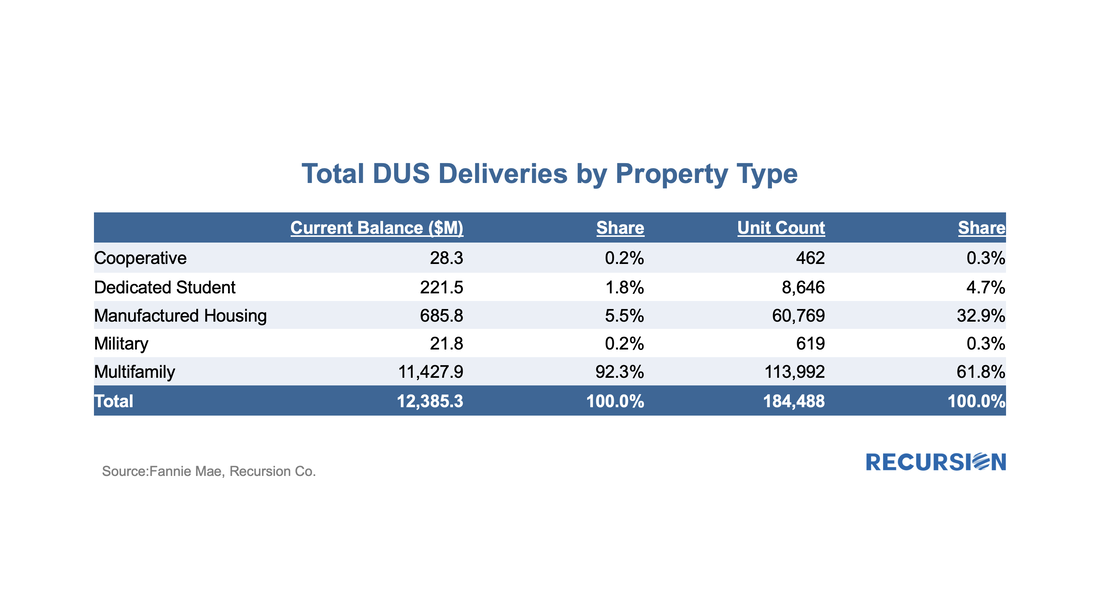
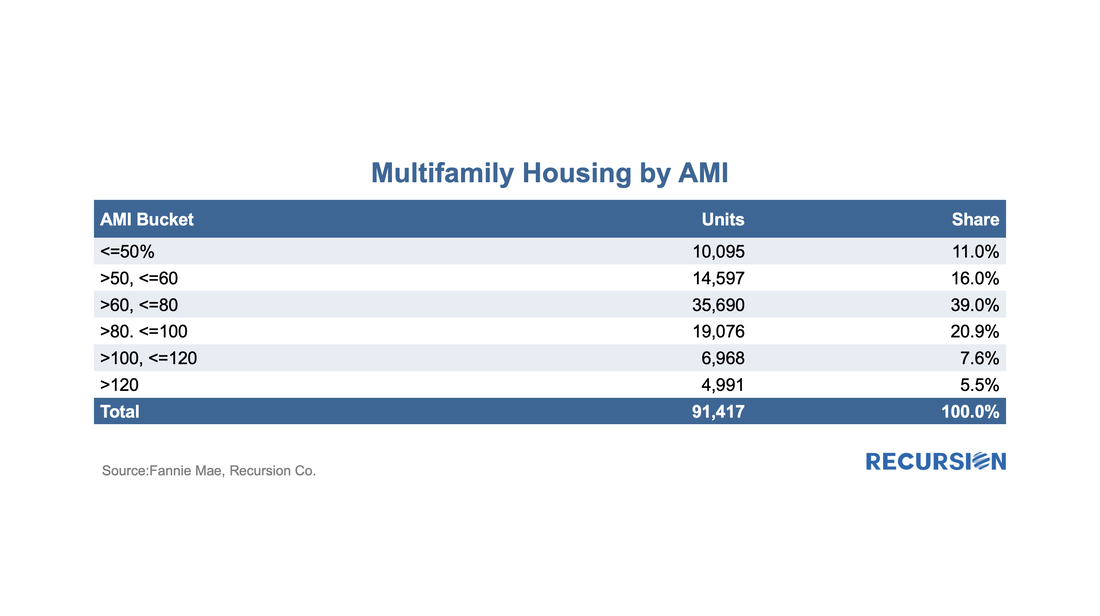
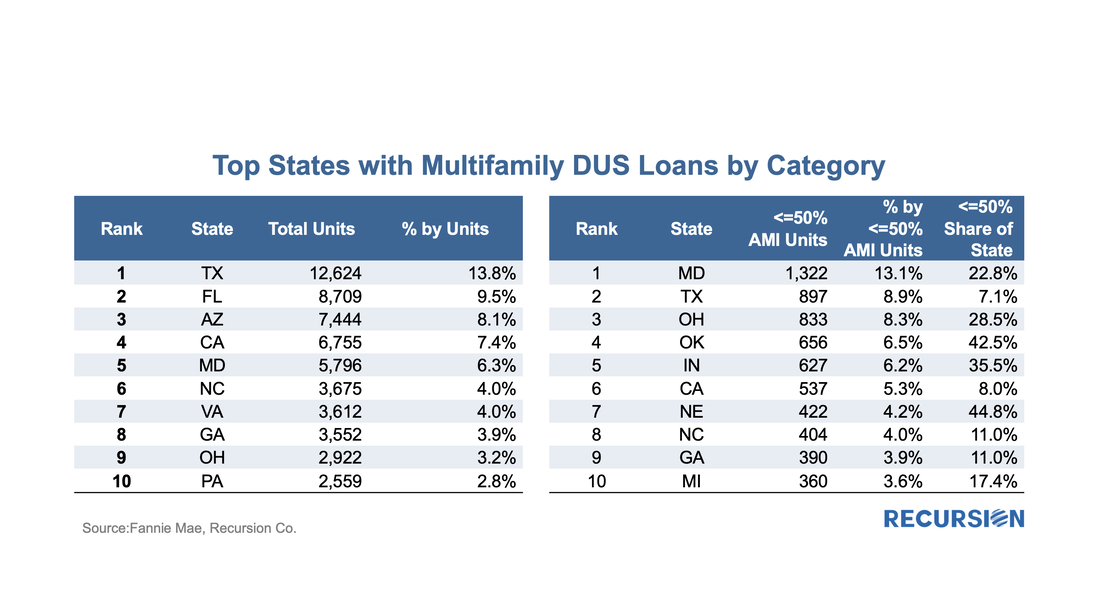
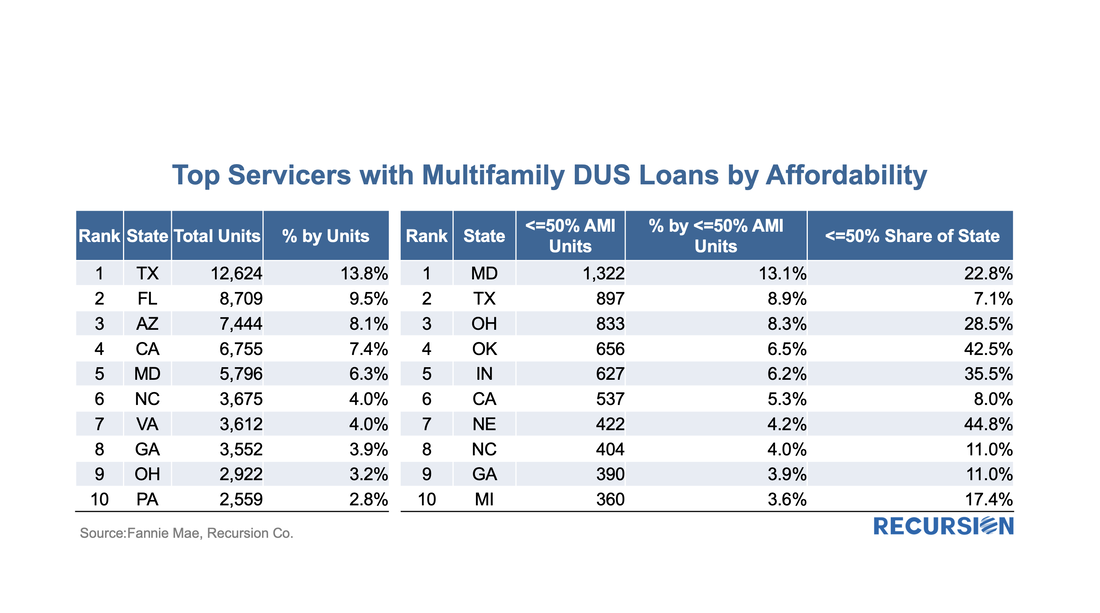
In early May, Fannie Mae announced that its disclosures for its multifamily DUS program to include expanded social information, notably Area Median Income (AMI), went live[1]. With the June release, we now have data for two months, a summary of which is found below: To begin, we look at the big picture of new loans issued within the DUS program for May and June combined. (All data will be presented this way unless otherwise specified.) From a housing policy perspective, we are primarily focused on Manufactured Housing(MH) and Multifamily. Such data for MH is hard to collect. As Multi-Family is 92.3% of all deliveries, it is not too much of a concern in terms of coverage right now. Let’s set aside MH for now and focus on Multifamily, under which Fannie Mae now discloses AMI data for 91,417 out of the total 113,992 units delivered. (The others are marked “N/A” in this field). There are many ways to slice and dice this data. For our purposes here, let’s look at loans that fall into the lowest income category, with income <=50% AMI, as this is an area of much focus for policymakers and ESG investors. We’ll break it down two ways, first by geography at the state level and then by servicer. The left-hand side of the table provides the number and share of DUS Multifamily units by state. On the right-hand side, the column headed by the label “<=50% AMI Units” provides a similar ranking based on the number of units in that income category. The data under the column “<=50% Share of State” contains the share of units in that category issued in the DUS program in May and June as a share of all the DUS MF loans issued in the state during that period. For example, the top state in terms of the number of units in the <=50% AMI category is Maryland. Those 1,322 units comprise 13.1% of the national total in that bucket, and 22.8% of all DUS MF units in that period. There are a wide variety of data distributions on display here. For example, the number one state for DUS issuance overall is Texas. It is the number two state in the <=50% category, but the 897 loans comprise just 7.1% of the total number of DUS MF units delivered in May and June. At the other extreme, Nebraska is the number seven provider of <=50% AMI units, but these 422 represent 44.8% of all DUS MF deliveries in that state. Finally, we look at loan servicers, which are typically also the originators for DUS program. The structure of the table is parallel to that of states. Walker & Dunlop serviced 22.7% of the units from all loans delivered in May and June through the DUS MF program. They ranked number three in units with renters’ income<=50% AMI, and these accounted for 4.5% of all loans serviced by that firm. There is a broad range of corporate strategies displayed here. For example, PGIM Real Estate Agency Financing LLC was number 5 in the rankings for the number of units with income <=50% AMI, and this was over one third of their overall new business in those two months. This analysis barely scratches the surface of what can be discovered from these new disclosures. Moreover, there is new data being released all the time. The increased policy focus on social issues is increasingly evident throughout the space of residential mortgage finance. |
Archives
February 2024
Tags
All
|
RECURSION |
|
Copyright © 2022 Recursion, Co. All rights reserved.


 RSS Feed
