|
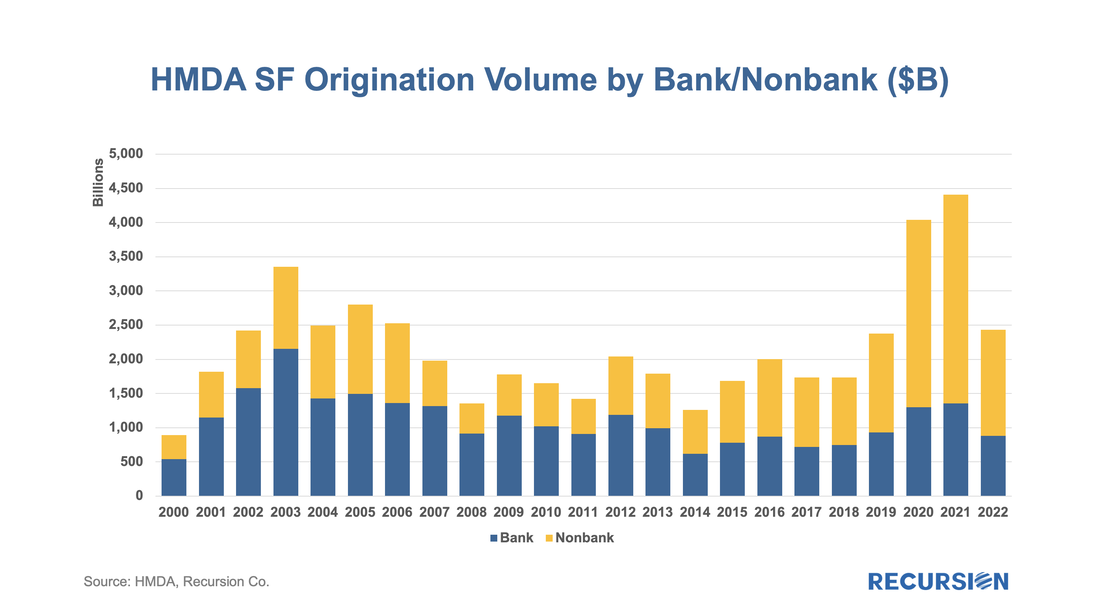
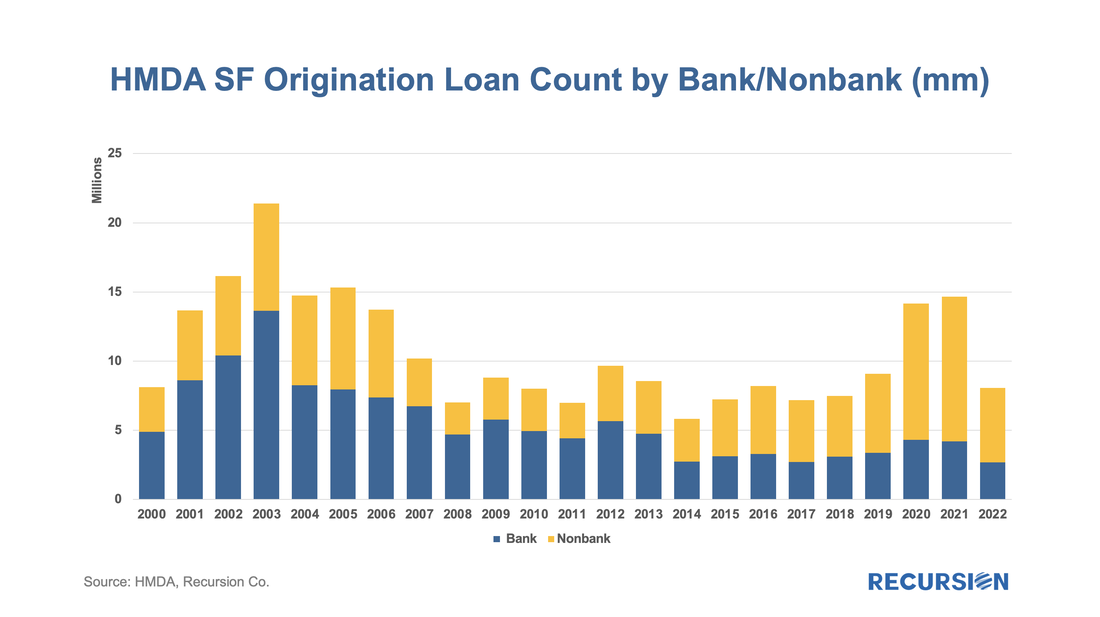
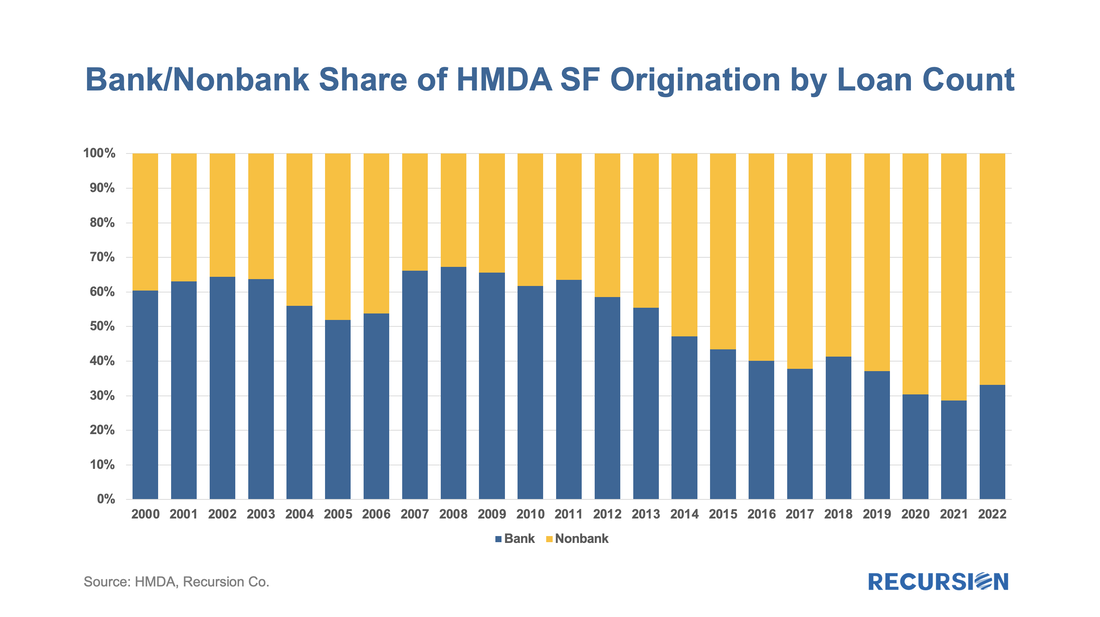
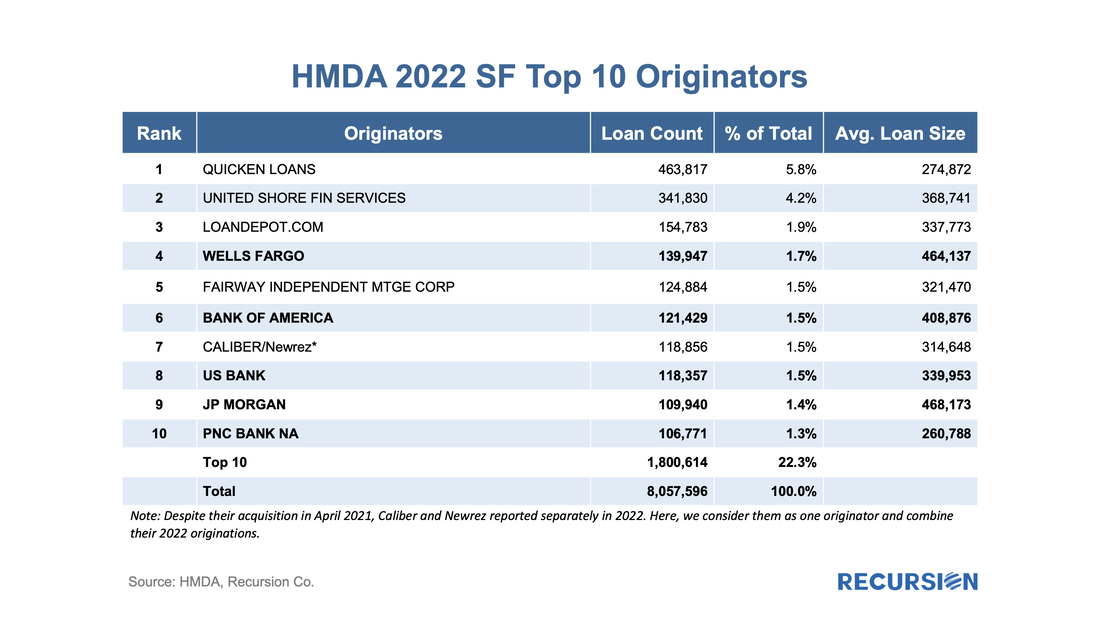
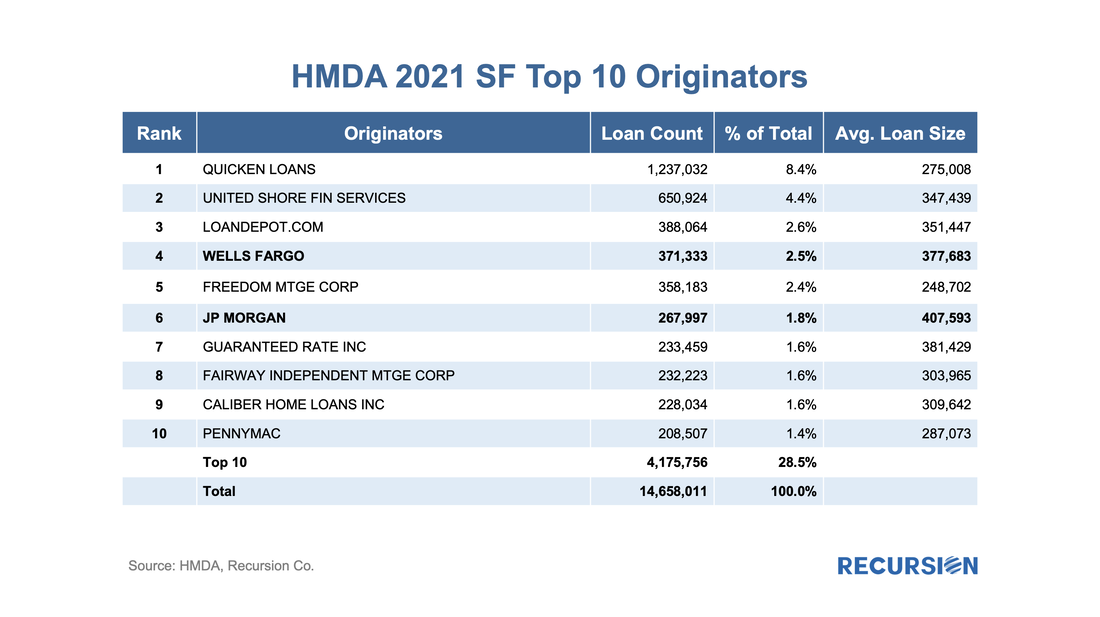
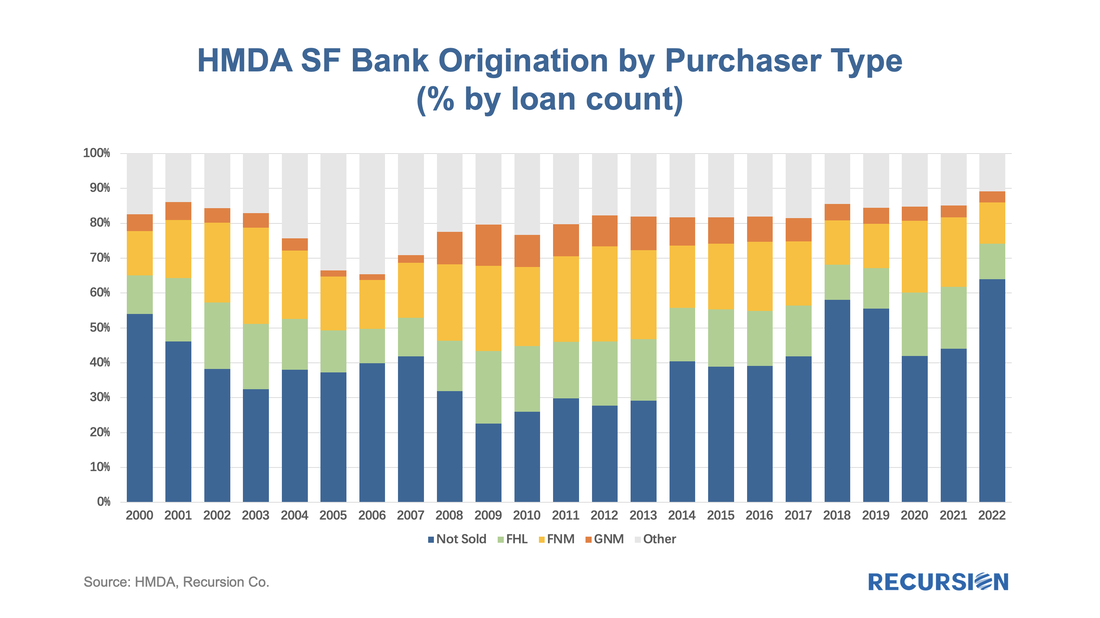
The cherry blossoms are blooming, which means it’s time for the HMDA preliminary data set to be released. The dataset provides a social underpinning to the nation’s mortgage market and enhances our understanding of the behavior of borrowers and lenders. The 2022 dataset has been particularly eagerly awaited, as we get our view on the new world of high inflation and mortgage rates for the first time in decades. We start with origination volumes and get not just confirmation of the onset of mortgage winter, but some breakdown of its characteristics. By a dollar measure, originations plunged by 45% to $2.43 trillion in 2022, although this brought us back to just 2% above the pre-covid level of $2.38 trillion in 2019. Some adjustment must be made, however, to adjust for the fact that a key characteristic of the Covid-19 period was an unprecedented surge in house prices and mortgage sizes. Looking at this chart in terms of loan count provides a more “realistic” view of originations. Interestingly, the origination loan count of 8.06 million in 2022 was 45.0% below that of 2021, very close to the change obtained by looking at dollar volumes but was 11.4% below the 2019 count of 9.1 million. The first nuance is to look at the bank/nonbank share. Here we will focus on loan count, and note up front that the bank loan count of 2.68 million loans in 2022 was the lowest recorded in the 21st century. However, this observation covers over the fact that while bank origination fell by 36.2% last year, nonbanks suffered a significantly larger decline of 48.6%. 2022 marked only the third time in the past 14 years that the bank share of originations rose by loan count. It seems that our monoline thinly capitalized nonbanks struggled more with the onset of mortgage winter than depository institutions. We can look at this distress by focusing on the changes in the market structure at the originator level between 2021 and 2022: There is a lot to chew on here. First, the market became somewhat less concentrated last year, with the top 10 originators accounting for 22.3% of the total loan count, down from 28.5% in 2021. Over 40% of that decline came from just Quicken alone, which, while maintaining its top position, was not as dominant in 2022 as in the prior year. The number of banks in the top 10 grew from two to five, and the bank share of the top 10 loan count alone more than doubled from 15.3% in 2021 to 33.1% last year. A final “headline” from the data is loan disposition for banks: The main takeaway is the surge in the share of loans held on book from 44.0% to 63.9% in 2022, which is the high reached over the past 22 years. This appears to be associated with an unwind of the situation in 2020 and 2021, where banks were cautious about holding onto whole loans during the period of peak concern over Covid and preferred to hold MBS instead.
Analytics on HMDA data is never easier as Recursion put the big data behind our GUI based HMDA Analyzer within days after the preliminary release. Much more to come. |
Archives
February 2024
Tags
All
|
RECURSION |
|
Copyright © 2022 Recursion, Co. All rights reserved.

 RSS Feed
