|
On December 15, 2023, the Financial Stability Oversight Counsel (FSOC) released its 2023 Annual Report. According to the Report: “The Council was established by the Dodd-Frank Act of 2010 and was charged with the collective responsibility to monitor and promote US financial stability. This annual report summarizes the Council’s assessment of current vulnerabilities across a variety of asset classes, institutions, activities and developments, and the 2023 activities of the Council and member agencies to reduce and respond to risks and lessen vulnerabilities facing the financial system.” In its discussion of the primary mortgage market, the Council states “High interest rates coupled with low inventory for sale led to fewer home sales and origination volume. (see figure 3.1.2.3) 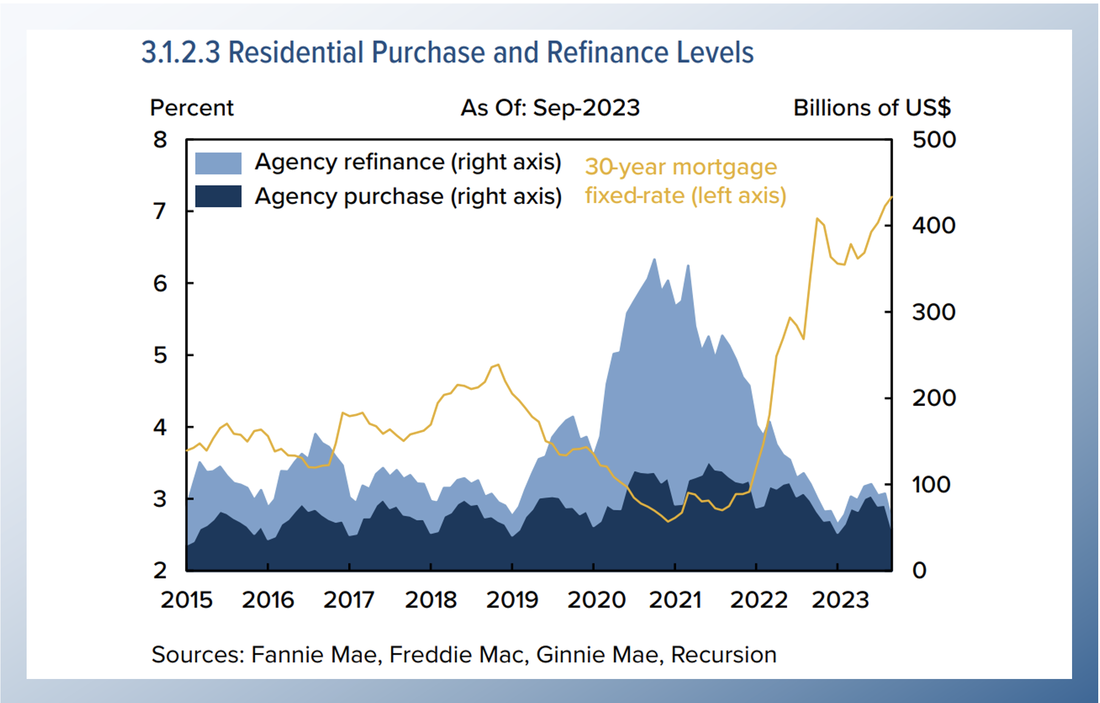 Recursion is pleased to be acknowledged by FSOC as a source for trusted data and analytical expertise.
The year 2023 was remarkable in many ways, but a key characteristic was the resilience of the economy and labor markets to high and rising interest rates. At the start of the year, the consensus forecast called for sharply slower growth and rising unemployment. In reality, growth accelerated, and unemployment remained near historic lows. This has left analysts in a state of chaos regarding the outlook for 2024[1]. We leave forecasting to others, pausing to note that we find a high correlation between the confidence of forecasters, and forecast error. Instead, we pose a hypothetical question. What if the economy slows down and even experiences a modest recession? What would that mean for borrowers, particularly for those in low-income households? Our core Agency disclosure data is of somewhat limited usefulness here as we do not have borrower income as a disclosed characteristic. However, we can break the universe up by Agency, notably comparing FHA to conforming loans, as we know FHA borrowers are lower-income borrowers, as demonstrated by 2022 HMDA data: 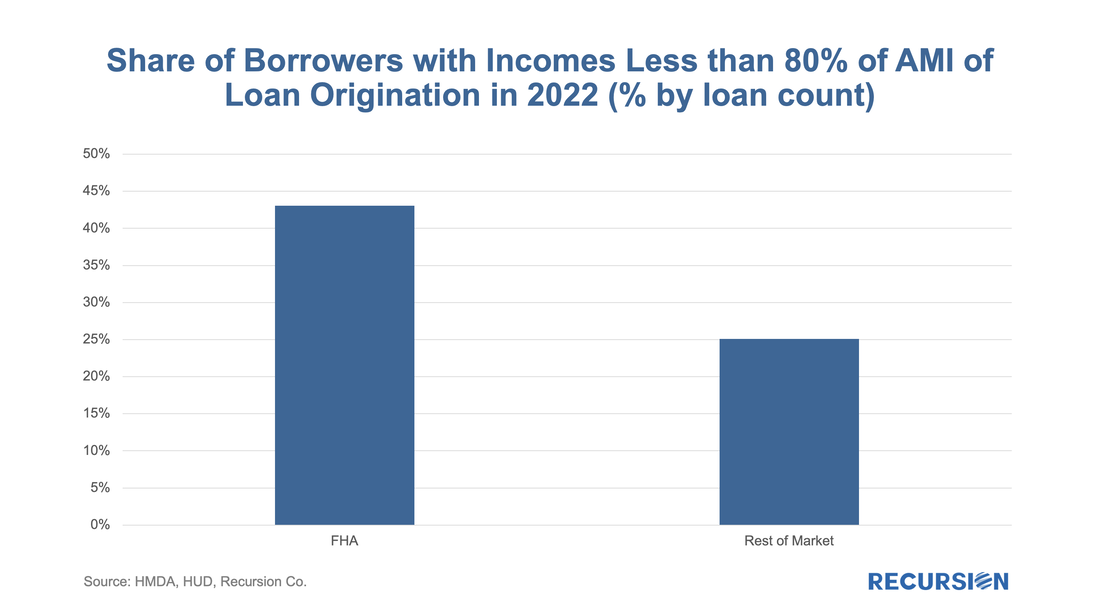 The distinction reported here allows us to perform a natural experiment whereby we compare the performance of FHA loans to those of other programs, in this case, the GSEs. To accomplish this, we look at the SDQ (90D+) rate for FHA and GSE loans vs a key fundamental: continuing jobless claims: 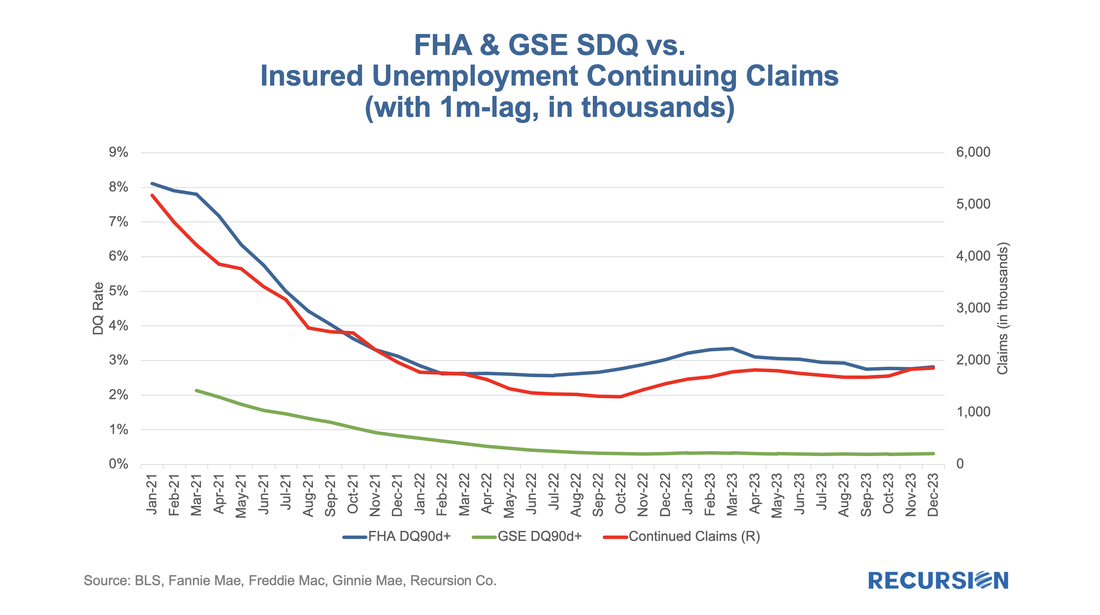 Both FHA and conforming loans are sensitive to the state of the labor market, but the connection is much tighter for low-income FHA borrowers. It seems reasonable to think that the same relationship would hold should the labor market deteriorate, and continuing claims rise. But there is more. FHA, in recent years, has implemented programs for highly vulnerable borrowers to keep them in their homes. The first of these is “reperforming mortgages,” where borrowers who have fallen behind on their payments after leaving forbearance but have subsequently made payments for six consecutive months may take the missed payments as a “partial claim” due when the mortgage is extinguished[2]. This has superior credit considerations for the borrower compared with a modification. When the program was launched in January 2021 these loans could only be securitized in new “RG pools”. Since February 2023, the seasoning repooling requirement was shortened to three months from six months, and these loans are eligible for issuance in Ginnie Mae multi-issuer pools[3]. Another program is “Extended Term Mortgages”. These are loans with a modification that extends their maturity to at least 361 months and not more than 480 months. This program was launched in February 2023, and these loans are securitized only into “ET pools”. It is natural to ask about the performance of these categories of loans as they relate to particularly vulnerable borrowers. While these are not particularly large programs, it’s interesting to note that the share of RG loans out of total outstandings peaked earlier this year while the ET share continued to rise. 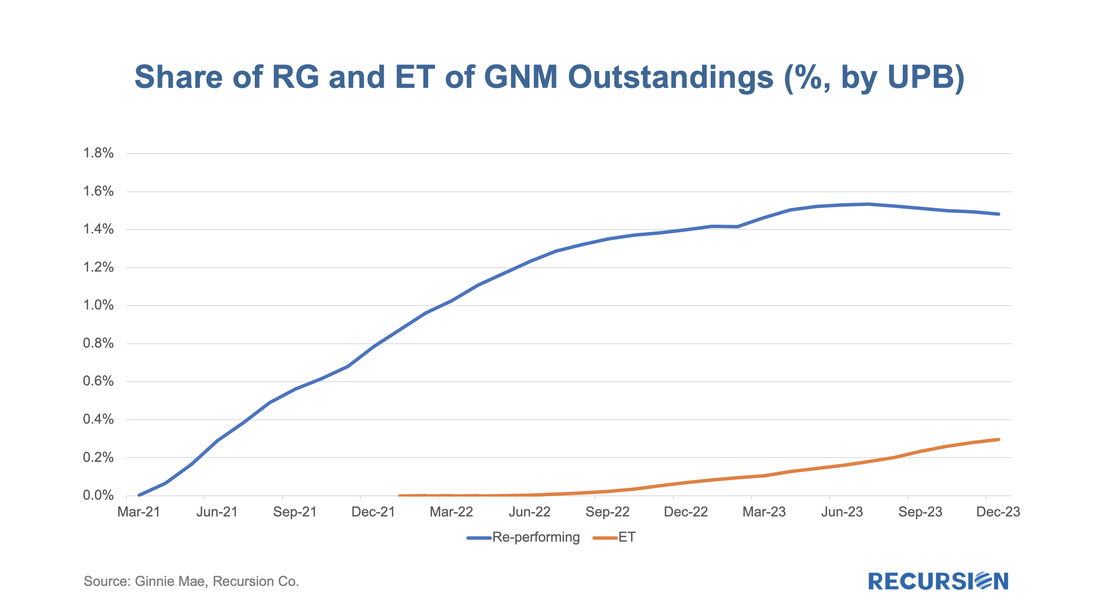 And below find the performance statistics for these categories of loans: 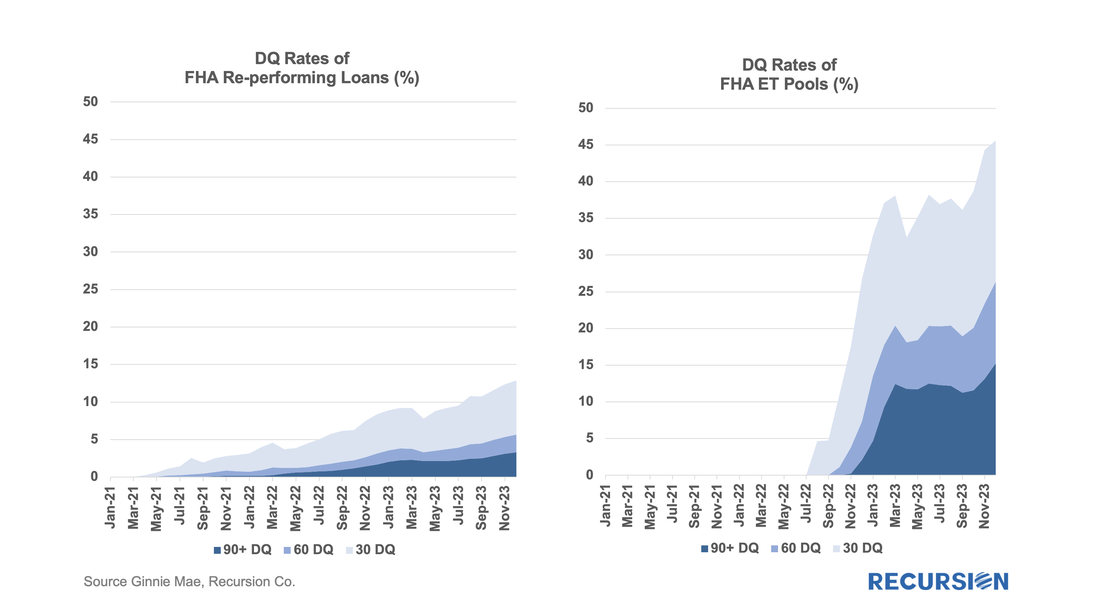 The DQs for the RG loans are modestly higher than those for the overall FHA program, while those for the ET pools are dramatically higher. Given the current strong state of the economy, we conclude that there are market segments that will experience distress should labor market conditions become less tight. Many questions remain. First, we have the issue of the performance of RG loans by pool type since these can now be securitized into either RG or GNM multi-issuer pools. Interestingly, over the last nine months, the split has grown from just over 50/50 multis/RG pools to about 68/32. 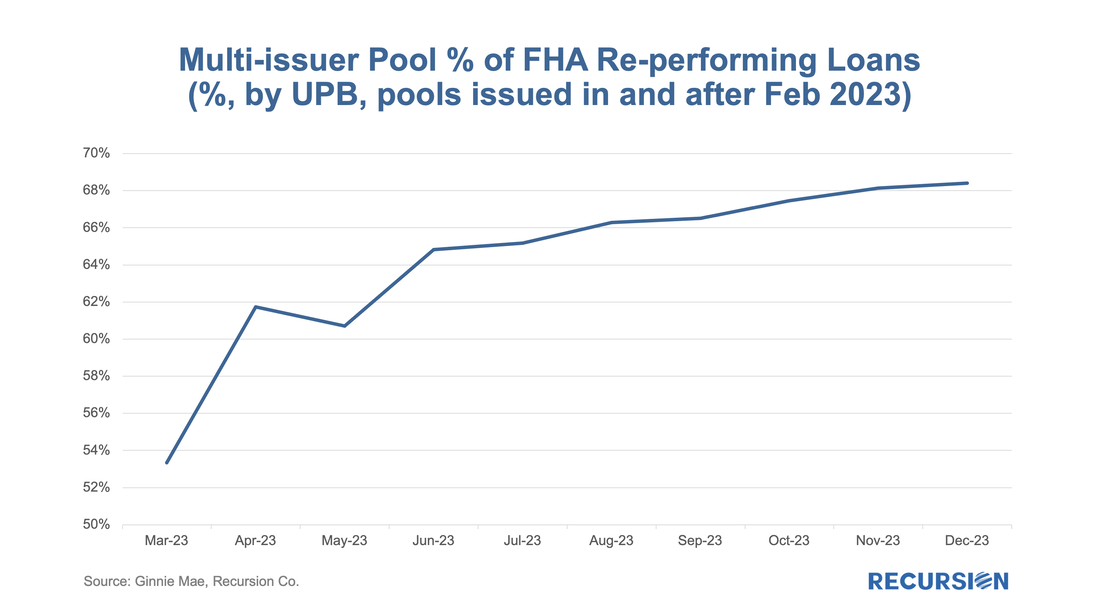 Here are the performance statistics for each type: 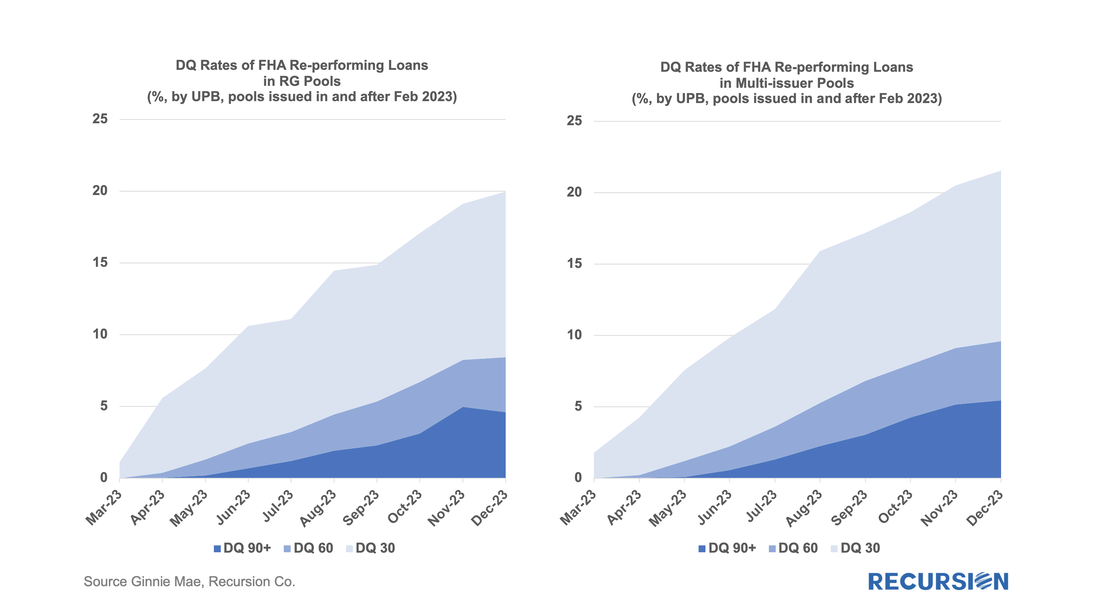 It is noticed that DQs for loans distributed to multi-issuer pools have recently been performing somewhat worse than those in RG pools. There is a temptation to think that the loans in multi-issuer pools can only be tracked at the loan level with advanced data technologies. A natural question would be whether issuers have different strategies for allocating re-performance mortgages in RG prefix pools or multi-issuer pools. And then there is the issue of the large spike in DQs for ET pools. Again, further work on the issuer level will shed light on the driver of the deteriorating performance. The single-family agency MBS market benefits from a set of consistent standards that allows traders and analysts to make straightforward judgments about relative value between securities. This is particularly the case for the conforming mortgage market since the single security UMBS market was launched in June 2019. The result is a market that is very liquid, supporting homeownership and affordability. There is a very different situation in the multifamily space. The programs are very distinct across, and even within Agencies. This is particularly the case for the Ginnie Mae program, which consists of construction loans that are lines of credit that are drawn upon, and then converted to project loans. The two largest programs within the GSE multifamily space are the Fannie Mae DUS program[1], where losses are shared between Fannie Mae and the underwriting banks, and the Freddie K-deals, where losses are shared with investors[2]. Both Agencies have numerous smaller programs as well with their own distinct characteristics. In the single-family space, the unit of analysis is the mortgage. These are pooled, and pools and loans are sometimes, in turn, aggregated into CMOs (We classify highly-structured deals such as Freddie K, Q, ML, SB, etc., as CMOs, too). Investors have a complete picture of activity in this market. In the multifamily space, however, the picture is murkier. There are two reasons for this. First is the multitude of different programs across the Agencies as cited above. The second is that a consistent data set for multifamily loans across the three agencies is not easily produced, as loans are typically securitized into pools, however, Freddie tends to securitize loans directly into structures more like CMOs, such as Freddie K, Q, SBL programs[3]. A year ago, we posted a note that described our bottom-up approach to sizing the multifamily market and validated this by comparing our calculation to similar figures obtained from the Federal Reserve Z.1 report. We are pleased to report that this approach continues to provide an accurate picture of total market size as our figures for the third quarter have consistently aligned within a margin of 0.5% for the past three years. 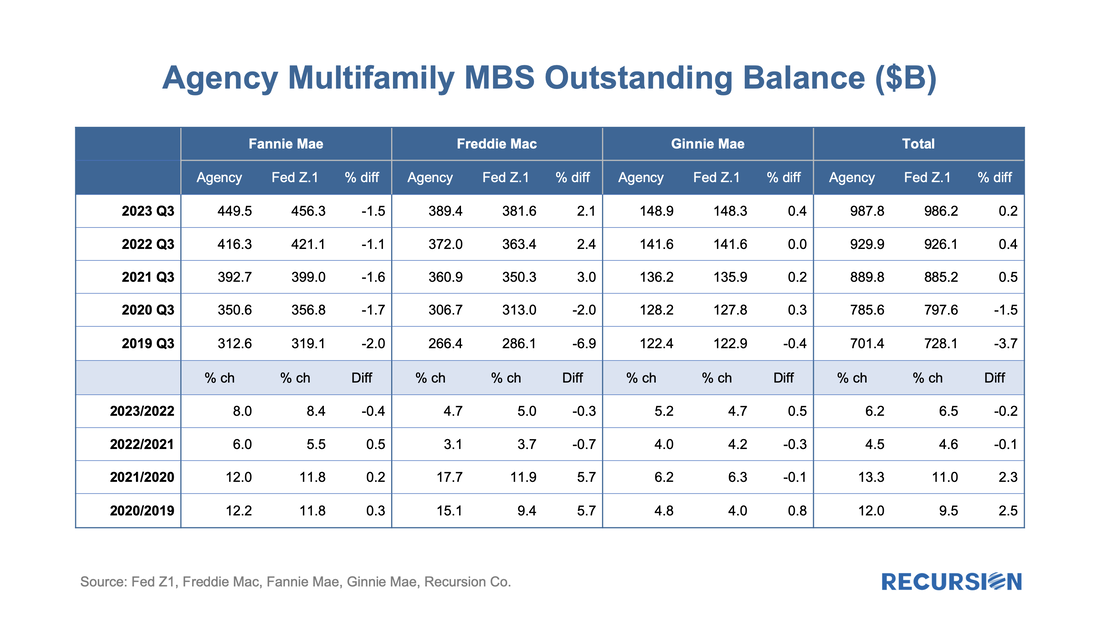 Recursion Data Cited in Washington Post Article Regarding Potential Impact of New Bank Rules12/7/2023
Recursion data was cited in an article published on December 7 in the Washington Post “The racial homeownership gap is widening. New rules might make it worse. ” The article states that more stringent capital requirements facing banks will make mortgages more expensive for cash-poor borrowers, which tend to disproportionately impact minority households. The article goes on to say that non-bank lenders not subject to these rules have stepped in to provide mortgages as banks have reduced their presence in the market. “In 2014, four of the top five mortgage lenders were banks; in 2022, only Wells Fargo remained in the group, according to the mortgage data analysis firm Recursion.” Recursion is pleased to provide accurate and timely data to inform the public debate on these important issues.  Some months ago, we set off to assess the impact of high interest rates on the usage of appraisal waivers. It soon became clear that we first needed to look in some detail at recent developments in the structure of the new market for appraisal modernization[1]. In this piece, we return to the original question. To begin we look at the landscape of loan deliveries for Freddie Mac and Fannie Mae across the suite of available approaches towards appraising property values. Below find such charts for purchase mortgages. 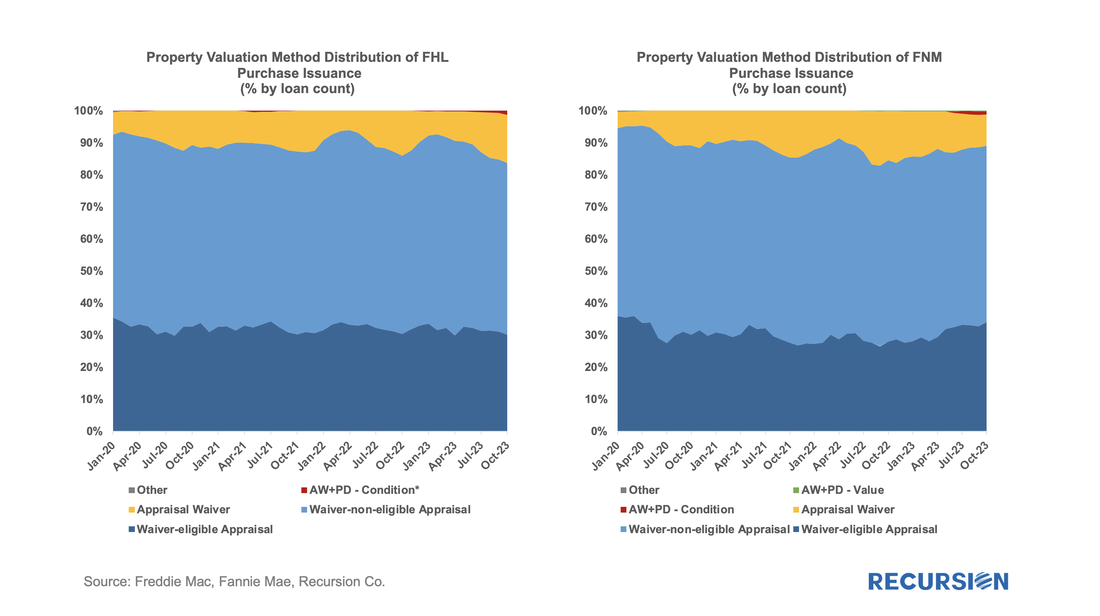 The recent release of pool-level buydown data led us to write a note contrasting the use of this product across Agencies, including Ginnie Mae[1]. In the process of writing this, we discovered that FHA, unlike the GSEs, also provides loan-level data for buydowns. This allowed us to run an analysis showing loan performance as measured by EPDs was better for FHA loans with buydowns than without, reflecting increased lender caution in using buydowns, which, on average, had higher credit scores than those without. The availability of loan-level data for FHA on this topic provides us with an opportunity to conduct an additional informative analysis specific to this program, which we document here. To start, let’s look at the share of the market with buydowns: 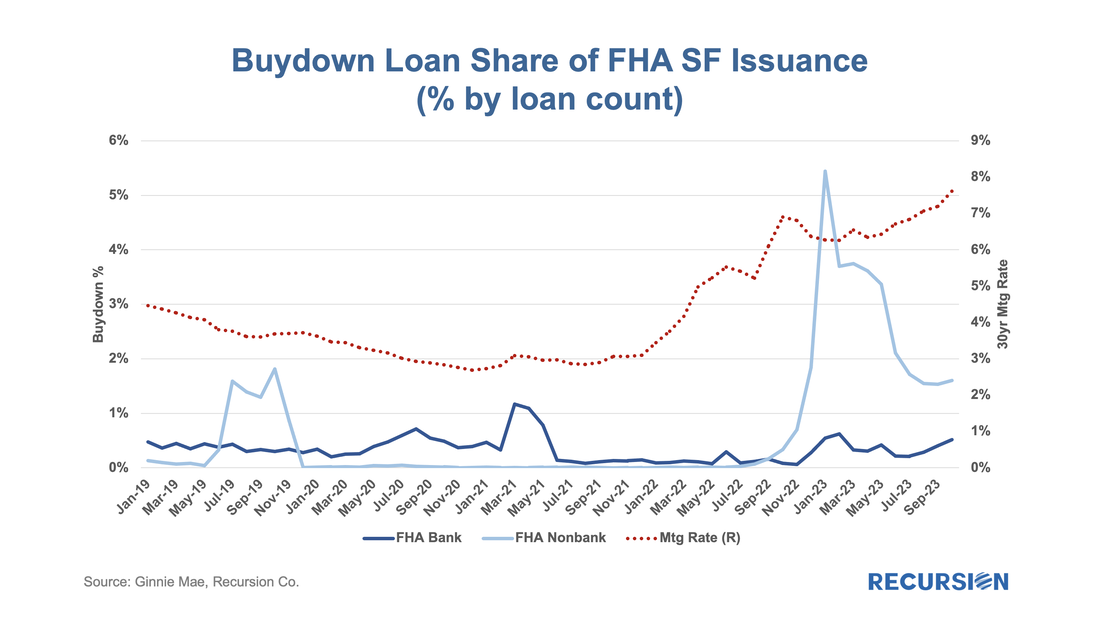 ...... 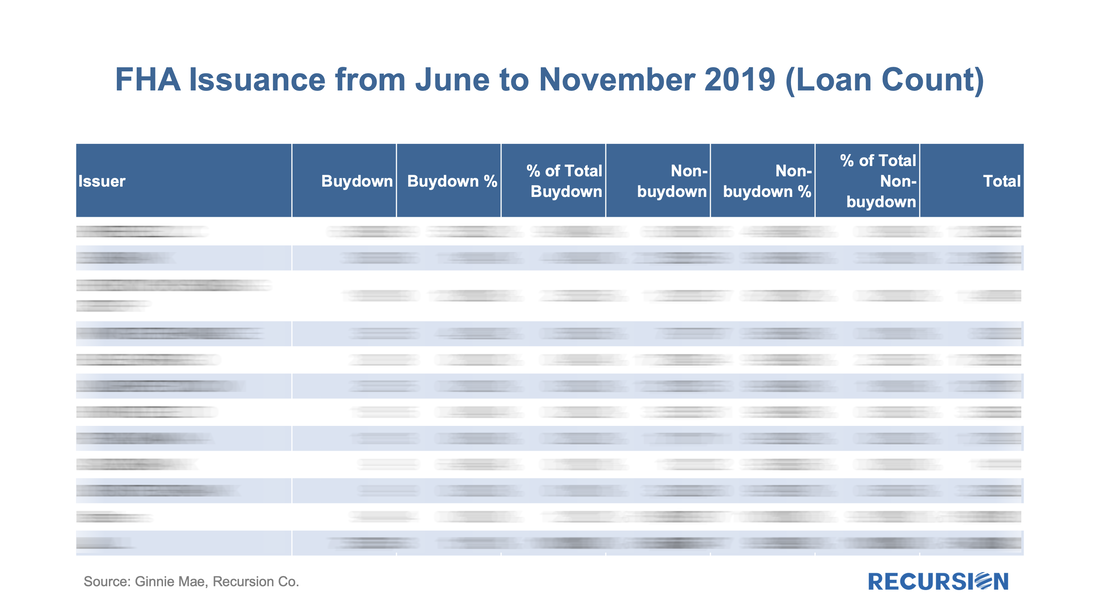 ...... 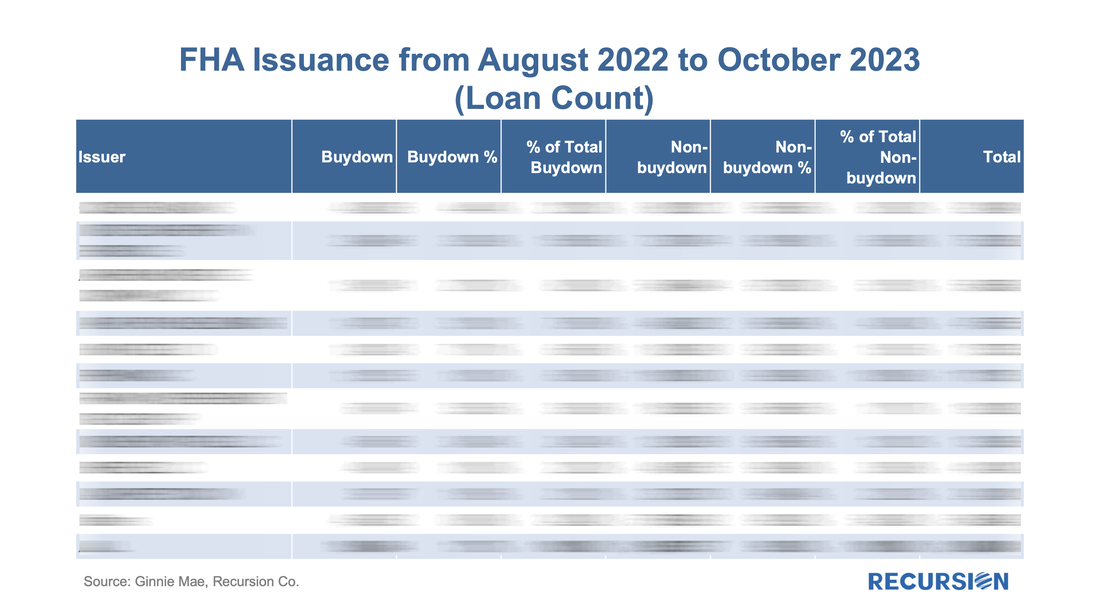 ...... 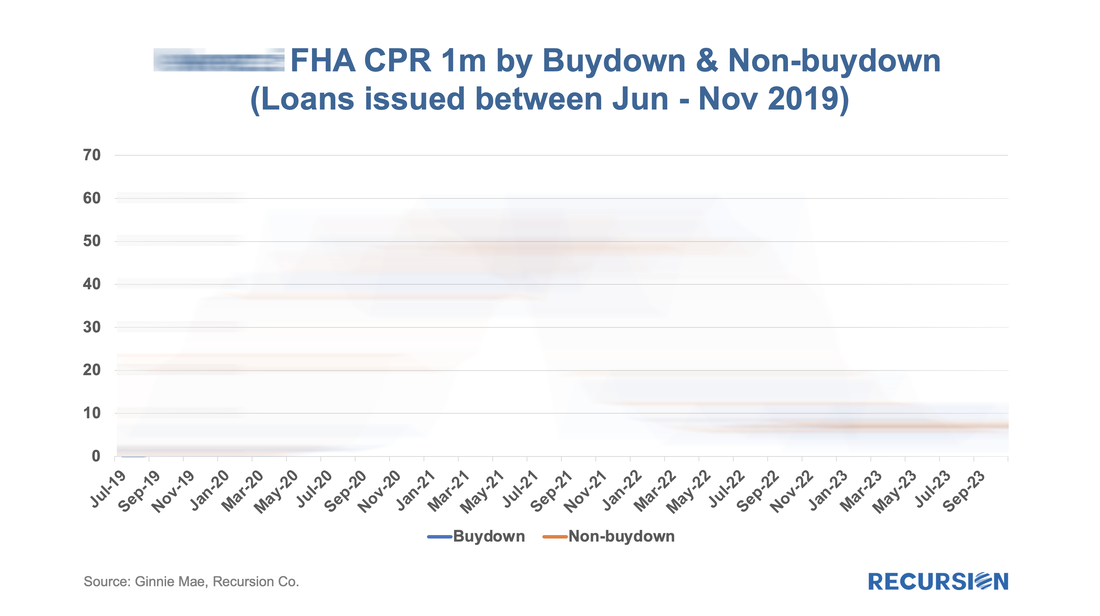 To read the full article, please send an email to inquiry@recursionco.com One of the key changes that has been underway in the policy environment over the last decade or so is the linking of economic and foreign policies. Trade policies in the form of tariffs or product bans have increasingly become part of the foreign policy toolkit. The most extreme case, of course, is the sanctions placed on Russia’s dollar assets by the US government following the invasion of Ukraine[1]. It’s natural to wonder if these developments could lead to changes in the foreign appetite for US financial assets. Recently, these concerns rose following reports of three consecutive months of declines in US Treasuries[2]. These are complex issues that matter to investors in US assets, so it’s worth looking into. Our Macro Analyzer provides a view into the main source of international financial flows, the Treasury International Capital (TIC) System[3]. Indeed, the data show sales of Treasury securities of almost $15 billion out of China in August, the biggest such figure since January 2022: 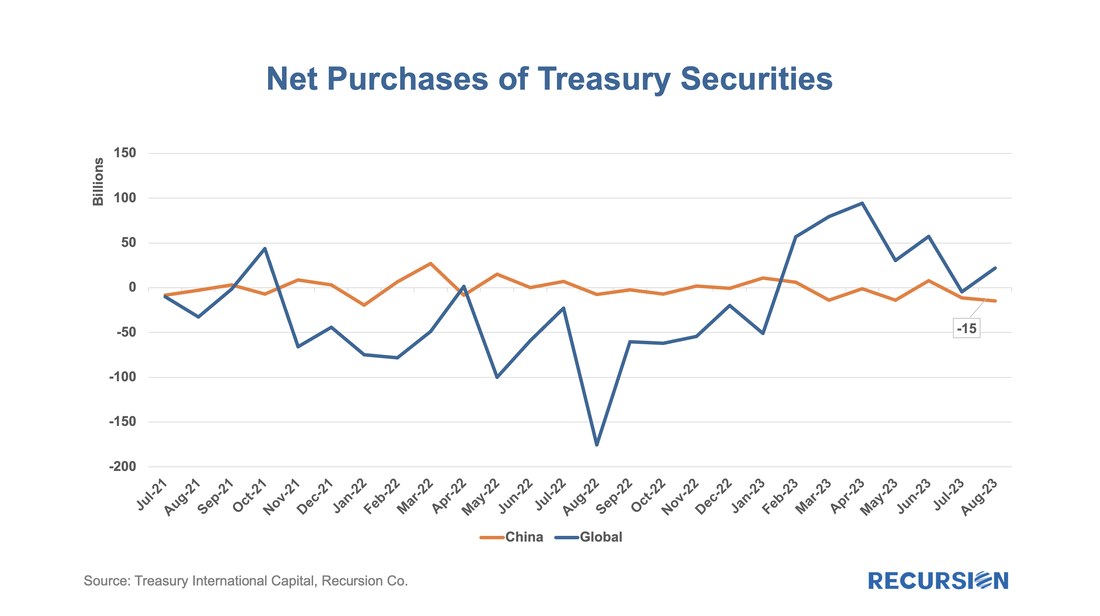 With home prices at record high levels and mortgage rates at their record highs since the turn of this century, it’s natural to ask if the housing market will be the source of new systemic risk. Over the past year, we have written extensively about “mortgage winter”, a condition where housing demand is held back because of affordability, while at the same time, supply is constrained by current homeowners who are locked into properties by mortgages with rates far below those available in the prevailing market. This is what economists would call a “bad equilibrium”, a state of great strains in the market that tends to persist. While the housing finance industry is under great duress, the spillover to the broader economy remains limited, as for example, the labor market has held up well despite soaring borrowing costs. Within housing, the notable good economic news is that the extraordinary surge in house prices in the wake of the Covid-19 pandemic has resulted in an astounding 50% surge in the value of homeowner’s equity in real estate since Q1 2020 to over $30 trillion. 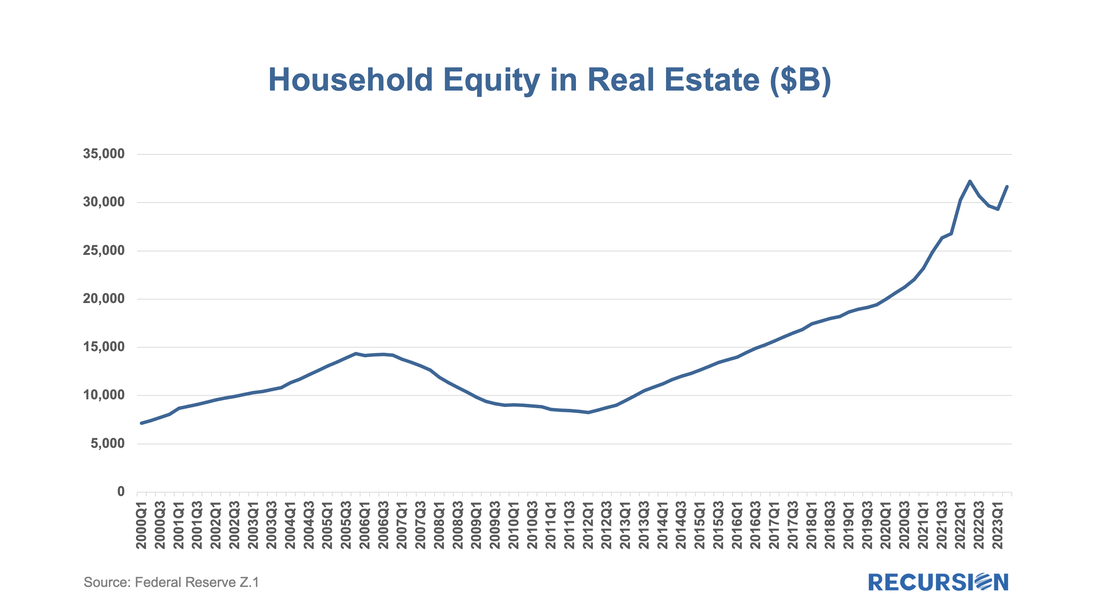 |
Archives
February 2024
Tags
All
|
 RSS Feed
RECURSION |
|

Copyright © 2022 Recursion, Co. All rights reserved.