|
On February 16 Commercial Mortgage Alert published an article entitled “Fannie Focusing on Affordable Market”. In this article, they stated that “Fannie purchased $4.04 billion of multifamily mortgages in January, according to data from Recursion Co.”  They go on to mention that “Of the loans Fannie purchased last month, 81% of the units financed were affordable to renters earning no more than 80% of area median income. Over the last couple of years, that figure generally has ranged from 70% to 75% of units financed, according to Recursion.”  We are proud that our data is widely cited in issues of importance to the housing policy and finance communities.
Please reach out to inquiry@recursionco.com if you would like a copy of the article On November 30, 2023, the Veterans Administration (VA) announced a new home retention program called the VA Servicing Purchase (VASP) program as an option for borrowers who cannot be assisted through other home retention options[1]. As the program will not be rolled out until March 2024, VA has strongly encouraged a foreclosure moratorium on all VA-guaranteed loans through May 31, 2024. Under this program, VA will exercise its statutory option to purchase the loan from the servicer and VA will hold the loan in VA's own loan portfolio[2]. The servicer will prepare a modification of the loan to increase affordability for the Veteran. As the vast majority of VA mortgages are securitized in Ginnie Mae pools, let’s first take a look at the outstanding balance and loan count of VA loans using data disclosed by Ginnie Mae: 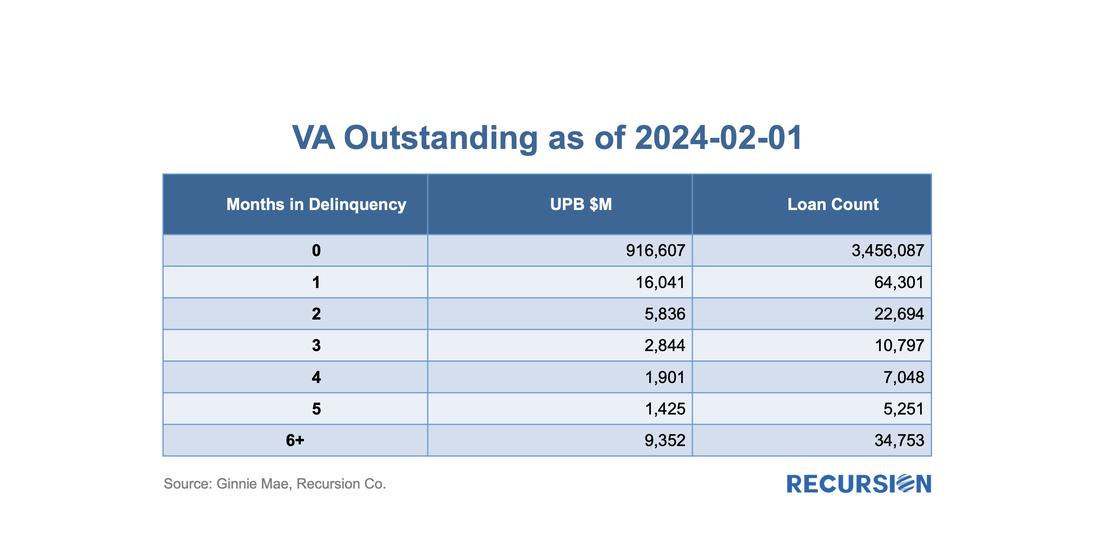 In Mortgage Winter, affordability is job one for housing policy. In our most recent quarterly macro report, we noted that the share of loans with buydowns posted significant increases across all three agencies in the second half of 2023[1]. To see how widespread these sorts of supportive actions are, we look at down payment assistance (DPA) programs. To start, the GSEs only allow downpayment assistance through specified second lien programs: “Community Seconds” for Fannie Mae[2] and “Affordable Seconds” for Freddie Mac[3]. While there are technical differences between programs, they are second liens funded by an approved list of government agencies, nonprofits, and private sector lenders. The liens are subordinate to the first mortgage and face various limits on combined LTV (CLTV) and note rates. These liens are neither securitized by the Enterprises nor directly reported in the data disclosures. However, we could identify those (we call it “piggyback”) by looking for loans with the original combined LTV higher than its original LTV. Below find the number of owner-occupied loans containing “piggyback” liens for the HFA programs, the low-income programs (FNM “Home Ready” and FHL “Home Possible”), and other[4]: 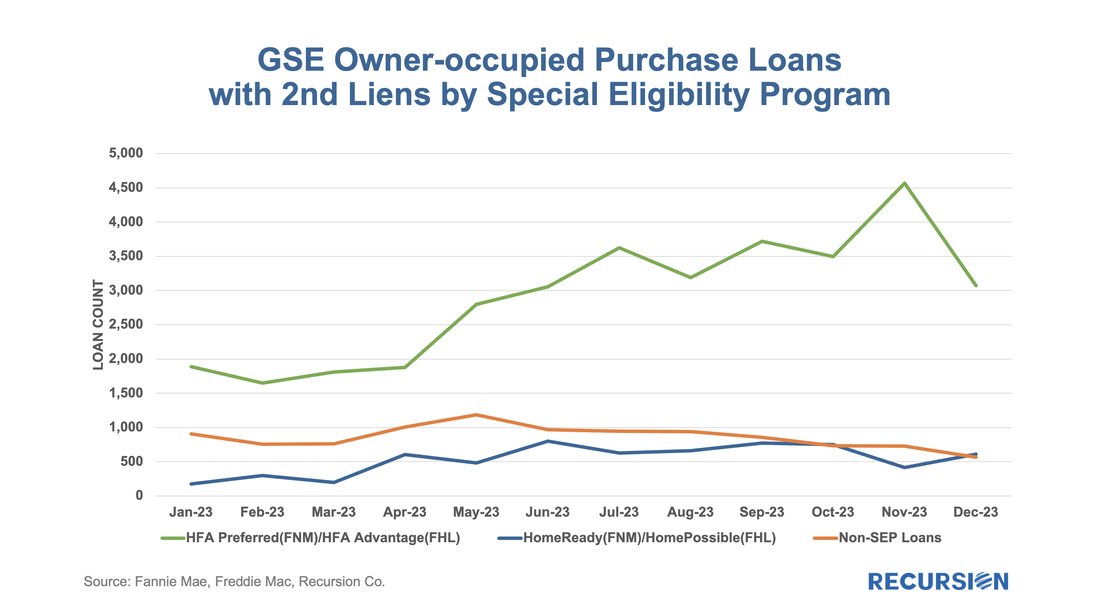 In a recent post, we noted that delinquency rates for two classes of FHA modified loans were rising faster than for the general population, namely reperforming (RG) and extended term (ET) loans[1]. In this post, we dig down into details to get a closer view of the behavior of lenders in these categories. We start with RG loans. As noted in the previous blog, the program was launched in January 2021, allowing borrowers who had outstanding unpaid balances from the Covid period but six consecutive months of payments to roll the balances into a “partial claim” due when the loan is extinguished. At that time, a new “RG” custom pool category was formed to issue these mortgages. Starting in February 2023, the seasoning period was reduced from six to three months and these loans became eligible to be issued in Ginnie Mae multi-issuer pools. The share of these loans in multi-issuer pools reached over 2/3 at the end of 2023. Delinquency rates are modestly higher for RG loans in multi-issuer pools relative to RG pools even though they are relatively new. One topic that comes up is which servicers are most involved in this loan type and how much variation in behavior can be seen across these institutions. Below find the list of the top 15 institutions issuing RG loans and the distribution of each by pool type 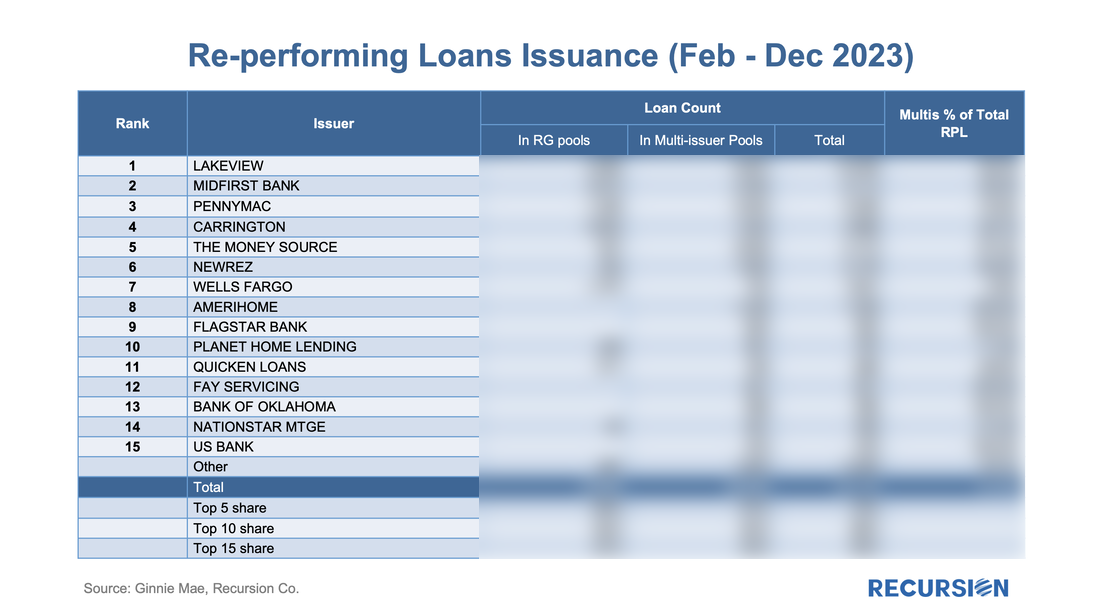 This is the third and (for now) final entry in our series of posts regarding appraisal modernization. The first describes the framework of data disclosures provided by the GSEs[1], while the second looks at differences in usage of the various programs between Fannie Mae and Freddie Mac and between banks and nonbanks[2]. In this note, we look at loan prepayment performance and the drivers behind it. Here we see 1-month CPRs and loan rates for purchase loans issued in 2023 with waivers and those eligible for waivers but did not obtain one: 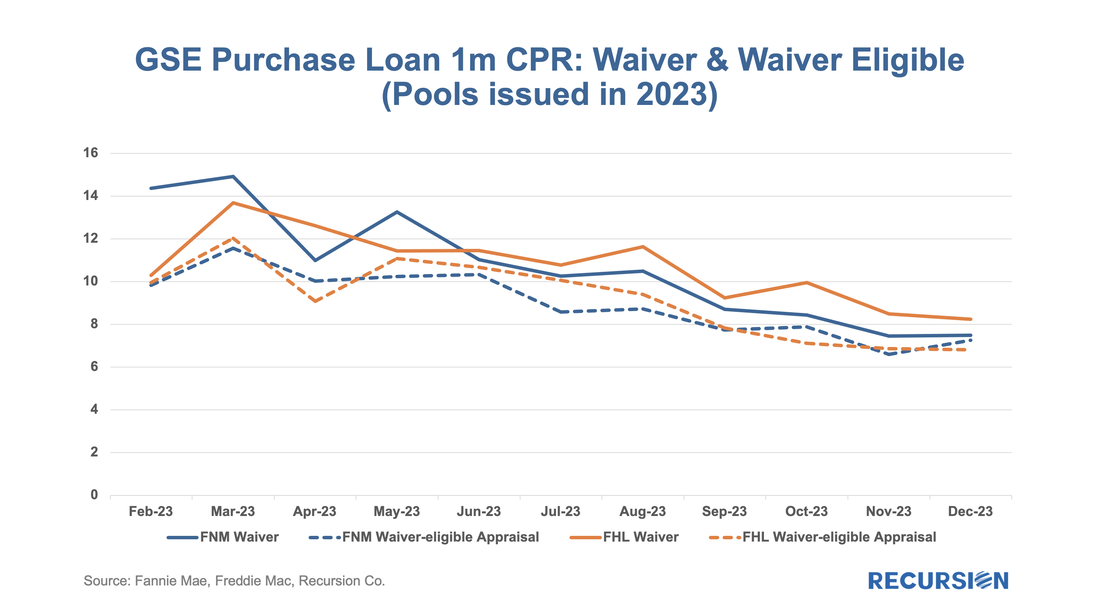 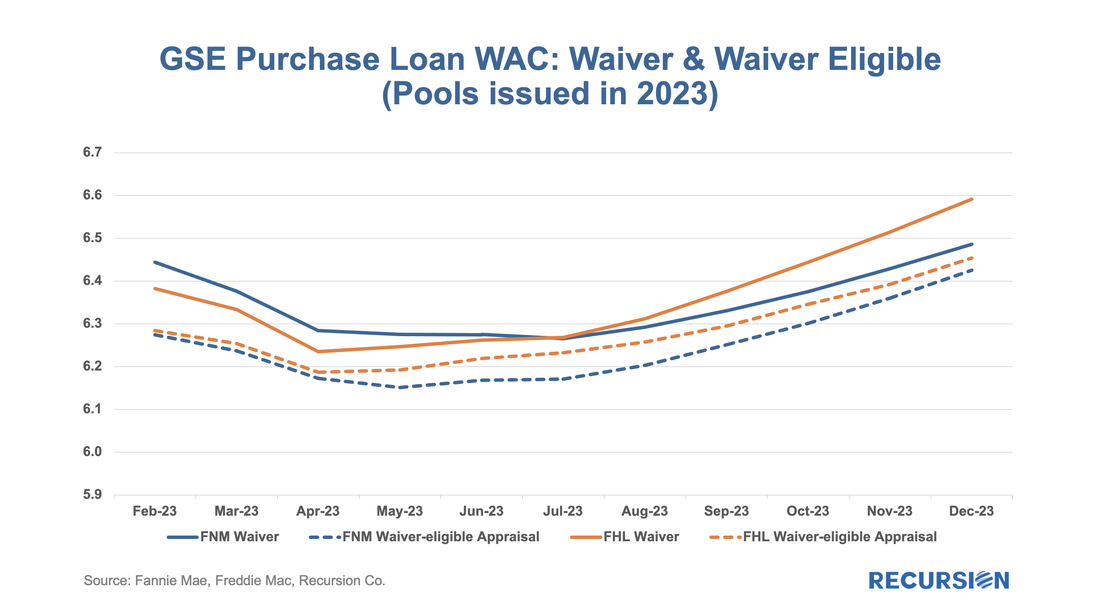 Those loans eligible for waivers but that obtain appraisals have lower loan rates and prepayment rates than loans with waivers, likely due to relatively reduced uncertainty surrounding valuation. Another key result that can be obtained from the chart is the more recent development whereby loans delivered to Freddie Mac with waivers have displayed persistently higher speeds than those delivered to Fannie Mae over the last six-month period. This corresponds with an increase in the pace of growth in FHL coupons compared to those of FNM over this period. It’s natural to ask if there are differences in loan characteristics that account for this gap. Below find the corresponding data for average credit scores across these categories: 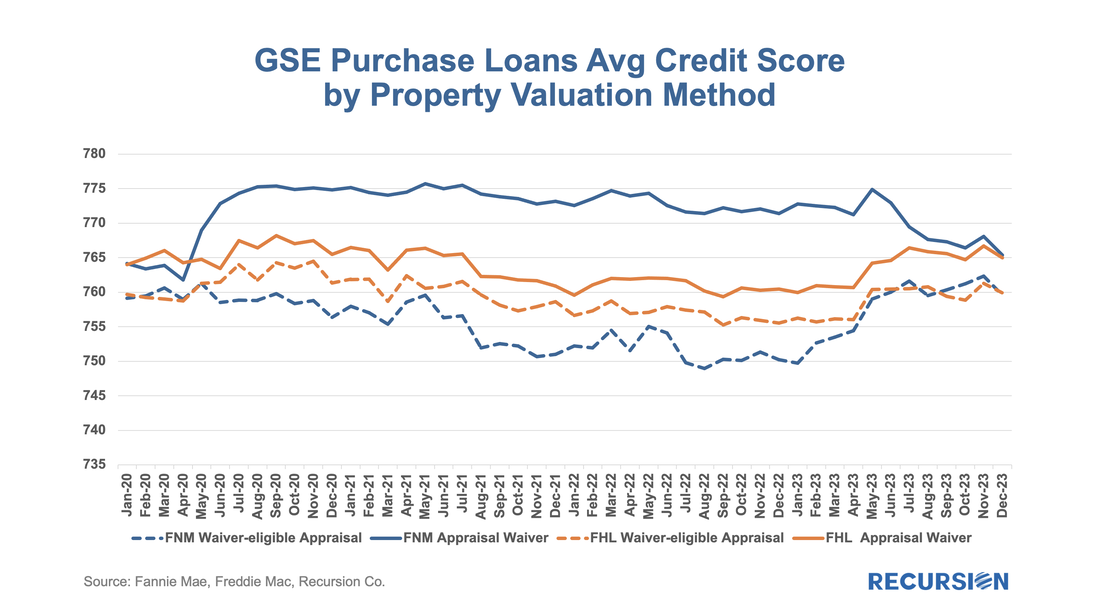 Over the past six months, FNM has loosened its credit standards for waivers as measured by credit scores relative to Freddie Mac. As this would tend to boost FNM coupons vs FHL, another explanation would seem to be required. We can speculate that FHL is discouraging waivers for its own risk-management purposes, but there is no verifiable support for this view. We can, however, see if this pattern persists in the newer appraisal types. 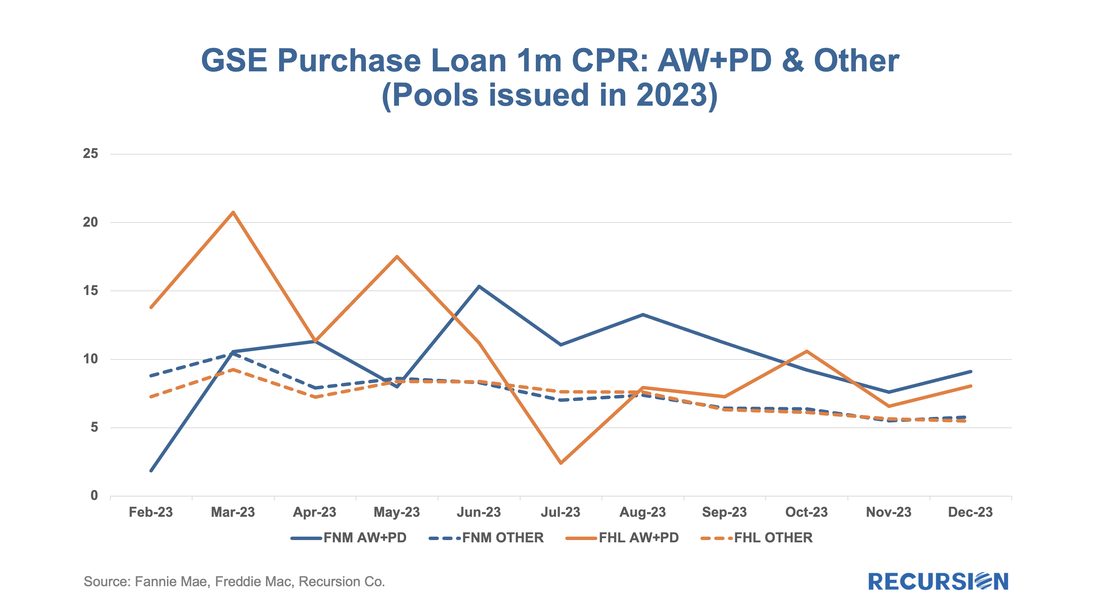 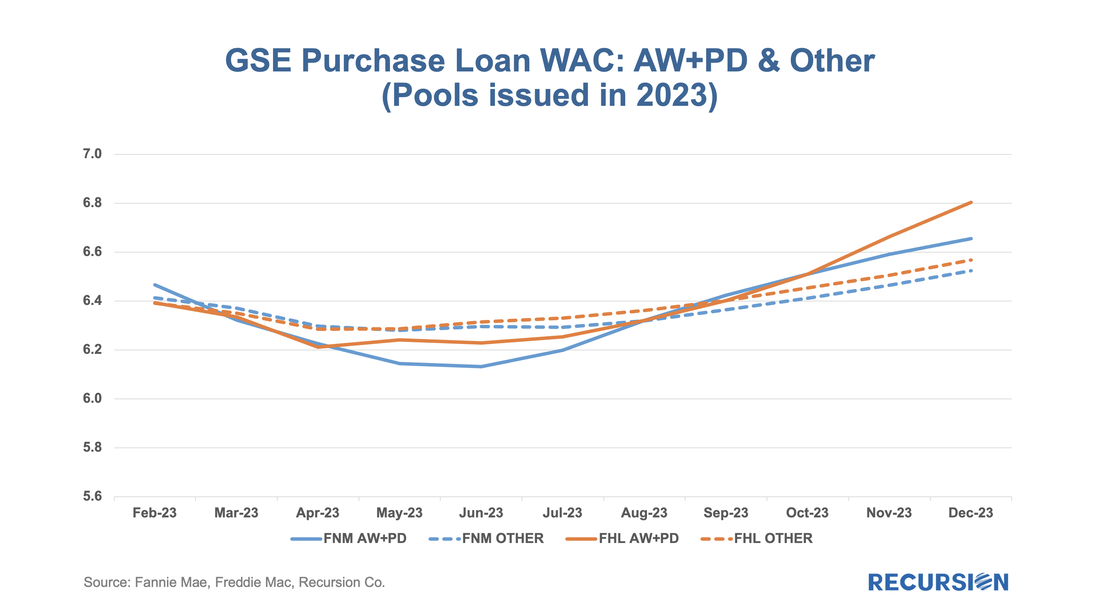 The loan counts here are quite small, so it is not surprising to see a noisy CPR chart for these categories. On the other hand, the trend increase in FHL AW+PD loans relative to those of Fannie Mae can be seen, although it is a more recent development in this case. Our conclusion is there is enough distinction here to say that modelers and traders ought to keep an eye on collateral risk as an independent factor in their decisions. We kicked off 2024 with a post looking at the sensitivity of low-income borrowers to a slowdown in the economy[1]. We saw continued solid correlations between labor market conditions and jobless claims, particularly for low-income borrowers. At present, these all remain near historically low levels. However, we also saw growing distress in some categories of borrowers with modified loans. It seems that policymakers are going to great lengths to keep homeowners out of foreclosure. This effort falls directly out of the experience of the Global Financial Crisis, where six million households lost their homes while only one-quarter of these regained homeowner status afterwards[2]. This led to a persistent period of slow growth in the decade following the crisis, a situation that policymakers have become determined to avoid. Consequently, when the COVID-19 pandemic hit, policymakers were prepared with a policy of forbearance where households who were impacted by the disease were allowed to defer payments until their economic situation improved. The policy was extraordinarily effective. Unemployment and House Prices in Two Crises 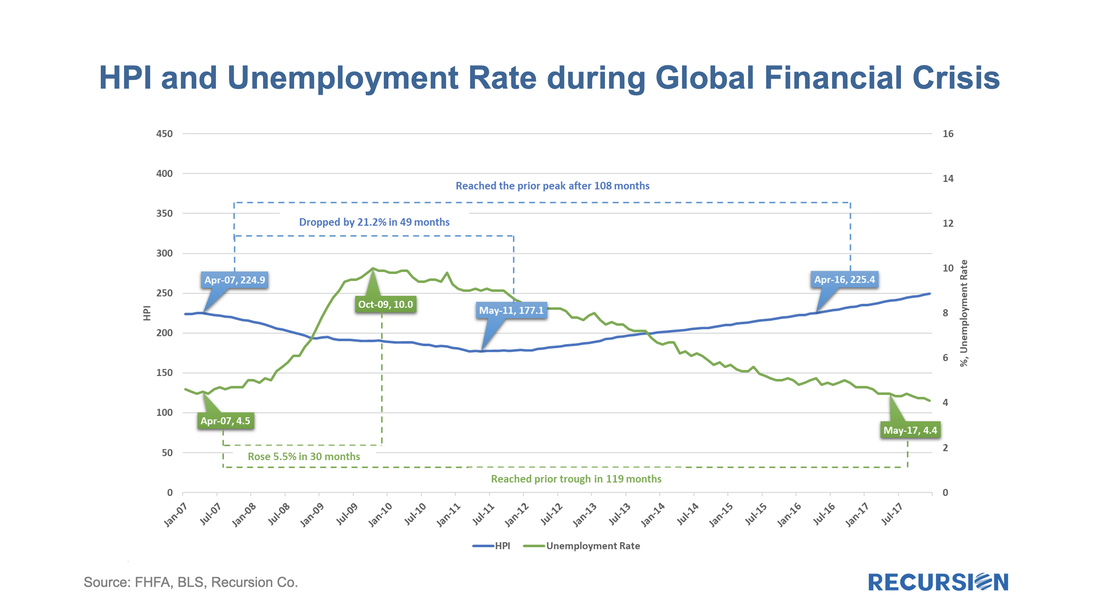 As part of its year-end market review, Housing Wire picked up Recursion’s theme of “Mortgage Winter”. On December 22, in an article entitled “‘Mortgage winter’ is expected to thaw a bit”, Recursion Chief Research Officer Richard Koss is extensively quoted. “Koss points to the huge volume of low-rate mortgages outstanding as the vexing problem the market faces. He said ‘I think a mortgage winter has frozen things hard and conditions are such that we can only expect a measurable improvement out past 2030.’ 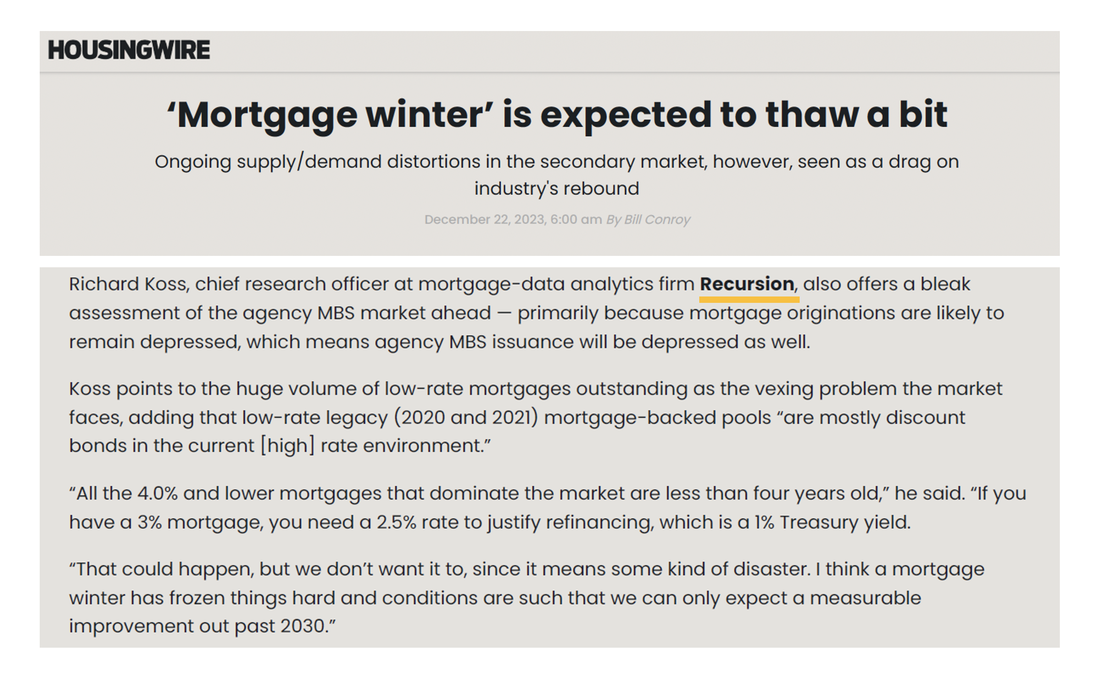 Recursion is proud to apply its advanced data and analytic tools to contribute to the ongoing dialogue about the market environment for the mortgage market.
Please reach out to inquiry@recursionco.com if you would like a copy of the article. In a January 5, 2024 article entitled “Agencies Seen Leading Multifamily Lending”, Commercial Mortgage Alert reported that “Last year, Fannie purchased $52.6 billion of multifamily loans, according to Recursion Co. Freddie purchased $41.1 billion through November.” Both figures are below the regulatory caps set by FHFA of $75 billion each. 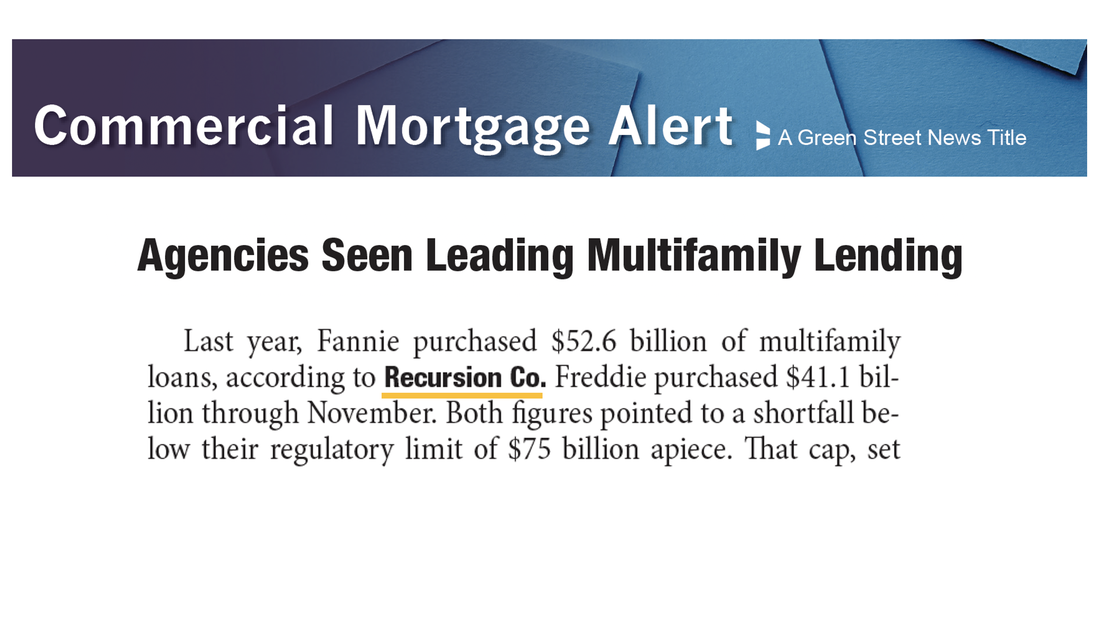 Recursion is proud to be the trusted data provider to the preeminent news outlets in the mortgage industry.
Please reach out to inquiry@recursionco.com if you would like a copy of the article. |
Archives
February 2024
Tags
All
|
 RSS Feed
RECURSION |
|

Copyright © 2022 Recursion, Co. All rights reserved.