
|
The millennial generation has reached peak home buying age, covering a range of about 25-40 years old. Just this year this cohort at 72.1 million passed the baby boom generation in sheer size[1] although this is a bit less than the 78.8 million peak reached by boomers in the late 90’s[2]. Millennial presence or lack of it in the housing market has been the subject of voluminous commentary, ranging from extreme optimism derived from the magnitude of the population bulge to caution related to affordability and impediments to building savings stemming from student loan debt[3] and high rental and child care costs[4]. What can big data tell us about this? A 2018 study by the Federal Reserve showed that Millennials had lower incomes and assets and higher debt than previous cohorts at a similar age[5]. Our data sets can provide some useful, but far from conclusive, insights into these trends since the onset of the Covid-19 pandemic. Covid-19 is both a cyclical and structural shock. On the cyclical side mortgage rates have fallen to record lows as the Federal Reserve responded quickly and decisively to the health crisis. On the structural side, residents of urban areas have picked up and fled to less dense locations, resulting in a sharp increase in house prices nationally. According to Redfin these price gains have been led by those in rural and suburban areas, rendering these areas less affordable, while urban areas remain out of reach for most. 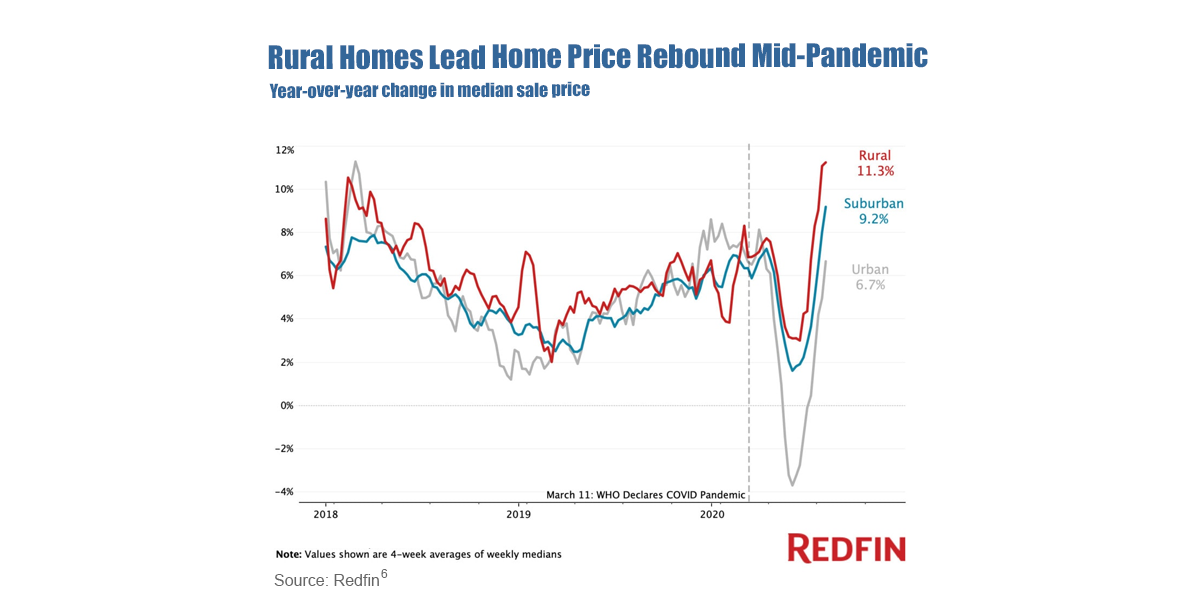 In our third look at 2019 HMDA[1] characteristics we look at mortgage originations by income bracket. Lending to low- and moderate-income households is an important regulatory requirement of banks[2]. The definition of “low” and “moderate” depends on the local area in which the bank operates. HMDA data is well-suited to regulators looking to track the performance of the institutions they oversee and allows banks to benchmark their performance against their competition. If banks need to add low- to moderate-income loans to their portfolio to meet requirements, HMDA can provide direction regarding which institutions might be a source of product that meets needed characteristics. Below we present a quick high-level example. HMDA data operates down to the census tract level, but for our purposes here let’s look at two distinct states: California and Oklahoma. In 2018, median income in the two states was $70,500 and $54,400, respectively[3]. According to Zillow data[4], the median house prices in California and Oklahoma that year were $550,000 and $122,000 respectively. Clearly housing is relatively unaffordable for households at or below median income in California compared to Oklahoma. So it is not surprising that the homeownership rate in Q2 2018 for California, at 54.3%, is substantially below that of Oklahoma, at 69.1%[5]. Confirming this, the following table from 2018 and 2019 HMDA show that there is a substantially greater share of lower- and moderate- income loans available in Oklahoma than in California. Interestingly this share declined in 2019 relative to 2018, particularly for Oklahoma. It is not clear whether this is due to fundamental factors or technical issues related to an increase in the share of “N/A” responses between the two years. 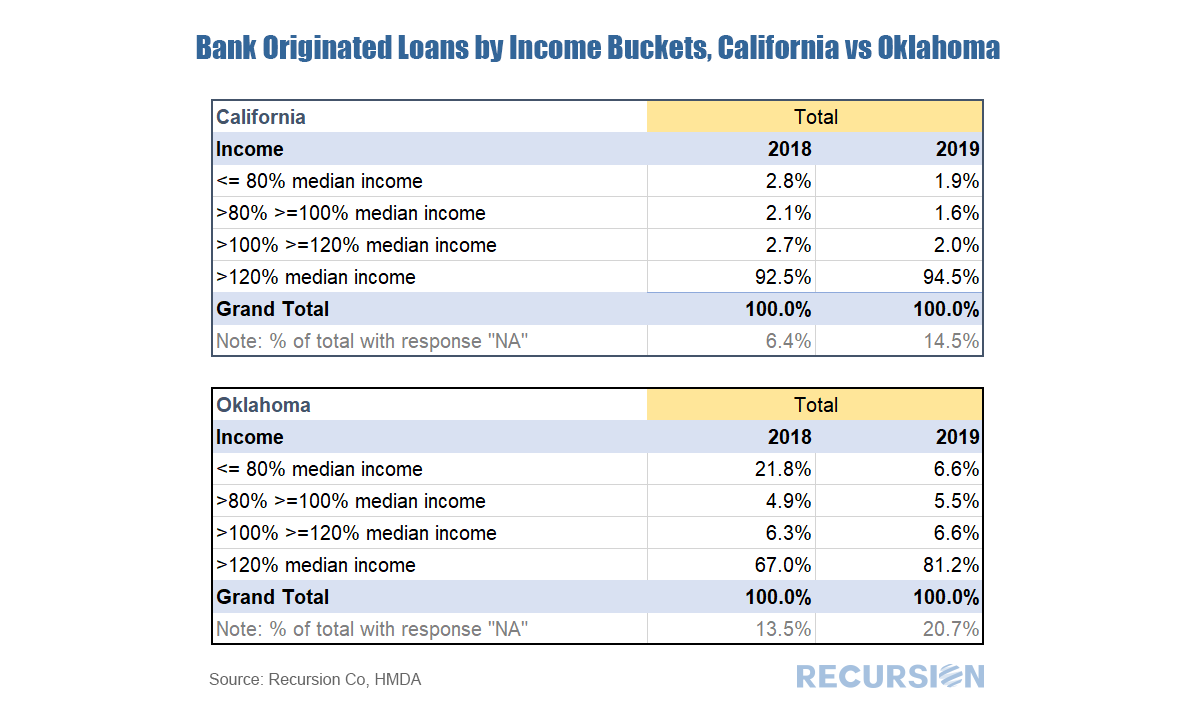 Finally, to be consistent with prior posts we look at the share of conforming loans originated by banks that are sold to the GSEs, broken down by income brackets: 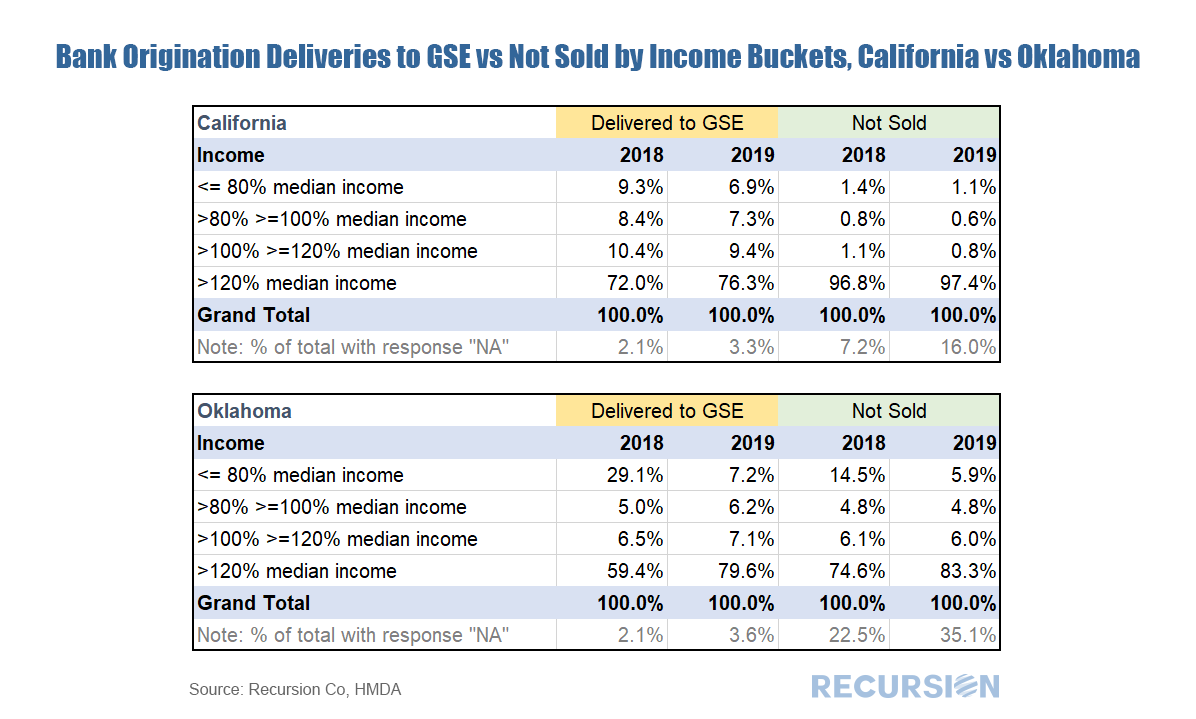 A few interesting observations pop up. First, in California the loans that banks keep on their book are almost entirely made to the highest-income households. For Oklahoma, it’s a mixture of highest income and lowest income. This suggests that policy requirements regarding serving poorer communities plays a relatively greater role in Oklahoma than California. [1] The first two 2019 HMDA blogs are available at
https://www.recursionco.com/blog/what-is-the-credit-quality-of-loans-held-on-book https://www.recursionco.com/blog/credit-quality-held-on-book-2-looking-at-ltv [2] See for example, https://www.fdic.gov/regulations/resources/director/virtual/cra.pdf [3] Data from 1984 – 2018 can be found https://www2.census.gov/programs-surveys/cps/tables/time-series/historical-income-households/h08.xls [4] Taken from June 2018 data at https://www.zillow.com/ok/home-values/ and https://www.zillow.com/ca/home-values/ [5] https://www.census.gov/housing/hvs/data/rates/tab3_state05_2020_hmr.xlsx With the release of 2019 HMDA data, we now have two years of loan-level information that contains both demographic and credit characteristics. Demographic information in HMDA includes income, race, and geography down to the census tract level, while credit characteristics include DTI. Our agency loan level databases contain a richer set of information regarding lending characteristics, but limited data on geography and demographics. For institutions looking to benchmark their performance in affordable and minority lending for regulatory purposes, 2019 HMDA, with data on thousands of lenders, is an invaluable tool. If you are interested in finding out more, please reach out. There are of course policy uses for this data as well. A significant difference between HMDA and the agency pool loan-level data is that HMDA contains data for loans held on book, the so-called “Unsold” category. This allows a comparison of loans that banks originate and keep and those they deliver. We can break this down in any number of ways, but let’s look at it for conforming loans broken down by DTI. 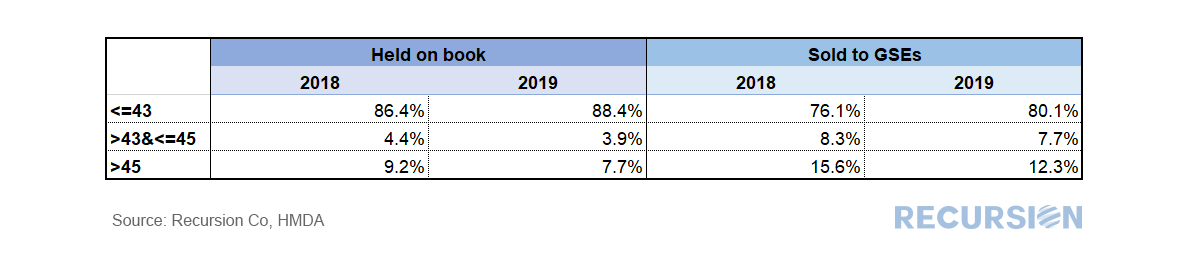 In the table above, we can readily observe that banks tend to keep higher-quality loans (as measured by DTI<=43) compared to those they deliver to the Enterprises. Of course, this is not a complete picture of this issue; there are many other ways to slice the data (credit score, LTV, loan size, geography). Moreover, as there is a correlation between low LTV and desirable loan characteristics for regulatory purposes (minority status, low income), we cannot simply conclude that it’s a matter of keeping the best for themselves. A second interesting question is: did behavior in this regard change between 2018 and 2019? Below you can find a chart of the change in the distribution between unsold and delivered loans between these two years. 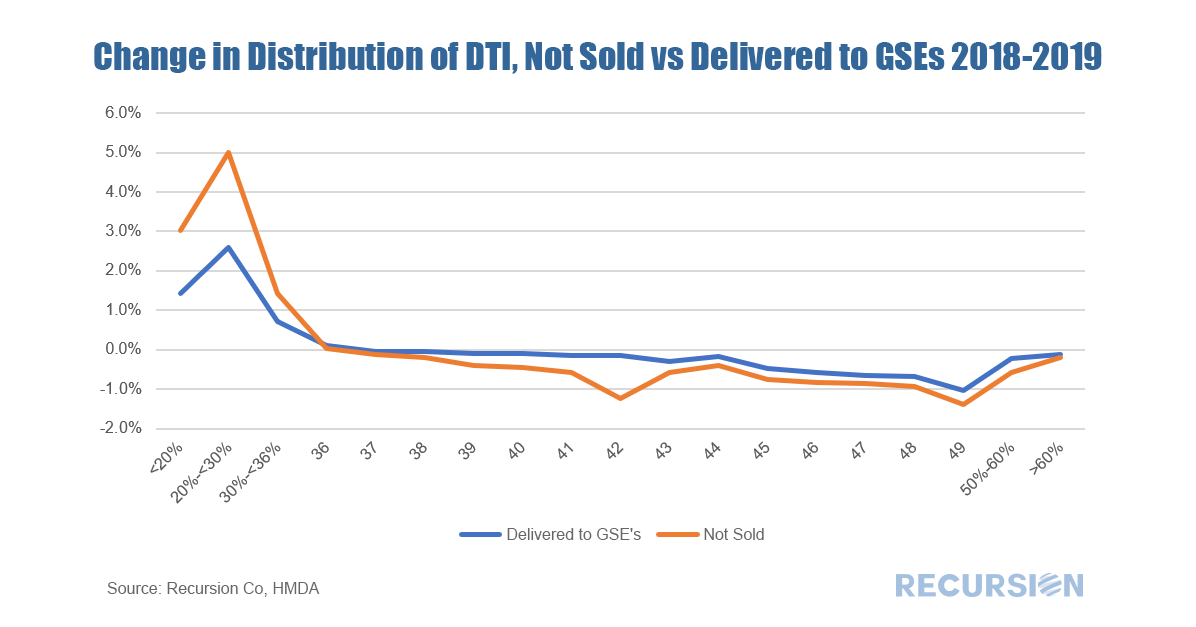 It appears that banks kept more of the loans associated with very low levels of indebtedness (DTI<35) in 2019 compared to 2018, while they distributed a small share of higher-risk loans across the spectrum of DTIs above that level.
Explanations for such behavior are the subject of future research. 2019 HMDA data has been released and is loaded into Recursion’s HMDA Analyzer so clients can perform consistent queries back to 1990. As always, a vast wealth of information is available. Below are several high-level observations. First, total originations rose by over $700 billion compared to 2018[1], a 13-year high. The bank share fell for the eighth consecutive year, reaching a record low of 37%. This was down 1 percentage point from 2018, the smallest decline posted for 8 years. Nonetheless, banks have suffered a remarkable 30-point drop in market share since 2008. 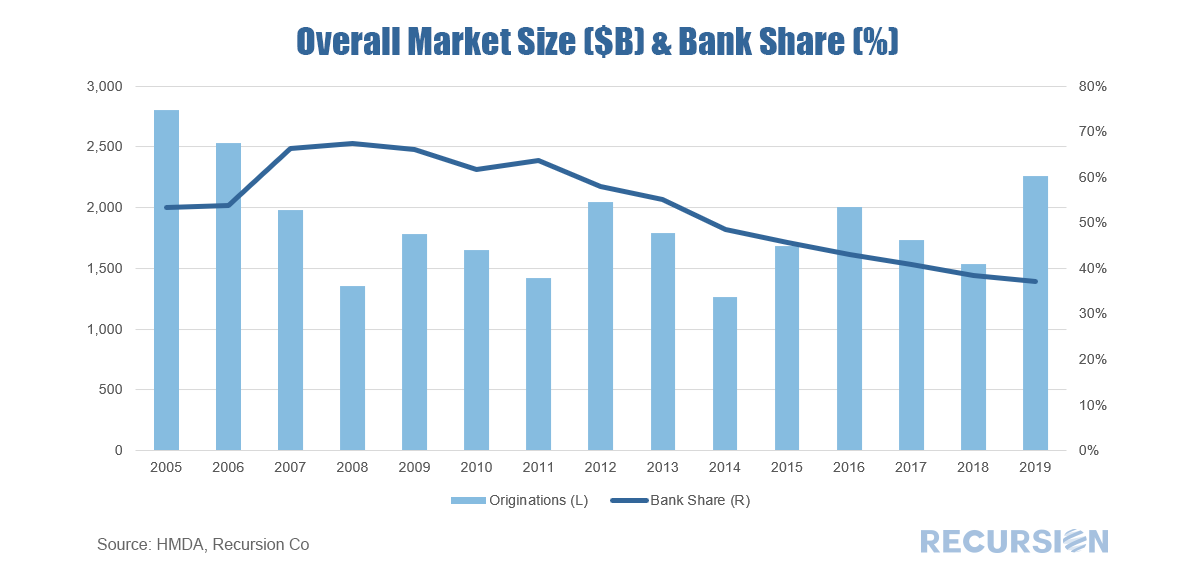 Overview
With the onset of the Covid-19 crisis, the role of the banking sector has once again risen to the forefront of concern. As noted in an earlier post[1] the sharp spike in unemployment is certain to lead to a surge in delinquencies. Substantial purchases by the Federal Reserve of Mortgage Backed Securities (MBS) have had a limited impact on rates facing borrowers[2] due in part to uncertainty around the magnitude of the losses and who will bear the costs. Policies regarding forbearance and liquidity provision to mortgage servicers are having an impact on lending standards and the availability of credit. Banks play a significant role in the mortgage pipeline as originator, servicer and investor. Most of the current focus is on the first two, but the importance of their role as investor is also crucial. According to Home Mortgage Disclosure Act (HMDA) data Recursion uploaded to the cloud, 3.1 million individual single family loans with a balance of $739.4 billion were originated in 2018 by the banks, of which 60.4% were held on their balance sheet. Each loan file in the data set contains many characteristics, including originator information. As banks originated about 43% of all mortgages that year, the implication is that about one quarter or all residential mortgage production was kept by the banks. In February 2019, BB&T announced its acquisition of SunTrust Bank for about $28 billion in stock[1]. In December that year, the nation’s 6th biggest bank, Truist, was created[2]. There are, of course, a multitude of reasons why financial institutions merge. A classic explanation is that they wish to obtain economies of scale by combining overlapping operations in particular markets. As regional commercial banks with a heavy consumer focus, both these institutions faced earnings pressure from developing headwinds in the mortgage market as interest rates climbed in 2018. (Table 1).
|
Archives
August 2026
Tags
All
|
 RSS Feed
RECURSION |
|

Copyright © 2024 Recursion, Co. All rights reserved.